Case study on the impact of
cogeneration and thermal storage
on the flexibility of the power
system
Kavvadias, K. Jimenez Navarro, J.P., Zucker, A., Quoilin, S.
This publication is a Science for Policy report by the Joint Research Centre (JRC), the European Commission’s science and knowledge service. It aims to provide evidence-based scientific support to the European
policymaking process. The scientific output expressed does not imply a policy position of the European Commission. Neither the European Commission nor any person acting on behalf of the Commission is responsible for the use that might be made of this publication.
Contact information Name: A. Zucker
Address: European Commission, Westerduinweg 3, P.O. Box 2, 1755 ZG Petten, Netherlands Email: andreas.zucker@ec.europa.eu Tel.: +31 224 56 5059 JRC Science Hub https://ec.europa.eu/jrc JRC110285 EUR 29082 EN
PDF ISBN 978-92-79-77808-7 ISSN 1831-9424 doi:10.2760/814708
Luxembourg: Publications Office of the European Union, 2017 © European Union, 2017
Reuse is authorised provided the source is acknowledged. The reuse policy of European Commission documents is regulated by Decision 2011/833/EU (OJ L 330, 14.12.2011, p. 39).
For any use or reproduction of photos or other material that is not under the EU copyright, permission must be sought directly from the copyright holders.
How to cite this report: Kavvadias, K., Jimenez Navarro, J.P., Zucker, A., Case study on the impact of cogeneration and thermal storage on the flexibility of the power system, EUR 29082 EN, Publications Office of the European Union, Luxembourg, 2017, ISBN 978-92-79-77808-7 , doi:10.2760/814708, JRC110285 All images © European Union 2017, except: Cover image, tomas - stock-adobe.com
Case study on of the impact of thermal storage and competing options on the flexibility of the power system
This work investigates the optimal operation of cogeneration plants combined with thermal storage. To do so, a combined heat and power (CHP) plant model is formulated and incorporated into Dispa-SET, a JRC in-house unit commitment and dispatch model. The cogeneration model sets technical feasible operational regions for different heat uses defined by temperature requirements.
Contents
Executive summary ... 2
1 Introduction ... 3
2 Model ... 6
2.1 Model background... 6
2.2 Conceptual scheme of new model features ... 6
2.3 Cogeneration model ... 7
2.3.1 CHP categories and operation regions ... 7
2.3.1.1 Backpressure turbines ... 7
2.3.1.2 Extraction/condensing turbine ... 8
2.3.2 The effect of temperature of extraction in the operation of the CHP plants .. 9
2.4 Power to heat model ... 11
2.5 Thermal storage model ... 11
2.6 Evaluation of system performance ... 11
3 Case study ... 13
3.1 Base case scenario ... 13
3.2 Alternative scenarios ... 14
3.3 CHP parameters characterisation ... 15
3.4 Cost data ... 16
4 Results ... 17
4.1 The effect of centralised CHP deployment ... 21
4.2 The effect of thermal storage ... 21
4.3 The effect of the heat extraction temperature... 23
4.4 Power plant statistics ... 25
4.5 Optimum scenario selection ... 26
5 Conclusions ... 27
References ... 29
List of abbreviations and definitions ... 31
List of figures ... 32
List of tables ... 33
Annexes ... 34
Authors Kavvadias, K.
Jimenez Navarro, J.P. Zucker, A.
Executive summary
The coupling of the heating and the electricity sectors is of utmost importance when it comes to the simultaneous achievement of the decarbonisation and the energy efficiency targets. A fundamental element of this coupling is centralised cogeneration plants connected to district heat networks.
Despite the efficiency benefits, the effects of introducing combined generation to the power system are sometimes adverse. Reduced flexibility caused by contractual obligations to deliver heat may not always facilitate the penetration of renewable energy in the energy system. Thermal storage is acknowledged as a solution to the above. This work investigates the optimal operation of cogeneration plants combined with thermal storage. To do so, a combined heat and power (CHP) plant model is formulated and incorporated into Dispa-SET, a JRC in-house unit commitment and dispatch model. The cogeneration model sets technical feasible operational regions for different heat uses defined by temperature requirements.
Different energy system scenarios are used to assess the implications of the heating– electricity coupling to the flexibility of the power system and to the achievement of the decarbonisation goals in an existing independent power system, where CHP plants provide heating and electricity to nearby energy dense areas.
The analysis indicates that the utilisation of CHP plants contributes to improve the overall efficiency and reduces total cost of the system. In addition, the incorporation of thermal storage increases the penetration of renewable energy in the system
Highlights
1. Model of centralised cogeneration plants with varying heat temperatures 2. Co-optimization of heat and power using a unit commitment MILP model 3. CHP plants increase the overall efficiency and affordability
4. Thermal storage reduces the curtailment of renewable while increasing the overall efficiency
5. CHP with low temperature heat has better chance to penetrate in competitive heat markets
1 Introduction
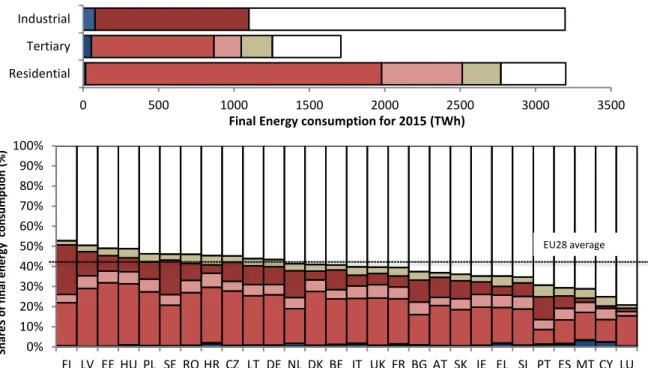
The heating and cooling sector has been recently recognised as a priority to achieve decarbonisation targets. It accounts almost for half of the EU energy consumption. In particular the total demand for heating and cooling in 2015 amounted to 5,123 TWh. Heating and cooling are consumed in three main sectors, namely residential, tertiary and industry, with the residential (mainly households buildings) representing the highest share. The residential sector accounted for 54% of final energy heating and cooling consumption in 2015, followed by services’ share of 21% and industry's of 24% (Fig. 1)1. In general the heating and cooling sector is characterised by low efficiencies, and large amounts of waste heat (European Commission 2016).
Fig 1 a) Final energy consumption per sector and end-use, b) Shares of final energy consumption per end-uses and Member States. Data are based on 2015 balances.
Data source: IDEES database (Mantzos et al. 2017)
To study the effect of energy efficiency improvements, a holistic energy system approach is required, meaning the integration of different sectors such as transport, electricity and the heating sector itself (H. Lund et al. 2017). This not only allows the evaluation of all potential options for a future sustainable energy system, but also the assessment of its feasibility and the identification of operational bottlenecks. One such bottleneck is the lack of flexibility of the power system with high shares of variable renewable energy sources.
Based on this approach, the study of the heating and electricity sector coupling is of outmost importance given the size of the heating sector on one hand and the opportunity of their linkage to integrate more renewable power generation via different thermal energy solutions offers on the other (Brown et al. 2016; P. D. Lund et al. 2015). Among other advantages, this linkage may enable thermal energy storage, widely acknowledged as a key enabling technology to decarbonise power systems (Sisternes,
1 Own analysis based on IDEES database (Mantzos et al. 2017). For the industry, only steam and hot water
0% 10% 20% 30% 40% 50% 60% 70% 80% 90% 100% FI LV EE HU PL SE RO HR CZ LT DE NL DK BE IT UK FR BG AT SK IE EL SI PT ES MT CY LU Sh ar e S o f f in al e n e rg y c o n sump ti o n ( % )
Space Cooling Process Cooling Space Heating Hot Water Process Heating Cooking Non H&C EU28 average
0 500 1000 1500 2000 2500 3000 3500
Residential Tertiary Industrial
Jenkins, and Botterud 2016). Off-peak electricity can be used to heat water in storage tanks to perform daily load shifting. Compared to electrical energy storage, thermal energy storage is about two order of magnitudes more cost effective, which makes it an attractive solution to increase flexibility and maximise the use of available energy sources (H. Lund et al. 2016).
Combined heat and power (CHP) plants, which can reach a total efficiency of up to 90% (Grohnheit 1993), are important elements of this linkage. They have been recognised in the EU as the most efficient way to generate useful energy from fossil-fuelled energy sources (European Union 2012). Existing steam-based power plants that are currently operating as power units could modify their operation to deliver heat simultaneously with a limited investment cost compared to the investment of a new plant. Therefore, the CHP potential relies not only on existing units but also on those power plants that could be retrofitted.
The EU Reference scenario (Fig. 2) envisages increasing shares of CHP for many Member states along with high shares of non dispatchable renewable energy sources.
Fig 2 Share of installed net generation capacity per year and Member State according to the EU reference scenario 2016. The dotted line separates the real historical data with the projected
values
Data source: (European Commission 2016b) Legend: RES (dispatchable) RES (non dispatchable) CHP Other
The utilisation of CHP with a new generation of district heating networks could even maximise the utilisation of both electricity and heating. These new district heating networks, also known as 4th generation district heating systems (H. Lund et al. 2014) are characterised by low temperatures (30 – 70 °C), facilitate the integration of multiple energy sources, even those with low quality (i.e. low enthalpy). The reduction of the temperature allows the CHP plant to extract heat in a late stage of the steam turbine, reducing the amount of electricity that is lost and consequently increasing the overall efficiency.
To sum up, combined heat and power technologies in combination with efficient district heating networks and competitive thermal storage, set the ground for achieving more flexible and efficient energy systems (International Energy Agency 2014). All these opportunities may unlock the full potential of district heat networks, which currently have only reached a ten percent of the total heat supply worldwide, but with high disparities between countries (Werner 2017).
In the literature, a set of studies on the optimal operation of CHP plants have been focused on the minimisation of the power system costs. Some authors have worked on the validation of different mathematical approaches using methods such as linear, mixed-linear or non-linear programming (Mellal and Williams 2015; Mohammadi-Ivatloo, Moradi-Dalvand, and Rabiee 2013; Ommen, Markussen, and Elmegaard 2014; Haghrah, Nazari-Heris, and Mohammadi-ivatloo 2016). However, these studies have not addressed the quality of the heat produced and its adequacy to meet specific heat applications. Other authors have studied thermo-economic aspects of the operation of CHP plants to optimise their operation such as temperature and pressure of the input steam flow and mass flows rates from an energy and exergy economic perspective (Ziebik et al. 2010). Driven by the evolution of modern thermal networks that allow a wide range of operating temperatures, this work focuses on both aspects, mainly: the minimisation of the power system costs including the cogenerated heat and the analysis of the quality of the heat based on the demand side temperature requirements. This approach allows a more thorough analysis of the benefits derived from low-temperature heat networks when operating a CHP plant. Thus, the scope of this work is to present a method to co-optimise and analyse the operation of a power and heating system combined with thermal storage under different energy market assumptions and thermal requirements. This method is based on a detailed model of the short-term operation of large-scale power systems and the results are presented and discussed via a comprehensive scenario analysis of a case study.
The report is organised as follows: section 2 presents the model implemented, and section 3 sets out the experimental design including the baseline power systems. Section 4 covers results derived from the different scenarios and section 5 presents the conclusions of the benefits derived from the linkage between heating and cooling sectors.
2 Model
2.1 Model background
This work is built upon the Dispa-SET model, an open source unit commitment and dispatch model of the European power system. The aim of this model, implemented as a mixed-integer linear programming, is to optimise with a high level of detail the short-term operation of large-scale power system, solving the unit commitment problem (Quoilin, Hidalgo González, and Zucker 2017). The objective function of this model minimises the total power system costs, which are defined as the sum of different cost items, namely: start-up and shut-down, fixed, variable, ramping, transmission-related and load shedding (voluntary and involuntary) costs. The results include the optimal mix of power plants production, including renewable sources, that satisfies electricity demand at minimum cost over one year at an hourly time step resolution. All the modifications performed for this work are released as version 2.2 which is available online2.
To assess the interaction between heating and electricity sectors, a heating module has been developed and integrated into the existing model. It includes two main elements; formulation of cogenerated steam-driven plants that produce both power and heat and thermal heat storage. In the following section a detailed explanation of the CHP and storage models is provided.
2.2 Conceptual scheme of new model features
The aim of the proposed model is to assess the benefit derived from converting steam turbine plants into CHP plants in the power system. This benefit may be affected by market aspects, such as the power and heating demands that have to be satisfied and the prices in the heat market, design aspects as the availability of thermal storage capacity and additional operational aspects as the temperature of the heat supply. The complete system developed for this study is presented in Fig. 3. It includes a specific heating module, which is explained in detail in section 2.3 and a thermal storage module, presented in section 2.5.
In addition to the CHP and thermal storage models, an alternative heat supply (AHS) energy vector is considered in order to capture individual heat supply options. This energy flow allows studying the behaviour of systems for different heating cost scenarios. If this value is high then it imposes a must-run condition on the power plant since the cost of providing heat by the CHP is much lower. Thus, this energy vector allows the analysis of marginal heat costs from which heat supplied by CHP plants combined with the thermal storage become cost-effective. Depending on this cost, the system can choose the most cost efficient source of heat supply. By selecting high costs, must-run plants (e.g. CHP plant that have the contractual obligation to satisfy a specific amount of heat at specific time as defined by the heat demand curve) can be simulated.
Fig 3 Integrated energy system for the coverage of specific power and heat demand. Conceptual model layout. The dotted box includes the new model features implemented for this study.
2.3 Cogeneration model
This section analyses the cogeneration model formulation including different types and the estimation of its critical parameters.
2.3.1 CHP categories and operation regions
Typically, steam-driven CHP plants fall into two categories: (a) plants with a backpressure turbine producing heat and electricity in a fixed ratio, and (b) plants with an extraction/condensing turbine where part of the heat is extracted at an earlier stage and the rest of the heat is fully extracted and sent to the condenser (Grohnheit 1993). The former category is usually used in industries where heat production is a priority and all the heat has to be delivered as saturated steam at a specific Temperature. The latter is used in applications where production flexibility is desired. Multiple extractions deliver sensible heat in the form of hot water at a range of Temperatures reducing the power penalty which make it the perfect application for district heating systems.
2.3.1.1 Backpressure turbines
In the first category, CHP plants operate under a fixed power-to-heat ratio (σ) (Fig. 4). Mathematically, the operation of these power plants is given by Eq. (1).
𝑃𝐶𝐻𝑃= 𝜎 ∙ 𝑄𝐶𝐻𝑃 (1) CHP Storage Power demand Heat Demand (DH network) RES Thermal units
Fig 4 Feasible operation region. Steam plant with backpressure turbine
2.3.1.2 Extraction/condensing turbine
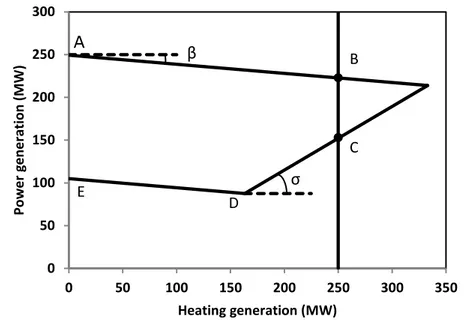
In the latter the heat production is more flexible and not fixed with the power production which makes them more appropriate for district heating applications. This flexible operation is modelled as a two-dimensional feasible operation region (FOR) of heat and power (Fig. 5). This approach enables a robust formulation of the dispatch optimisation problem from a mathematical perspective as it leads to a convex optimisation area. Under these assumptions, the FOR region is described by the power-loss line at maximum power (line A-B) and the power-loss line at minimum power (line E-D) as defined by the power-loss factor (β), and the line of maximum heat that, for a given fuel input, could be extracted guaranteeing the minimum required temperature at the end of the expansion process (line D-C). This line is defined by a fixed power-to-heat ratio (σ). Finally, the maximum heat extracted could also be limited due to technical constraints (line B-C) related to the minimum flow that has to pass through the last stages of the turbine.
Thus, a CHP power plant can be explicitly defined by three parameters (β, σ, Qmax) in addition to the minimum and maximum power limits of the standalone plant (Pmax and Pmin) (Table 1).
Table 1 CHP plant model parameters
Parameter Description
β Ratio between lost power generation and increased heating generation. Power-loss factor
σ Back-pressure ratio. Power-to-heat ratio per type of technology Pmax (Q=0) Maximum power generation when no heat extraction is considered Pmin (Q=0) Minimum power generation when no heat extraction is considered Qmax Maximum heat generation (minimum condensation constraint)
Fig 5 Feasible operation region for a CHP plant. The feasible operation region is defined by Eqs. (2) – (5):
𝑃𝐶𝐻𝑃,𝑖≥ 𝜎 ∙ 𝑄𝐶𝐻𝑃,𝑖 (2)
𝑃𝐶𝐻𝑃,𝑖 ≤ 𝑃𝐶𝐻𝑃,𝑚á𝑥− 𝛽 ∙ 𝑄𝐶𝐻𝑃,𝑖 (3)
𝑃𝐶𝐻𝑃,𝑖 ≥ 𝑃𝐶𝐻𝑃,𝑚𝑖𝑛− 𝛽 ∙ 𝑄𝐶𝐻𝑃,𝑖 (4)
𝑄𝐶𝐻𝑃,𝑖≤ 𝑀𝑎𝑥𝐻𝑒𝑎𝑡𝐶𝐻𝑃 (5)
2.3.2 The effect of temperature of extraction in the operation of the CHP
plants
While Pmax and Pmin are fixed by the initial plant design, β and σ are dependent on the design temperatures namely extraction and condensing temperatures as described in (Verbruggen, Klemes, and Rosen 2017). Based on these two parameters, the FOR is modified leading to a trade-off between power and heat outputs. Thus, the higher the extraction temperature is, the lower the limit for maximum electricity production and the higher the amount of heat that could be extracted.
In addition, the selection of these temperatures determines the maximum efficiencies and the point of maximum heat and power at which the plant can operate.
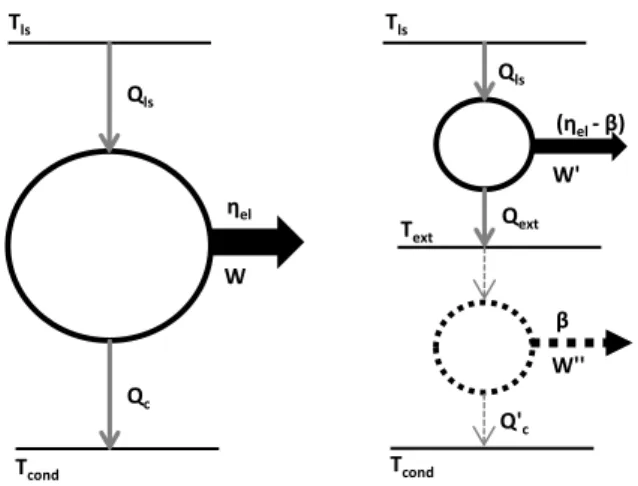
To mathematically describe the relation between the extraction temperature and the two parameters, we have approximated the CHP plant as a virtual steam cycle heat pumps (Lowe 2011). Based on this concept, electricity is sacrificed in order to deliver heat at a higher temperature than the condensing temperature. Under this assumption the parameter β is equal to the efficiency of a virtual steam cycle between Text and Tcond. For the temperature range under consideration (<120 °C) we can safely use the Carnot cycle with minimum loss in accuracy (less than 5%) (Fig. 6).
Then if we assume that the CHP plant operates without heat extraction, its efficiency, which is the electric efficiency as no heat production is assumed, is given by Eq. (6)
𝜂 = 𝑊 𝑄𝑙𝑠 ≈ 1 − 𝑇𝑐𝑜𝑛𝑑 𝑇𝑙𝑠 (6) where: 0 50 100 150 200 250 300 0 50 100 150 200 250 300 350 Pow e r gen e ration (M W) Heating generation (MW)
B
C
D
E
β
σ
A
Tls ≡ Temperature of the life steam input flow
Tcond ≡ Condensing temperature, typically assumed as 10 °C higher than the ambient temperature to guarantee heat transfer in the condenser.
Applying the same expression for the two-steps Carnot cycle between the temperatures Tls and Text input heat remains contact, we obtain a relation between the amount of electricity produced in both cases, given by Eq. (7).
Fig 6 Steam cycle scheme. No extraction (left) and extraction (right) operations
𝛽 = 𝑇𝑒𝑥𝑡− 𝑇𝑐𝑜𝑛𝑑
𝑇𝑐𝑜𝑛𝑑 (7)
where β power-loss ratio, Text the desired extraction temperature and Tcond the condensing temperature, which is assumed 10 – 15 °C higher than the ambient temperature.
The power-to-heat ratio, defined by Eq.(8), is calculated by applying Carnot efficiency – Eq. (6) – and the energy balance – Eq. (9).
𝜎 = 𝑊′
𝑄𝑒𝑥𝑡 (8)
𝐹 = 𝑄𝑙𝑠= 𝑊′ + 𝑄𝑒𝑥𝑡 (9)
With these two relations and the Carnot efficiency, σ is given by Eq. (10)
𝜎 = 𝜂𝑖𝑠𝑒 ∙ (1 − 𝑇𝑒𝑥𝑡 𝑇𝑙𝑠) 1 − 𝜂𝑖𝑠𝑒 ∙ (1 − 𝑇𝑇𝑒𝑥𝑡 𝑙𝑠) (9)
where σ the power-to-heat ratio, Tls the live steam temperature, typically of the order of 500 – 600 °C, and 𝜂𝑖𝑠𝑒 the isentropic efficiency (usually assumed 80 – 85%)
(Verbruggen, Klemes, and Rosen 2017). A literature review has been carried out to compare typical values for the assumed parameters of β and σ (Annex B).
Fuel consumption and overall efficiency are defined by Eqs. (3) – (4). We assume a linear relationship between the fuel consumption and the power load (Lythcke-Jørgensen et al. 2016). F =𝑄𝑙𝑠= 𝑃 + 𝛽 ∙ 𝑄 η𝑒𝑙 (10) Tls Tcond ηel Qls Qc Text Tls Qls (ηel- β) Qext β Q'c Tcond W'' W' W
η = P + Q
F (11)
where F is the Fuel (MW), P is the power produced (MW), Q is the heat produced (MW), and ηel is the reference electric efficiency of the single-purpose plant.
This formulation, which captures the effect of temperature, allows the study of the role of the CHP plants supplying heat at different extraction temperatures in future energy systems.
2.4 Power to heat model
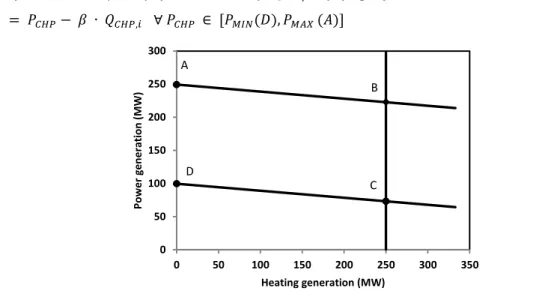
In addition to the two previous categories, power plants may be coupled with resistance heater or heat pumps. In these cases, the feasible operating region is the set of lines defined by the power-loss factor (β) between the line of maximum power (line AB) and the minimum power line (line DC). The power-loss factor represents the inverse of the COP or efficiency. The vertical dotted line corresponds to the heat pump (or resistance heater) thermal capacity (as defined by QCHP,max) (Fig 7).
𝑃𝐶𝐻𝑃,𝑖 = 𝑃𝐶𝐻𝑃− 𝛽 ∙ 𝑄𝐶𝐻𝑃,𝑖 ∀ 𝑃𝐶𝐻𝑃 ∈ [𝑃𝑀𝐼𝑁(𝐷), 𝑃𝑀𝐴𝑋 (𝐴)] (12)
Fig 7 Feasible operation region for a CHP plant coupled with resistance heater or heat pump.
2.5 Thermal storage model
The thermal storage model assumes well-mixed conditions (no stratification) and is thus expressed as a 1-node model. Energy balance and maximum capacity equations are written as follows:
𝑄𝑠𝑡(𝑡) = 𝑄𝑠𝑡,𝑖𝑛(𝑡) − 𝑄𝑠𝑡,𝑜𝑢𝑡(𝑡) − 𝑄𝑙(𝑡) + 𝑄𝑠𝑡(𝑡 − 1) (13)
𝑄𝑠𝑡(𝑡) ≤ 𝑄𝑠𝑡,𝑚𝑎𝑥 ∀𝑡 (14)
2.6 Evaluation of system performance
In order to compare different scenarios, the system was examined in three different dimensions:
— Affordability: Operational cost (OPEX), investment costs applicable for those scenarios in which the power capacity is modified (CAPEX)
— Efficiency and environmental impact: Overall efficiency of the system and RES curtailment
— Reliability: Share of energy demand that cannot be provided due to intermittent renewable energy supply, shed load.
0 50 100 150 200 250 300 0 50 100 150 200 250 300 350 Pow e r gen e ration (M W) Heating generation (MW) A B C D
The definition of the CAPEX indicator relies on the development of the different scenarios under investigation. To compute this indicator, three costs are considered; additional renewable power capacity compared to the base case scenario, the cost of converting steam turbines plants into CHP plants and the investment related to additional storage capacity.
Eqs. (4) – (6), show the mathematical formulation for the overall efficiency of the system, OPEX, CAPEX and total emissions respectively.
η = ∑ ∑ P(i, t) + ∑ ∑ Q(i, t)i t i t ∑ ∑ F(i, t)i t + ∑ AHS (t)t η
h
(15)
OPEX = ∑ (∑ F(t, i)) ∙ Ci t f + ∑ AHS(t) ∙ Ct AHS (16)
𝐶𝐴𝑃𝐸𝑋 = (∑𝑇𝑒𝑐ℎ∆𝐶𝑎𝑝𝑇𝑒𝑐ℎ∙ 𝐼𝑇𝑒𝑐ℎ) ∙ 𝑐𝑟𝑓 (17)
where the capital recovery factor (crf) is given by Eq. (18)
𝑐𝑟𝑓 = 𝑖 ∙ (1 + 𝑖)𝑛
3 Case study
The analysis conducted in this work compares the optimal dispatch of a combined heat and power system for different energy generation technology mix and operational variables, namely the cost of alternative heat supply and the extraction temperature of the CHP plants. The system is defined by given heating and electricity demands and by a fixed total power installed capacity, thereby establishing the base case scenario. Alternative scenarios are defined based on the share of available installed capacity by group of technology generations: renewable energy sources including wind and photovoltaic (RES), thermal generation, through steam turbines (STUR), through internal combustion engines (ICEN) and through combined cycles (COMC), and finally on the share of CHP when considered via the conversion of steam-based power plants into CHP. In addition, for the scenarios that include CHP plants, two additional variables are investigated; the availability of thermal storage and the temperature of the heat delivered by the CHP plants.
For this case we have selected a small insular energy system which has the potential to use CHP power plants to supply energy dense areas but also high renewable energy potential. This case was selected to demonstrate the desired effects because (a) there are no interconnections (b) the full potential share of CHP plants on the power system can be significant (up to 26%). The base scenario has 24 power plants of a total capacity of 1,681 MW.
3.1 Base case scenario
The base case scenario represents the current status of the energy system in which no large scale CHP plants are considered. Thus, this scenario sets the comparison framework to assess the benefits derived from the combined utilisation of heat and power and the incorporation of thermal storage. For this case, the RES contribution in terms of installed capacity is 12% and the rest (88%) is provided by thermal units that use natural gas (STUR, COMC) and oil (ICEN). This base case RES installed capacity constitutes a low RES scenario according to the definition of scenarios described in the following section. A summary of the installed capacity for each scenario is provided in Fig. 8.
Fig 8 Energy generation mix for the base case (a), high RES and no CHP (b), low RES and high CHP (c) and high RES and high CHP (d) scenarios
In this study, the proposed model considers the CHP units as the only available technology to link heat and electricity. Therefore, electricity and thermal problems are decoupled in the base case scenario. In that case, potential power plants convertible into CHP (432 MW of COMC) are only delivering electricity and grouped within the thermal
Oil Gas - Open cycle Gas - Combined cycle Solar Wind
0 200 400 600 800 1000 1200 1400 1600 1800
Installed Capacity (MWe)
(a)
(b)
(c)
generation group while, the heat is delivered via the alternative heat supply vector, which in this case represents conventional boilers with an overall efficiency of 85%. These different combinations of energy technologies have to meet fixed electricity and heating demands. These demands correspond to a climate zone characterised by warm winters and hot summers. Thus, August is the month with the highest power demand reaching a total sum of almost 500 GWh, while for the heat demand, January corresponds to the peak consumption, with a value of 140 GWh. Total annual demands for both electricity and heating demands are 4,350 and 900 GWh respectively (Fig. 9).
Fig 9 Electricity and heat demand set for the base case scenario. Monthly demand (left) and hourly demand for a typical winter day (right)
3.2 Alternative scenarios
The different scenarios are defined based upon the flexibility provided by the thermal generation. They are implemented by combining various levels of renewable and CHP penetration, availability and capacity of thermal storage, different costs for the AHS energy vector and the temperature of extraction in the CHP units (Table 2). In summary, three specification variables (share of renewables, share of CHP, cost of alternative heat supply) and two design variables (size of storage, temperature of extraction) explicitly define a scenario.
In all the scenarios, we considered a fixed capacity given by the base case scenario (1,681 MWe). In this way, if the share of renewable power capacity or the conversion of steam turbine plants into CHP increases, the capacity of remaining thermal units is reduced to maintain the total capacity of the system (Fig 8). This approach ensures a fair comparison between scenarios as allows examining the structural changes of the generation mix.
To build different CHP penetration scenarios, we assume that the total COMC capacity of 432 MW is covered by two power plants. The medium CHP scenario assumes the conversion of one of this COMC plants (216 MW) into CHP and the conversion of both for the high CHP scenario. The storage penetration level is linked to the CHP level: medium storage refers to one plant conversion scenario and high to both plants conversion. Table 2 shows the summary of the ranges considered for the parametric analysis. A total of 435 scenarios were created and run on an hourly resolution. The total simulation time was 20 hours on a high performance cluster.
Table 2 Variation range of the model parameters AHS prices (€/MWh) Share of RES (% of total capacity) Share of CHP (% of total capacity) Temperature of extraction (˚C)a Storage level (MWh)a
Low Medium High Low High Low Medium High Low High Low Medium High
10 20 50 12% 50% - 13% 26% 60 120 - 1,500 3,000
a These parameters only applies to scenarios that consider CHP
3.3 CHP parameters characterisation
As described in previous sections, the CHP plant model proposed is defined by 5 parameters (β, σ, Pmax, Pmin and Qmax). In our analysis we have assumed that there is no restriction in terms of the minimum amount of flow that has to leave the steam turbine. Then, the parameter Qmax is neglected and the Qmax point is given by the intersection of the power-loss line at maximum power (line A-B) and the line of maximum heat (line D-C), as described in Fig. 5. Concerning power capacity parameters, Pmax is given by the size of the existing steam-turbine based plants meanwhile Pmin has been calculated based on a fixed minimum capacity factor of 40% (Mellal and Williams 2015; Haghrah, Nazari-Heris, and ivatloo 2016; Sashirekha et al. 2013; Alipour, Mohammadi-Ivatloo, and Zare 2014).
Regarding σ and β parameters, they have been calculated based on the Eqs. (1) – (2). To determine the values of the power-loss parameter (β) a condensing temperature of 30 °C has been considered.
Finally and following Eq. (2), to calculate the values of the power-to-heat ratio parameter (σ) we have assumed a typical life steam temperature (Tls) of 580 °C and an isentropic efficiency (ηise) of 0.8 (Verbruggen, Klemes, and Rosen 2017).
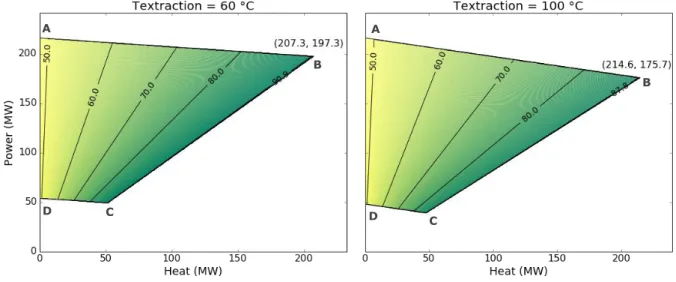
Fig 10 shows the feasible operation regions for the extraction/condensing turbine CHP units considered in our power system for two different extraction temperatures. It is shown that, when the temperature of extraction is set at 60 °C, values for β and σ are 0.09 and 0.95, while if the temperature of extraction increase to 100 °C, values are 0.18 and 0.82 respectively. Therefore, when the extraction temperature increases, the maximum heat that could be delivered increases, the electricity decreases, while the overall efficiency decreases.
Fig 10 Feasible operation regions for different extraction temperatures
A B C D A B C D
Table 3 CHP model parameters for different temperatures of extraction Temperature of extraction (°C) Condensing temperature (°C) Pmax (Q=0) (MW) Pmin (% of Pmax) β σ Qmax (MW) 60 30 216 40 0.09 0.95 207.3 80 30 216 40 0.14 0.88 210.8 100 30 216 40 0.19 0.82 214.6 120 30 216 40 0.23 0.76 218.7
3.4 Cost data
To produce indicators that allow the comparison amongst different scenarios (section 2.5), additional data input related to investments is needed. Since scenarios are built based on different combination of installed power capacity, unitary prices are required for additional renewable power capacity, conversion of COMC plants into CHP and cost of storage. It is assumed that the available capacity in the base case already exists. Therefore, only the additional RES power capacity replacing existing thermal capacity is considered in the investment cost indicators. For the same reason, the investment cost related to CHP only refers to the conversion of the existing COMC plants. Additionally, to calculate investments on annual basis, life of investment and interest rate are required (Table 4).
Table 4 Investment-related parameters (International Renewable Energy Agency 2016)
Parameter Units Value
Wind (CAPEX) M€/MW 2
Solar (CAPEX) M€ /MW 1
Steam turbine conversion
(CAPEX) M€/MWel 0.2
Thermal storage capacity
(CAPEX) €/kWh 3
Financial lifetime yr 20
4 Results
In this section, different scenarios are simulated to quantify the impact of incorporating CHP plants, which are converted from steam-turbine based plants, in the performance of the power system. Firstly, the base case scenario is compared with the integration of low and high CHP levels (13% and 26% of the total installed capacity). Then, the effects derived from the incorporation of thermal storage and from different extraction temperature are investigated. The discussion for the different comparisons includes the impacts of high RES scenarios and the effects of alternative heat supply prices. Finally, all the scenarios are jointly assessed to understand the interrelations between the different variables and to identify the optimal cases.
In the base case scenario, the total cost of the system ranges from 327 to 369 M€ on an annual basis. This range depends on the value of the price set for the AHS. The overall efficiency, not affected by the AHS cost, reaches a value of 44.3%. No RES curtailment is observed.
Based on the base case scenario, the introduction of different elements and the changes in the operational conditions modify the hourly dispatch of the system. Figs. 11 and 12 show the comparison of the power and heat dispatch for a week in winter on an hourly basis with high AHS prices and two different level of renewable penetration, low RES and high respectively. In Fig.13 hourly power and heat dispatch is presented for a summer week considering high alternative heat supply cost and low level of renewable penetration.
For the first case presented, the introduction of CHP plants in the system (Fig. 11.b) leads to the replacement of AHS by cogenerated heat, except for the peak hours in which small contribution from AHS is required. From the power dispatch perspective, the utilisation of CHP also increases, limiting the use of other thermal units. It is also observed that thermal storage (Fig. 11.c) contributes to increase the utilisation of the CHP plants from both power and heat perspective. In particular, the incorporation of thermal storage allows meeting the heat demand without any contribution from the alternative heat supply vector.
All these implications are further assessed in the coming sections including the analysis of global parameters such as total costs and global efficiencies.
(a)
(b)
(c)
Fig 11 Power and heating dispatch. High alternative heat supply price and low renewable penetration scenario. (a) No CHP, (b) High CHP, (c) High CHP and thermal storage. Week in
(a)
(b)
(c)
Fig 12 Power and heating dispatch. High alternative heat supply price and high renewable penetration scenario. (a) No CHP, (b) High CHP, (c) High CHP and thermal storage. Week in
(a)
(b)
(c)
Fig 13 Power and heating dispatch. High alternative heat supply price and low renewable penetration scenario. (a) No CHP, (b) High CHP, (c) High CHP and thermal storage. Week in July
4.1 The effect of centralised CHP deployment
The first effect of the conversion of COMC plants into CHP is the increase in the utilisation of these plants limiting the use of the conventional thermal units.
Derived from the high utilisation of these new converted plants, the overall efficiency of the system rises from 44.3% in the base case scenario up to 58.4% reached for high level of CHP combined with high AHS price (Fig. 14) As mentioned, this effect is explained by the high efficiency of CHP, up to 90% for some specific operation conditions. For all AHS scenarios, the overall efficiency increases but, a lower increase is noticed when the AHS cost is low because it prevents high CHP utilisation. The share of heat demand supplied by CHP is reduced for the low AHS scenario decreasing from 98% shown in the high AHS cost scenario to 88%. When AHS reaches the level of 10 €/MWh CHP plants turn less profitable, although still leading to higher overall efficiency as it operates driven by the electricity demand. It is also observed that the higher the AHS price, the higher the reduction of costs and the higher the overall efficiency of the system when increasing the share of CHP (Fig. 14). Overall, compared to the base case scenario, in all CHP scenarios a considerable overall efficiency increase is observed.
Fig 14 The effect of increase of CHP installed capacity for different Alternative Heat Supply prices.
4.2 The effect of thermal storage
Heat storage is of interest as it allows the combined benefit of high RES and CHP deployment by increasing the flexibility of the system and thereby facilitating the integration of both energy sources. The benefit derived from the incorporation of thermal storage becomes relevant when high RES electricity production has to be incorporated in the systems, instead of being curtailed. In the low RES scenario, the effect of thermal storage is limited because CHP can deliver electricity while meeting the required heating demand without competing with renewable energy.
In low RES scenarios and from the CHP operation perspective, thermal storage allows maximising the efficiency of the plant. As indicated in Fig 10, the efficiency of the CHP plants increases with the amount of heat released. Ideally, without any limitation, the CHP should operate on the D-C line of the feasible operation region (Fig. 5) in which efficiencies reach values of the order of 80%. However, the power and heating coupling forces the CHP to adjust power and heat delivery simultaneously and thus limits the efficiency. However, for a given power production requirement, the option of storing heat allows a higher heat production and therefore higher efficiencies. Fig. 15 shows how the
40%
50%
60%
0%
13%
26%
Ov
erall
efficien
cy
Share of CHP installed capacity
10
20
50
Cost of alternative heat supply (€/MWh
)300
320
340
360
380
400
0%
13%
26%
To
tal
sy
ste
m
co
sts
(M
€
)
flexibility provided by thermal storage allows moving operation points to the line of maximum efficiency. In addition to the efficiency increase and as a consequence of the flexibility provided by the thermal storage, the capacity factor of the CHP plants increases (Fig. 16).
Fig 15 Hourly CHP operation points for a week in winter. No storage (left) and 1 500 MWh (right)
Fig 16 Load duration curve of a CHP plant and capacity factor for scenarios with and without storage
On the other hand, in the high RES and high CHP scenarios, storage plays a key role leading to lower costs and higher efficiencies for high AHS prices. Under this scenario, the overall efficiency and cost are improved by 4 and 2% respectively. This outcome is due to the higher amount of RES that could be integrated in the system via a more flexible operation of the CHP. The assessment of curtailed RES reveals that thermal storage could increase the utilisation of RES by approximately 1% when high CHP installed capacity is assumed (Fig 17). This effect is subject to AHS prices that affects the utilisation of the heat supply from CHP. Hence, if low AHS prices are given, the system takes advantage of these low prices, limiting the use of heat from the CHP and the operation of the thermal storage and therefore RES are prioritised from the power supply perspective.
Fig 17 Effect of thermal storage on the overall efficiency for high RES scenarios and high AHS For the intermediate cases (low CHP with high RES or vice versa) storage improves the overall efficiency of the system and the economic impact remains limited.
To sum up, thermal storage becomes beneficial when high RES and high penetration of CHP are given under a scenario of high AHS prices. In these scenarios, thermal storage increases overall efficiency and reduces curtailed RES. If AHS prices are low and if the amount of RES is limited, its impact remains marginal.
4.3 The effect of the heat extraction temperature
As described in previous sections, the final use of the heating demand determines the extraction temperature in the CHP plants. This decision modifies the FOR and thus the optimal operation points within the FOR. The simulations indicate that high temperatures of extraction lead to lower overall efficiencies and slightly higher system costs (Fig. 18). The increase of the overall efficiency, driven by lower temperature of extraction, is higher when low-cost AHS is considered. This effect is explained by the fact that CHP can only compete with this low-cost AHS when its extraction temperature is low and therefore its efficiency is high. As shown in Fig 19, for low AHS costs, only the lowest temperature of extraction considered (60°C) leads to a share of heating supply higher than 50%. For this case, this share of heat supply is affected by the amount of RES capacity considered. If high AHS costs are assumed, the utilisation of heat from CHP is not affected by the temperature of extraction but by the amount of RES available in the system. 40% 50% 60% 70%
0%
13%
26%
Ov
er
all
ef
fic
ien
cy
Share of CHP installed capacity
No storage
Storage
0% 1% 2% 3% 0% 13% 26%RE
S
cu
rt
ailme
n
t
(%
o
f
to
tal
RE
S)
Fig 18 Effect of the temperature of extraction on the overall efficiency and cost of the system and in the amount of RES curtailed. High RES and high AHS cost scenarios.
0%
10%
20%
30%
40%
50%
60%
70%
80%
13%
26%
O
ver
all
ef
fic
ien
cy
(
%
)
Share of CHP
60
80
100
120
Temperature of extraction (°C)
200
220
240
260
280
300
320
340
360
380
400
13%
26%
Fin
al
co
st
(
EUR
millio
n
)
Share of CHP
0% 1% 2% 3%13%
26%
RE
S
cu
rt
ailme
n
t
(%
o
f
to
tal
RE
S
p
ro
d
u
ct
ion
)
Share of CHP
0% 10% 20% 30% 40% 50% 60% 70% 80% 90% 100%12% 20% 30% 40% 50%
Sh
ar
e
o
f
h
ea
tin
g
fr
o
m
CH
P
(%
)
Share of RES
AHS cost: 10 €/MWh
60
80
100
120
Temperature of extraction (°C)
12% 20% 30% 40% 50%
Share of RES
AHS cost: 20€/MWh
12% 20% 30% 40% 50%
Share of RES
AHS cost: 50€/MWh
Besides the effect on the share of heating provided by CHP depending on the temperature of extraction, in scenarios with high RES installed capacity and high AHS costs, reduced temperatures of extraction increase both the overall efficiency of the system but also the amount of RES curtailed. The effect on the total cost of the system is limited (Fig. 18).
It can be therefore concluded that, for low exergy heat requirements, heat produced by CHP could potentially compete with extremely low-cost thermal sources leading to higher efficiencies and lower costs. However it also impacts negatively the curtailment in the high RES case. This happens because the lower Temperature results to a more efficient and therefore cheaper operation of the plant which displaces renewable generation. Therefore, a trade-off exists between the overall efficiency and cost of the systems and the use of RES.
4.4 Power plant statistics
Once all the scenarios have been introduced, a summary of the steam turbine plants operation, both converted and not converted into CHP plants, is presented.
For those scenarios in which low penetration of renewables is considered, both units operated continuously for the whole year and therefore the number of hours committed is 8760.
When higher levels of renewables are considered, different levels of utilisation are observed depending on other parameters such as the cost of the alternative heat supply, the level of conversion of steam turbine plant into CHP and the availability of thermal storage (Fig. 20).
Fig 20 Indicators of operation for CHP plants. Number of start-ups (left) and number of commitments (right)
Regarding the number of start-ups, it is observed how the conversion of steam turbine plants into CHP plants increases the number of start-ups. This effect is derived from the global efficiency upgrade that the conversion implies. It is also noticed how the flexibility provided by the thermal storage increases the number of start-ups.
With regard to the number of commitments, in the scenarios the aggregated indicator for the two plants is above 16 000 hours per year. In all the cases, no significant differences are observed.
0 20 40 60 80 No Storage No Storage Storage No Storage Storage No Storage No Storage Storage No Storage Storage No CHP M ed iu m CH P H igh CH P No CHP M ed iu m CH P High CHP Low A H S H igh A H S High RES Number of start-ups CHP - Unit 1 CHP - Unit 2 0 10,000 20,000 No Storage No Storage Storage No Storage Storage No Storage No Storage Storage No Storage Storage No CHP M ed iu m CH P H igh CH P No CHP M ed iu m CH P H igh CH P Low A H S H igh A H S H igh RES Number of commitments
4.5 Optimum scenario selection
In this section, and given the implications amongst the different variables assessed, we present the Pareto optimal solutions for three different heat prices examined in order to understand the trade-off between affordability and efficiency. One of the first outcomes is that if CHP is not introduced in the system, overall efficiency is limited up to 50%. It is also observed that the system cost converges to a value around 320 M€ (Fig 21). As presented in previous sections, CHP plants with low temperatures of extraction (60 °C) could compete with low alternative heat supply prices, providing from 90 to 60% of the total heat demand depending on the penetration of RES (Fig 19). This explains the convergence of scenario in terms of cost. In other words, under specific operational conditions, CHP plants can lower the heat cost down to values close to those considered in the low-cost AHS scenarios.
Finally, the optimal scenario in terms of cost and overall efficiency results from the combination of high CHP penetration, operated at low temperature of extraction, available thermal storage and high level of RES (up to 50%).
Fig 21 Comparison of the complete set of scenarios assessed 250 270 290 310 330 350 370 390 35% 40% 45% 50% 55% 60% 65% 70% 75% To ta l Cos t (M E U R) Total Efficiency No CHP 50 EUR/MWh 20 EUR/MWh 10 EUR/MWh
5 Conclusions
A method to assess the benefit derived from the conversion of existing steam-based turbine plants into combined heat and power plant has been presented in this work. This method relies on a unit commitment model, which includes heating features, allowing the assessment of different assumptions such as energy prices, different share of installed capacities for a set of energy technologies and the operation of CHP plants. The capacity of the method to link the optimisation of the energy system with the temperature of heat delivered by the CHP plant is a valuable asset to evaluate different heat uses, such as the new 4th generation district heating systems characterised by low temperatures of operation, and the derived benefits.
The method has been tested in a small energy system, which offers opportunities to supply heat by the conversion of existing steam-based turbine plants into combined heat and power operation mode.
Results indicate that the conversion of the current power stations into combined heat and power plants leads to an increase of the overall efficiency of the energy system, which otherwise is limited to 50%. This effect relies on the higher efficiency of the CHP up to 90% for some operation points. However, the deployment of CHP may prevent the utilisation of renewable energy sources leading to renewable energy curtailment. The analysis presented demonstrates that this negative effect could be mitigated by the flexibility provided thermal storage. However, there exist a trade-off between the integration of high CHP and high RES simultaneously.
The analysis of different alternative heat cost reveals that CHP plants could compete with costs on the order of 10 €/MWh. However, for this low cost, the utilisation of the CHP decreases and so does the benefit offered by thermal storage options.
From the CHP operation perspective, low temperature of extraction leads to higher efficiencies and lower costs. Then, the lower the temperature required the best for the overall efficiency of the system, but increases the amount of RES curtailed by 1% when the temperature of extraction increases from 60 to 120 °C if high RES scenarios are considered.
The present study serves as a proof of concept for the new heating and cooling module of Dispa-SET. The next steps will consist in extending the analysis performed in this case study to more general situations. Larger geographic areas of the European power system would present opportunities to understand the flexibility options in systems with different heating demand curves, different RES-E penetration levels and different power generation fleets.
References
Alipour, Manijeh, Behnam Mohammadi-Ivatloo, and Kazem Zare. 2014. “Stochastic Risk-Constrained Short-Term Scheduling of Industrial Cogeneration Systems in the Presence of Demand Response Programs.” Applied Energy 136 (December): 393– 404. doi:10.1016/j.apenergy.2014.09.039.
Brown, Tom, David Schlachtberger, Alexander Kies, and Martin Greiner. 2016. “Sector Coupling in a Highly Renewable European Energy System.” In 15th Wind Integration Workshop. Vienna.
European Commission. 2016. “An EU Strategy on Heating and Cooling. COM(2016) 51 Final.” doi:10.1017/CBO9781107415324.004.
European Union. 2012. “Directive 2012/27/EU of the European Parliament and of the Council of 25 October 2012 on Energy Efficiency.”
Grohnheit, Poul Erik. 1993. “Modelling CHP within a National Power System.” Energy Policy 21 (4): 418–29. doi:10.1016/0301-4215(93)90282-K.
Haghrah, A., M. Nazari-Heris, and B. Mohammadi-ivatloo. 2016. “Solving Combined Heat and Power Economic Dispatch Problem Using Real Coded Genetic Algorithm with Improved Mühlenbein Mutation.” Applied Thermal Engineering 99 (April): 465–75. doi:10.1016/j.applthermaleng.2015.12.136.
International Energy Agency. 2014. “Linking Heat and Electricity Systems.” Paris.
International Renewable Energy Agency. 2016. The Power To Change : Solar and Wind Cost Reduction Potential To 2025.
Lowe, Robert. 2011. “Combined Heat and Power Considered as a Virtual Steam Cycle Heat Pump.” Energy Policy 39 (9). Elsevier: 5528–34. doi:10.1016/j.enpol.2011.05.007.
Lund, Henrik, Poul Alberg Østergaard, David Connolly, and Brian Vad Mathiesen. 2017. “Smart Energy and Smart Energy Systems.” Energy. Elsevier Ltd. doi:10.1016/j.energy.2017.05.123.
Lund, Henrik, Poul Alberg Østergaard, David Connolly, Iva Ridjan, Brian Vad Mathiesen, Frede Hvelplund, Jakob Zinck Thellufsen, and Peter Sorknæs. 2016. “Energy Storage and Smart Energy Systems.” International Journal of Sustainable Energy Planning and Management 11: 3–14. doi:10.5278/ijsepm.2016.11.2.
Lund, Henrik, Sven Werner, Robin Wiltshire, Svend Svendsen, Jan Eric Thorsen, Frede Hvelplund, and Brian Vad Mathiesen. 2014. “4th Generation District Heating (4GDH).” Energy 68 (April): 1–11. doi:10.1016/j.energy.2014.02.089.
Lund, Peter D., Juuso Lindgren, Jani Mikkola, and Jyri Salpakari. 2015. “Review of Energy System Flexibility Measures to Enable High Levels of Variable Renewable Electricity.” Renewable and Sustainable Energy Reviews 45 (May): 785–807. doi:10.1016/j.rser.2015.01.057.
Lythcke-Jørgensen, Christoffer Ernst, Marie Münster, Adriano Viana Ensinas, and Fredrik Haglind. 2016. “A Method for Aggregating External Operating Conditions in Multi-Generation System Optimization Models.” Applied Energy 166 (March): 59–75. doi:10.1016/j.apenergy.2015.12.050.
Mantzos, L., T. Wiesenthal, N.A. Matei, S. Tchung-Ming, and M. Rozsai. 2017. “JRC-IDEES : Integrated Database of the European Energy Sector.” Luxembourg. doi:10.2760/182725.
Mellal, Mohamed Arezki, and Edward J. Williams. 2015. “Cuckoo Optimization Algorithm with Penalty Function for Combined Heat and Power Economic Dispatch Problem.” Energy 93. Elsevier Ltd: 1711–18. doi:10.1016/j.energy.2015.10.006.
“Combined Heat and Power Economic Dispatch Problem Solution Using Particle Swarm Optimization with Time Varying Acceleration Coefficients.” Electric Power Systems Research 95. Elsevier B.V.: 9–18. doi:10.1016/j.epsr.2012.08.005.
Ommen, Torben, Wiebke Brix Markussen, and Brian Elmegaard. 2014. “Comparison of Linear, Mixed Integer and Non-Linear Programming Methods in Energy System Dispatch Modelling.” Energy 74 (1). Elsevier Ltd: 109–18. doi:10.1016/j.energy.2014.04.023.
Quoilin, Sylvain, Ignacio Hidalgo González, and Andreas Zucker. 2017. Modelling Future EU Power Systems Under High Shares of Renewables. The Dispa-SET 2.1 Open-Source Model. doi:10.2760/25400.
Sashirekha, A., J. Pasupuleti, N.H. Moin, and C.S. Tan. 2013. “Combined Heat and Power (CHP) Economic Dispatch Solved Using Lagrangian Relaxation with Surrogate Subgradient Multiplier Updates.” International Journal of Electrical Power & Energy Systems 44 (1): 421–30. doi:10.1016/j.ijepes.2012.07.038.
Sisternes, Fernando J De, Jesse D Jenkins, and Audun Botterud. 2016. “The Value of Energy Storage in Decarbonizing the Electricity Sector.” Applied Energy 175. Elsevier Ltd: 368–79. doi:10.1016/j.apenergy.2016.05.014.
Vada, Per Arne. 2014. “Modelling Combined Heat and Power Plants. Modelling CHP Plants on a System Level in the EMPS Power Market Model,” no. June. http://www.diva-portal.org/smash/get/diva2:743701/FULLTEXT01.pdf.
Verbruggen, A, J.J. Klemes, and Marc A Rosen. 2017. “Assessing Cogeneration Activity in Extraction – Condensing Steam Turbines : Dissolving the Issues by Applied Thermodynamics,” 1–6. doi:10.1115/1.4033424.
Werner, Sven. 2017. “International Review of District Heating and Cooling.” Energy. Elsevier Ltd, 1–15. doi:10.1016/j.energy.2017.04.045.
Ziebik, Andrzej, Damian Szegda, Bjorn Qvale, and Brian Elmegaard. 2010. “Thermodynamic Simulation Analysis of a Multifuel CHP Plant Basing on the Technological Diagram of Aved??re Unit 2.” Archives of Thermodynamics 31 (1): 79– 93. doi:10.2478/v10173-010-0005-x.
Zugno, Marco, Juan Miguel Morales, Henrik Madsen, and D T U Compute. 2015. “Robust Optimization for Unit Commitment and Dispatch in Energy Markets,” no. January.
List of abbreviations and definitions
AHS Alternative heat supply
C € Cost
CAPEX € Capital expenditure
CAPTech MW Installed capacity for a given technology CHP - Combined heat and power
COMC - Combined cycle
crf (-) Capital recovery factor
F MW Fuel consumption
FOR - Feasible operation region ICEN - Internal combustion engine
ITech € Unitary investment cost for a given technology n yr Lifetime of investment
OPEX €/yr Operational expenditure
Pmax MW Maximum power generation (Q = 0) Pmin MW Minimum power generation (Q = 0) RES - Renewable energy source
STUR - Steam turbine
Tcond °C Condensing temperature Text °C Extraction temperature Tls °C Live steam temperature
σ (-) Back-pressure ratio (Power-to-heat ratio per type of technology) β (-) Power-loss factor. Ratio between lost power generation and increased heating generation η (-) Efficiency of the power plant operated in a CHP mode (global efficiency) ηel (-) Efficiency of the power plants operated as single purpose power plant (electric efficiency) ηh (-) Efficiency of conventional boiler
ηise (-) Isentropic efficiency
Subscript
f fuel
i Power plant unit
st Storage
l losses
t Time step simulation
in Input energy flow
List of figures
Fig 1 a) Final energy consumption per sector and end-use, b) Shares of final energy
consumption per end-uses and Member States ... 3
Fig 2 Share of installed net generation capacity per year and Member State according to the EU reference scenario 2016. The dotted line separates the real historical data with the projected values Data source: (European Commission 2016b) ... 4
Fig 3 Integrated energy system for the coverage of specific power and heat demand. Conceptual model layout. The dotted box includes the new model features implemented for this study ... 7
Fig 4 Feasible operation region. Steam plant with backpressure turbine ... 8
Fig 5 Feasible operation region for a CHP plant. ... 9
Fig 6 Steam cycle scheme. No extraction (left) and extraction (right) operations ... 10
Fig 7 Feasible operation region for a CHP plant coupled with resistance heater or heat pump. ... 11
Fig 8 Energy generation mix for the base case (a), high RES and no CHP (b), low RES and high CHP (c) and high RES and high CHP (d) scenarios ... 13
Fig 9 Electricity and heat demand set for the base case scenario. Monthly demand (left) and hourly demand for a typical winter day (right) ... 14
Fig 10 Feasible operation regions for different extraction temperatures ... 15
Fig 11 Power and heating dispatch. High alternative heat supply price and low renewable penetration scenario. (a) No CHP, (b) High CHP, (c) High CHP and thermal storage. Week in January ... 18
Fig 12 Power and heating dispatch. High alternative heat supply price and high renewable penetration scenario. (a) No CHP, (b) High CHP, (c) High CHP and thermal storage. Week in January ... 19
Fig 13 Power and heating dispatch. High alternative heat supply price and low renewable penetration scenario. (a) No CHP, (b) High CHP, (c) High CHP and thermal storage. Week in July ... 20
Fig 14 The effect of increase of CHP installed capacity for different Alternative Heat Supply prices. ... 21
Fig 15 Hourly CHP operation points for a week in winter. No storage (left) and 1 500 MWh (right) ... 22
Fig 16 Load duration curve of a CHP plant and capacity factor for scenarios with and without storage ... 22
Fig 17 Effect of thermal storage on the overall efficiency for high RES scenarios and high AHS ... 23
Fig 18 Effect of the temperature of extraction on the overall efficiency and cost of the system and in the amount of RES curtailed. High RES and high AHS cost scenarios. .... 24
Fig 19 Share of heat demand covered by CHP power plant for different temperatures of extraction, alternative heat supply prices and share of RES installed capacities. ... 24
Fig 20 Indicators of operation for CHP plants. Number of start-ups (left) and number of commitments (right) ... 25
Fig 21 Comparison of the complete set of scenarios assessed... 26
Fig 22 Effect of temperature of extraction on the value of σ and β parameters for Tls = 580 °C, Tcond = 30 °C and ηise = 0.8 ... 35
List of tables
Table 1 CHP plant model parameters ... 8 Table 2 Variation range of the model parameters ...15 Table 3 CHP model parameters for different temperatures of extraction ...16 Table 4 Investment-related parameters (International Renewable Energy Agency 2016)
...16
Annexes
Annex A. A literature review on simplified CHP 5-parameter models
In this section, a collection of typical values for the parameters that characterise CHP power plants following the 5-parameter model approach is presented. Even though for some of the references included in the collection, CHP plants are defined based on other features, they allow calculating the 5 parameters proposed in our model (β, σ, Pmax, Pmin and Qmax).
Table 5 List of typical values of parameters to characterise simplified CHP models Pmax
(Q=0) Pmin (%) β σ Qmax Qmin Ref
247 0.4 0.177 1.78 180 (Mellal and Williams 2015) 60 0.33 0.272 2.33 55 (Mellal and Williams 2015) 125.8 0.35 0.115 0.86 135.6 (Mellal and Williams 2015)
250 0.42 0.106 1 332.9 (Lythcke-Jørgensen et al. 2016) 247 0.4 0.177 1.78 180 (Sashirekha et al. 2013) 125.8 0.35 0.115 0.86 135.6 (Sashirekha et al. 2013) 125.8 0.35 0.115 1.158 135.6 (Haghrah, Nazari-Heris, and Mohammadi-ivatloo 2016)
247 0.4 0.177 1.78 180 (Haghrah, Nazari-Heris, and Mohammadi-ivatloo 2016)
12.58 0.35 0.115 1.158 13.56 (Alipour, Mohammadi-Ivatloo, and Zare 2014) 24.7 0.4 0.177 1.78 18 (Alipour, Mohammadi-Ivatloo, and Zare 2014)
250 0.140 0.65 330 (Vada 2014) 425 0.165 1.55 90 (Vada 2014) 575 0.139 0.73 485 (Vada 2014) 0.27 250 (Vada 2014) 0.75 330 (Vada 2014) 0.6 244 (Vada 2014) 1 78 (Vada 2014) 1 60 (Vada 2014) 1.33 31 (Vada 2014) 0.12 0.68 (Vada 2014) 0.13 0.75 (Vada 2014) 0.18 1 (Vada 2014) 0.1 0.58 (Vada 2014) 0.05 0.27 (Vada 2014) 0.13 0.73 (Vada 2014) 263 0.2 0.15 0.64 331 0 (Zugno et al. 2015) 215 0.14 0.15 0.28 500 70 (Zugno et al. 2015)
To complement the information in the annex, Fig. 17 shows the dependency of the σ and β parameters with the temperature of extraction under the operational conditions assumed in the case study.
Fig 22 Effect of temperature of extraction on the value of σ and β parameters for Tls = 580 °C, Tcond = 30 °C and ηise = 0.8
0.00 0.10 0.20 0.30 0.40 0.50 0.60 0.70 0.80 0.90 1.00 60 80 100 120 Temperature of extraction ( C) β σ
GETTING IN TOUCH WITH THE EU In person
All over the European Union there are hundreds of Europe Direct information centres. You can find the address of the centre nearest you at: http://europea.eu/contact
On the phone or by email
Europe Direct is a service that answers your questions about the European Union. You can contact this service:
- by freephone: 00 800 6 7 8 9 10 11 (certain operators may charge for these calls), - at the following standard number: +32 22999696, or
- by electronic mail via: http://europa.eu/contact FINDING INFORMATION ABOUT THE EU Online
Information about the European Union in all the official languages of the EU is available on the Europa website at: http://europa.eu
EU publications
You can download or order free and priced EU publications from EU Bookshop at:
http://bookshop.europa.eu. Multiple copies of free publications may be obtained by contacting Europe Direct or your local information centre (see http://europa.eu/contact).
KJ
-NA
-29082
-EN