0066-4804/09/$08.00
⫹0 doi:10.1128/AAC.00329-09
Combination Therapy in Treatment of Experimental Pulmonary Aspergillosis:
In Vitro and In Vivo Correlations of the Concentration- and
Dose-Dependent Interactions between Anidulafungin and Voriconazole
by Bliss Independence Drug Interaction Analysis
䌤
Vidmantas Petraitis,
1,2Ruta Petraitiene,
1,2William W. Hope,
1Joseph Meletiadis,
1Diana Mickiene,
1,2Johanna E. Hughes,
1Margaret P. Cotton,
1Theodouli Stergiopoulou,
1Miki Kasai,
1Andrea Francesconi,
1Robert L. Schaufele,
1Tin Sein,
1,2Nilo A. Avila,
4John Bacher,
3and Thomas J. Walsh
1*
Immunocompromised Host Section, Pediatric Oncology Branch, National Cancer Institute, Bethesda, Maryland
1;
Laboratory Animal Sciences Program, SAIC-Frederick, Inc., Frederick, Maryland
2; Surgery Service,
Veterinary Resources Program, Office of Research Services, National Institutes of Health,
Bethesda, Maryland
3; and Department of Radiology, Warren Grant Magnuson Clinical Center,
National Institutes of Health, Bethesda, Maryland
4Received 10 March 2009/Accepted 13 March 2009
We studied the antifungal activity of anidulafungin (AFG) in combination with voriconazole (VRC) against
experimental invasive pulmonary aspergillosis (IPA) in persistently neutropenic rabbits and further explored
the in vitro and in vivo correlations by using Bliss independence drug interaction analysis. Treatment groups
consisted of those receiving AFG at 5 (AFG5 group) and 10 (AFG10 group) mg/kg of body weight/day, VRC at
10 mg/kg every 8 h (VRC group), AFG5 plus VRC (AFG5
ⴙVRC group), and AFG10 plus VRC (AFG10ⴙVRC
group) and untreated controls. Survival throughout the study was 60% for the AFG5
ⴙVRC group, 50% for the
VRC group, 27% for the AFG10
ⴙVRC group, 22% for the AFG5 group, 18% for the AFG10 group, and 0% for
control rabbits (P < 0.001). There was a significant reduction of organism-mediated pulmonary injury,
measured by infarct scores, lung weights, residual fungal burdens, and galactomannan indexes, in
AFG5
ⴙVRC-treated rabbits versus those treated with AFG5 and VRC alone (P < 0.05). In comparison,
AFG10
ⴙVRC significantly lowered only infarct scores and lung weights in comparison to those of
AFG10-treated animals (P < 0.05). AFG10
ⴙVRC showed no significant difference in other outcome variables.
Sig-nificant Bliss synergy was found in vivo between AFG5 and VRC, with observed effects being 24 to 30% higher
than expected levels if the drugs were acting independently. These synergistic interactions were also found
between AFG and VRC in vitro. However, for AFG10
ⴙVRC, only independence and antagonism were observed
among the outcome variables. We concluded that the combination of AFG with VRC in treatment of
experi-mental IPA in persistently neutropenic rabbits was independent to synergistic at a dosage of 5 mg/kg/day but
independent to antagonistic at 10 mg/kg/day, as assessed by Bliss independence analysis, suggesting that
higher dosages of an echinocandin may be deleterious to the combination.
Invasive pulmonary aspergillosis is an important cause of
morbidity and mortality in patients with cancer, hematopoietic
stem cell transplantation, solid organ transplantation, and
other immunodeficiencies (1, 4, 8, 13, 21, 36). Despite the use
of single agents, such as amphotericin B, its lipid formulations,
antifungal triazoles, and echinocandins, mortality associated
with invasive pulmonary aspergillosis remains high (22, 32).
Combination therapy with the echinocandins and triazoles may
be more active against invasive aspergillosis than therapy with
a single agent alone (10, 26). The echinocandins are a class of
semisynthetic lipopeptide antifungal compounds that inhibit
synthesis of (133)-
-
D-glucan, a key component of the cell
walls of most pathogenic fungi (6, 14).
The antifungal triazoles inhibit fungal cell membrane
bio-synthesis through inhibition of ergosterol formation at the
level of lanosterol C
14-demethylase (9, 17, 28, 29). Analysis of
pharmacodynamic interactions poses a challenge to assessing
the efficacy of combination therapy and its superiority over
monotherapy. Robust mathematical pharmacodynamic models
are powerful tools for the detection of synergistic and
antag-onistic interactions and for correlating in vivo data with in vitro
data. Bliss independence drug interaction analysis, which is
based on the probability theory for independent events, was
previously used to correlate in vitro and in vivo data on the
antagonistic combination of ravuconazole with amphotericin B
against invasive aspergillosis (16).
We hypothesized that the simultaneous inhibition of the
biosynthesis of key components of the fungal cell wall and cell
membrane by the combination of an echinocandin and an
antifungal triazole may result in a synergistic interaction in
vitro and in vivo. We further hypothesized that Bliss
indepen-dence analysis of this possible in vitro and in vivo interaction
may provide a useful tool by which to assess probable
syner-* Corresponding author. Mailing address: Immunocompromised
Host Section, Pediatric Oncology Branch, National Cancer Institute,
Building 10, Rm. 1W-5750, 10 Center Drive, Bethesda, MD 20892.
Phone: (301) 402-0023. Fax: (301) 480-2308. E-mail: walsht@mail.nih
.gov.
䌤
Published ahead of print on 23 March 2009.
2382
on July 13, 2020 at UNIV DE LIEGE
http://aac.asm.org/
gistic antifungal effects. We therefore examined the potential
therapeutic utility of the combination of anidulafungin and
voriconazole in the treatment of experimental invasive
pulmo-nary aspergillosis in persistently neutropenic rabbits and
stud-ied the in vitro and in vivo correlations of this interaction by
Bliss independence drug interaction analysis.
MATERIALS AND METHODS
Isolate.NIH Aspergillus fumigatus isolate 4215 (ATCC MYA-1163), obtained from a patient with a fatal case of pulmonary aspergillosis, as previously de-scribed (26), was used in the experiments. The MIC of voriconazole (Pfizer Ireland Pharmaceuticals, Ringaskiddy, Ireland) and the minimum effective con-centration of anidulafungin (Eraxis; Pfizer Inc., New York, NY) against A.
fumigatus, determined according to CLSI standard M38-A microdilution
meth-ods (18), were 0.5 to 1g/ml and 0.25 g/ml, respectively.
In vitro combination studies.The combination of anidulafungin and voricon-azole was tested against A. fumigatus in triplicate with an in vitro broth microdi-lution checkerboard assay in 96-well flat-bottomed microtitration plates (Corn-ing Incorporated, Corn(Corn-ing, NY), based on the CLSI M-38A method (18). Twofold serial dilutions of anidulafungin and voriconazole were prepared in 50 l of RPMI 1640 buffered at pH 7.0 with 0.165 M MOPS (morpholinepropane-sulfonic acid) at concentrations of four times the final concentrations, which ranged from 1 to 0.015 mg/liter and 0.25 to 0.0005 mg/liter for anidulafungin and
voriconazole, respectively. After inoculation with 100l of 4 ⫻ 104
CFU/ml prepared from 5- to 7-day-old cultures on potato dextrose agar, microtiter plates were incubated (Steri-Cult 200 incubator; DoveBid Inc., CA) at 35°C for 48 h. Growth in each well was quantified spectrophotometrically at 405 nm (optical
density at 405 nm [OD405]), using 16 scan points per well, in a spectrophotometer
(Elx808; Bio-Tek Instruments, Winooski, VT). The percentage of growth
inhi-bition in each well was calculated based on the following equation: 100%⫺
(OD405of a well⫺ background OD405)/(OD405of the drug-free well⫺
back-ground OD405of the drug-free well)⫻ 100% (equation 1). Background OD405s
were measured from a plate inoculated with a conidium-free inoculum and handled in the same way as the inoculated plates with the conidium-containing inocula.
In order to describe the concentration-effect relationships of anidulafungin
and voriconazole alone, a sigmoid Emax model was fitted to the % growth
inhibition obtained at each concentration of the drugs alone for each replicate.
The Emax model was described by the following equation: E⫽ Emax⫻ Dm/
(EC50
m⫹ Dm
) (equation 2), where E is the percentage of growth (dependent
variable) at the drug concentration D (independent variable) and Emaxis the
maximum percentage of growth observed in the drug-free control. The EC50and
m were estimated with the Emaxmodel regression analysis. EC50is the drug
concentration producing 50% of the Emax, and m is the slope of the
concentra-tion-effect curve (Hill constant). The interaction was assessed with the Bliss independence response surface analysis.
Pharmacodynamic Bliss independence-based drug interaction analysis.Bliss
independence is described by the equation EIND⫽ EA ⫹ EB⫺ EA⫻ EB
(equation 3) for a certain combination of x mg/liter of drug A and y mg/liter of
drug B. EAis the % fungal growth inhibition at x mg/liter of drug A alone, EBis
the % fungal growth inhibition at y mg/liter of drug B alone, and EINDis the
expected % fungal growth inhibition of a noninteractive (independent) theoret-ical combination of x mg/liter of drug A with y mg/liter of drug B. The difference
(⌬E ⫽ EOBS⫺ EIND) between the expected % growth inhibition, EIND, and the
experimentally observed % growth inhibition, EOBS, describes the interaction of
each combination of the concentrations of the two drugs. If⌬E and its 95%
confidence interval (CI) were⬎0 (i.e., EOBS⬎ EIND, and hence, more growth
inhibition was observed than if the two drugs were acting independently), Bliss
synergy was concluded for that particular combination. If⌬E and its 95% CI
were⬍0 (i.e., EOBS⬍ EIND, and hence, less growth inhibition was observed than
if the two drugs were acting independently), Bliss antagonism was concluded for
that particular combination. In any other case where the 95% CI of⌬E would
include 0, the conclusion was Bliss independence.
In each of the independent replicate experiments, % growth inhibition of
anidulafungin (EAFG) and voriconazole (EVRC) alone was obtained using the
Emaxmodel parameters. Thus, theoretical % growth of an independent
combi-nation, EIND, was calculated based on the following equation, where EAFGand
EVRCwere obtained from the Emaxmodel. Thus, EIND⫽ EAFG⫻ EVRC⫽
Emax,AFG⫻ DAFGmAFG/(EC50,AFGmAFG⫹ DAFGmAFG)⫻ Emax,VRC⫻ DmVRC/
(EC50,VRCmVRC⫹ DVRCmVRC) (equation 4), where the subscript in each
param-eter indicates the Emaxparameter described above for the concentration-effect
curves of anidulafungin and voriconazole alone. For each combination of x
mg/liter of voriconazole with y mg/liter of anidulafungin, the⌬E (EOBS⫺ EIND)
was calculated and the interaction was assessed as described above. When the
statistically significantly different from zero⌬Es of all combinations (7 ⫻ 10)
were plotted in a three-dimensional plot, an interaction surface plot was ob-tained, with peaks above and below the 0 plane indicating synergistic and an-tagonistic combinations, respectively, while the 0 plane itself indicated no statis-tically significant interactions. As summary measures of the interaction surface, the sum and the mean of all statistically significant synergistic (⌬E ⫾ 95% CI ⬎
0) and antagonistic (⌬E ⫾ 95% CI ⬍ 0) combinations were reported.
Animals and inoculation.Healthy female New Zealand White rabbits (Co-vance Research Products, Inc., Denver, PA) weighing 2.6 to 3.5 kg at the time of endotracheal inoculation were used in experiments. A total of 70 rabbits were used in four replicate experiments. All experimental groups were studied simul-taneously. There were no significant differences between experiments, and the findings were consistently replicated. All rabbits were monitored under humane care and use standards in facilities accredited by the Association for Assessment and Accreditation of Laboratory Animal Care International, according to the guidelines for the care and use of laboratory animals of the National Research Council (19) and under the approval of the Animal Care and Use Committee of the National Cancer Institute. Rabbits were individually housed and maintained with water and standard rabbit feed ad libitum. Vascular access was established by the surgical placement of a Silastic tunneled central venous catheter as previously described.
For each experiment, an inoculum of 1⫻ 108
to 1.25⫻ 108
conidia of A.
fumigatus in a volume of 250l to 350 l was prepared. Endotracheal inoculation was performed on day 2 of the experiments, with rabbits under general anesthe-sia, as described previously (26).
Immunosuppression and maintenance of neutropenia. Immunosuppression
and profound and persistent neutropenia (a neutrophil concentration of⬍100
neutrophils/l) were established and maintained using cytarabine (Cytosar-U; Pharmacia-Upjohn, Kalamazoo, MI) and methylprednisolone (Solu-Medrol; Pfizer for Pharmacia & Upjohn Corp., New York, NY) as described previously (26). Antibiotics (ceftazidime, gentamicin, and vancomycin) were used for pre-vention of opportunistic bacterial infections during neutropenia (26).
Antifungal compounds and treatment regimens. Rabbits were grouped to
receive anidulafungin at 5 (AFG5 group) (n⫽ 9) and 10 (AFG10 group) (n ⫽
11) mg/kg of body weight/day intravenously (i.v.), voriconazole at 10 mg/kg every
8 h (q8h) i.v. (VRC group) (n⫽ 12), a combination of AFG5 with VRC
(AFG5⫹VRC group) (n ⫽ 10) or AFG10 with VRC (AFG10⫹VRC group)
(n⫽ 11) for treatment of established invasive pulmonary aspergillosis, or no drug
(control group) (n⫽ 17). Anidulafungin was provided as a pharmaceutical-grade
powder (50 mg/vial) and was reconstituted with sterile normal saline to achieve a 1-mg/ml concentration. Voriconazole (200 mg/vial) was reconstituted from pharmaceutical-grade powder with sterile water to achieve a final concentration of 10 mg/ml.
Outcome variables.The following panel of outcome variables was used to assess antifungal efficacy: survival, pulmonary infarct score, lung weight, residual fungal burden (log CFU/g), pulmonary infiltrate volume, serum galactomannan index (GMI), bronchoalveolar lavage (BAL) fluid galactomannan level, and BAL fluid DNA level. The outcome variable panel was applied to all experimental rabbits when possible.
Survival.The survival time in days postinoculation was recorded for each rabbit in each group. Following humane end points, rabbits were euthanized by i.v. administration of pentobarbital (65 mg of pentobarbital sodium/kg of body weight) (Beuthanasia-D Special [euthanasia solution]; Schering-Plough Animal Health Corp., Union, NJ) on day 13 postinoculation, 24 h after the last dose of study drug (37).
Pulmonary lesion scores, lung weights, and residual fungal burden.The lungs were carefully resected at autopsy. Pulmonary lesion scores and lung weights were assessed and calculated as previously described (26). Lung tissue from each rabbit was sampled and cultured by a standard excision of tissue from each lobe as previously described (26). The number of CFU of A. fumigatus was counted and recorded for each lobe, and the CFU/g was calculated.
Multidimensional volumetric imaging by computerized tomography. Comput-erized tomography was performed to measure the response of pulmonary infil-trates to antifungal therapy (38). A semiautomatic method was then used to measure the volume of lung lesions, as previously described (27).
BAL.BAL was performed on each lung preparation, as described previously
(25), by the instillation of 10 ml of sterile normal saline into the clamped trachea with a sterile 12-ml syringe and subsequent withdrawal. The instillation was
repeated twice. The lavage fluid was then centrifuged for 10 min at 400⫻ g. Part
of the supernatant was discarded, leaving the pellet and 2 ml of supernatant,
on July 13, 2020 at UNIV DE LIEGE
http://aac.asm.org/
which was then vortexed. A 0.1-ml sample of this fluid and 0.1 ml of a dilution
(101
) of this fluid were cultured on 5% Sabouraud glucose agar plates.
Galactomannan assay.Blood from each rabbit infected with A. fumigatus was collected every other day for determination of serum galactomannan concentra-tions. Serum and BAL fluid galactomannan concentrations were determined by the Platelia Aspergillus EIA (Bio-Rad, Marnes la Coquette, France) one-stage immunoenzymatic sandwich microplate assay method (33). Enzyme immunoas-say data were expressed as the serum GMI plotted over time. The GMI for each test serum sample was equal to the absorbance of a standard sample divided by the absorbance of a threshold serum provided by the manufacturer.
DNA extraction from BAL fluid.Frozen BAL fluid samples were thawed before extraction was performed. As previously described (20), samples were
vortexed for 1 min before a 500-l aliquot was taken for processing. Following
centrifugation for 10 min at 16,000⫻ g, the supernatant was discarded, and the
pellet was gently resuspended in 100l spheroplast buffer (1.0 M sorbitol, 50.0
mM sodium phosphate monobasic, 0.1% 2-mercaptoethanol, 10 mg of
lyti-case/ml [Sigma]) and 10l of lysing enzymes and incubated at 37°C on a rocking
platform for 60 min. After centrifugation for 20 min at 400⫻ g, the
spheroplast-BAL fluid pellet was resuspended in 400l AP1 buffer (DNeasy plant kit;
Qiagen, Valencia, CA). The sample was added to lysing matrix D tubes (Fast-prep sample (Fast-preparation system; QBIOgene/MP Biomedical, Irvine, CA) and processed using a FastPrep instrument (QBIOgene/MP Biomedical). Specimens
were centrifuged at 16,000⫻ g for 30 to 60 s and then gently vortexed. An aliquot
of 300l of the specimen was transferred to a 1.5-ml tube and adjusted to a
volume of 400l with AP1 buffer. An aliquot of 4 l of RNase A (100 mg/ml)
was added, vortexed vigorously, and incubated for 10 min at 65°C in an Eppen-dorf thermomixer (EppenEppen-dorf, Westbury, NY) at 1,200 rpm. The DNeasy plant
kit protocol was followed, with the following modification: after the 200l of
preheated (65°C) AE buffer (Qiagen, Valencia, CA) was applied to the column, the entire apparatus (column and collection tube) was heated at 65°C in an
Eppendorf thermomixer for 5 min. An aliquot of 100l of sterile water was also
processed as described above as a control for any contamination from the DNA extraction kit components.
A real-time quantitative PCR assay targeting the ITS1, 5.8S, and ITS2 regions of the rRNA gene complex was designed. The primers and probes were designed using Oligo software (Molecular Biology Insights, Cascade, CO). Probes were purchased from Idaho Technologies (Salt Lake City, UT). The primers and probes were designed based on a multiple sequence alignment of rRNA se-quences from GenBank, utilizing the Sequencher software package (Gene Codes Corp., Ann Arbor, MI). The NCBI BLAST database search program was used to determine the uniqueness of the primers and probes for A. fumigatus. The amplicon generated was 253 bp long.
The PCR master mix consisted of 0.5M of each of the primers, 5 mM MgCl2,
0.025% bovine serum albumin (Sigma-Aldrich Corp., St. Louis, MO), 0.05 U/ml
Platinum Taq DNA polymerase (Invitrogen Corp., Carlsbad, CA), 10⫻ PCR
buffer (Invitrogen Corp., Carlsbad, CA), 0.2 mM PCR Nucleotide Mix Plus (dATP, dCTP, and dGTP at 10 mM each and dUTP at 30 mM; Roche Molecular
Biochemicals, Indianapolis, IN), and 0.1M each of the fluorescein and LC
Red-640 probes. In addition, HK-UNG thermostable uracil N-glycosylase (Epi-centre, Madison, WI) was utilized as recommended by the manufacturer to prevent potential amplicon carryover. Each reaction mix contained an aliquot of
5l of extracted specimen, together with 15 l of the master mix. The cycling
conditions were as follows: uracil activation (37°C, 180 s), uracil heat inactivation (95°C, 60 s for 1 cycle), and denaturation (95°C, 0 s), annealing (58°C, 5 s), and extension (72°C, 15 s) for 50 cycles. Quantitation standards were performed in conjunction with each set of samples. The BAL fluid samples from each rabbit were screened with the following controls: (i) DNA extracted from normal BAL fluid and (ii) a negative control master mix (sterile water). Tenfold serial dilu-tions of genomic DNA extracted from A. fumigatus isolate 4215 were used as external quantitation standards for all quantitative PCRs.
In order to confirm the lack of PCR inhibitors in BAL fluid samples, a separate set of PCR/fluorescent resonance energy transfer reactions were performed which specifically did not target A. fumigatus (or mammalian) DNA. The primers and probes were designed to target the common plasmid cloning vector pBR322. The PCR master mix included a specific amount of target DNA (pBR322). The presence of inhibitors was tested by comparing the amplification efficiency of this reaction with the extracted samples against those performed with sterile water. Equivalent amplification efficiencies compared to reactions performed with wa-ter reflected the lack of inhibitors. Each lung and BAL fluid sample was tested for inhibitors as described above.
In vivo combination studies.For the purpose of this analysis, the in vivo effects of percentage of fungal growth inhibition, E, were calculated by the following
equation: 100%⫺ MVtreated/MVcontrol, where MVtreatedand MVcontrolwere the
measured variables for residual fungal burden (CFU/g), the number of pulmo-nary infarct lesions, the lung weight (g), serum GMI, BAL fluid GMI, BAL fluid DNA, and pulmonary infiltrate volume (computed tomography [CT] scan) for treated and untreated animals, respectively.
The expected effect EINDof a noninteractive (independent) theoretical
com-bination of the voriconazole dosage with either dosage of anidulafungin was
calculated with equation 1, where EA⫽ EAFGwas the effect of anidulafungin
acting alone at a dosage of either 5 or 10 mg/kg (AFG5 or AFG10 group) and
EB⫽ EVRCwas the effect of voriconazole acting alone at the dosage of 10 mg/kg
(VRC group). The difference,⌬E, between the EINDand the experimentally
observed effect EOBS for the combination groups AFG5⫹VRC and
AFG10⫹VRC and Bliss interaction were assessed as described above.
Pharmacokinetic studies.The plasma pharmacokinetics of voriconazole and anidulafungin were studied in five to eight infected animals per dosage cohort. Time points for sampling were determined by inspection of full plasma concen-tration profiles obtained for healthy rabbits following adminisconcen-tration of similar dosages based upon previous plasma pharmacokinetic studies of anidulafungin (7) and voriconazole. Plasma sampling was performed on day 6 of antifungal therapy. Blood samples were drawn immediately postdosing and then at 0.25, 0.5, 1, 4, 8, and 24 h postdosing. Plasma was immediately separated by centrifugation
and stored at⫺70°C until assayed.
Concentrations of anidulafungin were determined by employing a method developed at Lilly Research Laboratories (Indianapolis, IN) and then adapted, optimized, and validated in our laboratory, as described previously, by reversed-phased high-pressure liquid chromatography (7). Micafungin was used as an
internal standard (IS) (50g/ml at 271 nm). Anidulafungin was extracted from
heparinized plasma by solid-phase extraction (5). Quantification was based on the ratio of the peak areas of anidulafungin and IS. The coefficient of
determi-nation, r2
, wasⱖ0.996, and the lower limit of quantification was 0.075 mg/liter.
The intra- and interday coefficients of variation were⬍14%.
The assay for voriconazole extraction developed by Pennick and colleagues (23) was adapted and optimized in our laboratory. Concentrations of voricon-azole were determined using high-performance liquid chromatography (Waters 2996 separation module, Alliance system, and photodiode array detector model 2996; Waters Inc., Milford, MA). The mobile phase consisted of acetonitrile–
N,N,N⬘,N⬘-tetramethylethylenediamine (TEMED) phosphate buffer
(Sigma-Al-drich, St. Louis, MO) (1.5 ml/liter, pH 7.4, adjusted with phosphoric acid; 55:45 [vol/vol]), delivered at 0.8 ml/min. Samples were maintained in the autosampler
at 4°C in glass vials with 150-l inserts. The injection volume was 75 l.
Flucon-azole (100g/ml) was used as an IS. UV light absorbance for voriconazole was
at 256.1 nm, and for fluconazole the wavelength was 262 nm. The retention time was 6.7 and 3.5 min, respectively, maintaining the analytical column at room temperature.
Prior to extraction, all plasma samples (500l) were spiked with 10 l of IS,
vortexed with 1 ml of borate buffer (BO3) (20 mM, pH 9) (Mallinckrodt Baker,
Inc., Paris, KY) for 5 s, and incubated at room temperature for 15 min. Solid-phase extraction was performed on a RapidTrace (Caliper Life Science)
work-station, using Varian Inc. Bond Elut C18100-mg, 1-ml cartridges. Extraction was
performed in the following order. Cartridges were conditioned with 1 ml of
methanol followed by 1 ml of sterile water and 1 ml of BO3buffer (0.2 M, pH 9).
After the buffer was drained, samples, quality controls, or standards were applied onto cartridges at a speed of 1 ml/min, pushed by 5 ml of air at 42 ml/min.
Cartridges were washed with 1 ml of BO3buffer and 1 ml water-methanol (70/30)
solution at 5 ml/min and dried under a current of air for 2 min. Voriconazole was eluted with 1 ml of ethyl alcohol (USP 200 proof; The Warner-Graham Co., Cockeysville, MD) containing 1% glacial acetic acid, placed in Fisher disposable culture tubes, and evaporated under a steady stream of air at 40°C in a Turbo-Vap LV evaporator (Zymark, Hopkinton, MA) for 45 min or until dry. The
samples were reconstituted in 90l of mobile phase, transferred to vials, and
injected onto a Waters SunFire C185m, 4.6- by 250-mm analytical column
protected by a guard column (SunFire 5m C18[20⫻ 4.5] column).
Standards and quality control samples were prepared by adding known amounts of voriconazole to normal rabbit plasma. A stock solution (10 mg/ml) was prepared by reconstituting voriconazole pharmaceutical-grade powder with 19 ml of sterile water, followed by a set of 10-fold dilutions in methanol in a range
from 50 ng/ml to 50g/ml.
Quantification was based on the ratio of peak heights of voriconazole and the IS. Nine-point (0 to 2.5 ng/ml) and seven-point (0.75 to 50.000 ng/ml) standard
nonweighted curves were linear, with r2values ofⱖ0.9975 and ⱖ0.999,
respec-tively.
Pharmacokinetic data analysis.Pharmacokinetic parameters for anidulafun-gin and voriconazole were determined by population methodology, using the program nonparametric adaptive grid (NPAG) with adaptive gamma (14). A
on July 13, 2020 at UNIV DE LIEGE
http://aac.asm.org/
standard two-compartment pharmacokinetic model was used, with zero-order time-delimited input and first-order elimination from the central compartment. The entire data set (combination and monotherapy) was comodeled. The phar-macokinetic data were weighted by the inverse of the estimated assay variance for each drug. The fit of the model to the data was assessed using the log likelihood value and a visual inspection and coefficient of determination of the observed-versus-predicted values after the Bayesian step. The population mean and median parameter values were evaluated within the maximum a posteriori Bayesian analysis. The estimates of the pharmacokinetic parameters for each individual rabbit were obtained using the “population-of-one” utility within NPAG. The Bayesian estimates for each rabbit within the various treatment groups were collated. The AUC which developed in each rabbit at steady state was determined by integration.
Toxicity studies.Blood was collected as previously described (26). Chemical determinations of creatinine, urea nitrogen, alanine aminotransferase (ALT), aspartate aminotransferase (AST), and potassium concentrations in serum were performed on the penultimate sample drawn from each rabbit.
Statistical analysis.Comparisons between the groups were performed by Kruskal-Wallis test (nonparametric analysis of variance [ANOVA]) or the Mann-Whitney U test, as appropriate. The central hypothesis of this analysis was based upon the response of the combination treatment in comparison to that of
anidulafungin alone and voriconazole alone. A two-tailed P value ofⱕ0.05 was
considered to be statistically significant. Survival was plotted by Kaplan-Meier analysis. Differences in survival of treatment groups and untreated controls were
analyzed by the log rank test. Values are expressed as means⫾ standard error of
the means (SEMs). Pharmacokinetic parameters were compared using ANOVA or Student’s t test, as appropriate.
RESULTS
Survival.
Improved survival was achieved through the entire
study in 6 (60%) of 10 AFG5
⫹VRC-treated rabbits, 6 (50%)
of 12 VRC, 3 (27%) of 11 AFG10
⫹VRC, 2 (22%) of 9 AFG5,
and 2 (18%) of 11 AFG10-treated rabbits in comparison to 0
(0%) of 17 untreated control rabbits (P
⬍ 0.001) (Fig. 1). Even
though the combination of AFG5
⫹VRC demonstrated the
highest survival rate (60%), there were no significant
differ-ences between either of the combination therapy groups and
the monotherapy groups.
Organism-mediated pulmonary injury.
There was a
signifi-cant reduction in organism-mediated pulmonary injury as
mea-FIG. 1. Response of primary pulmonary aspergillosis in persistently neutropenic rabbits to antifungal therapy measured by survival, mean
pulmonary infarct score, mean lung weight, and mean pulmonary tissue residual fungal burden (log CFU/g) in untreated controls (Control (n
⫽
17)) and rabbits treated with anidulafungin 5 mg/kg/day (AFG5 (n
⫽ 9)), anidulafungin 10 mg/kg/day (AFG10 (n ⫽ 11)), voriconazole 10
mg/kg/day Q8h (VRC (n
⫽ 12)), combination of AFG5 plus VRC (AFG5⫹VRC (n ⫽ 10)), and AFG10 plus VRC (AFG10⫹VRC (n ⫽ 11)).
Values are given as means
⫾ SEMs. For the measure of survival, the values on the y-axis are probability of survival, §, P ⱕ 0.05. For all other
comparisons,
*
, P
ⱕ 0.05; †, P ⱕ 0.05; ¶, P ⱕ 0.01.
on July 13, 2020 at UNIV DE LIEGE
http://aac.asm.org/
sured by infarct score, lung weight, and lesion volume. Rabbits
receiving the AFG5
⫹VRC combination had significantly lower
infarct scores in comparison to that of AFG5 (P
⬍ 0.01), and
VRC (P
⬍ 0.05) alone. In addition, rabbits treated with
AFG10
⫹VRC had significantly lower infarct scores in
com-parison to that of AFG10 (P
⬍ 0.05), but not of VRC-treated
rabbits.
Lung weight was significantly decreased in AFG5
⫹VRC-treated rabbits in comparison to that of AFG5 (P
⬍ 0.01) and
VRC (P
⬍ 0.05) alone treated rabbits. Moreover, lung weights
in AFG10
⫹VRC combination were significantly lower in
com-parison to that of AFG10 (P
⬍ 0.05), but not to VRC
mono-therapies (Fig. 1).
The pulmonary lesion volume measured by serial CT scans
was consistent with these findings and demonstrated significant
decrease in AFG5
⫹VRC-treated rabbits in comparison to
AFG5 and VRC (P
ⱕ 0.05) treated rabbits. On the other hand,
there were no significant differences in AFG10
⫹VRC group in
comparison to that AFG10 or VRC monotherapies (Fig. 2).
Residual fungal burden.
There was significant reduction of
residual fungal burden (CFU/g) in AFG5
⫹VRC-treated
rab-bits in comparison to AFG5 and VRC alone, (P
⬍ 0.05). There
were no significant differences of AFG10
⫹VRC-treated
rab-bits in comparison to that of AFG10 and VRC alone (Fig. 1).
Serum galactomannan.
There was a significantly lower GMI
on day 6 postinoculation in VRC, and AFG5
⫹VRC-treated
rabbits in comparison to that of all other groups (P
⬍ 0.05).
The GMI progressively increased in untreated controls, AFG5,
AFG10, and AFG10
⫹VRC-treated rabbits during the
experi-ment (Fig. 3).
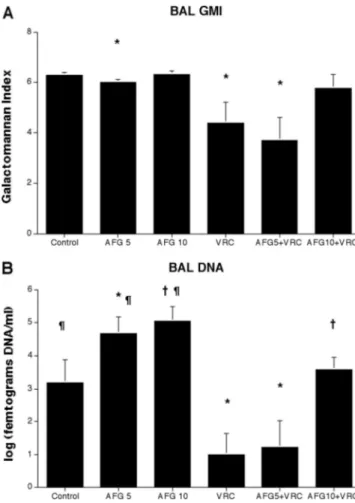
BAL fluid galactomannan.
Consistent with the response of
other parameters, there was a significant decrease of BAL fluid
GMI in rabbits treated with VRC alone or in combination of
AFG5
⫹VRC in comparison to that of AFG5-treated rabbits,
(P
⬍ 0.05). There were no significant differences between
AFG10
⫹VRC-treated rabbits and rabbits treated with AFG10
and VRC alone (Fig. 4A).
BAL fluid DNA.
There also was a similarly significant
de-crease of the concentration of Aspergillus DNA in BAL fluid of
rabbits treated with VRC alone or in combination of
AFG5
⫹VRC in comparison to that of AFG5-treated rabbits,
(P
⬍ 0.05). In addition AFG10⫹VRC treated rabbits showed
a significant decrease of DNA in BAL fluid in comparison of
that to AFG10-treated rabbits (P
⬍ 0.05), On the other hand
there was a significant increase of the DNA concentrations in
BAL in AFG5 and AFG10-treated rabbits in comparison to
that of untreated controls (Fig. 4B).
Pharmacodynamic interaction analysis.
The results of Bliss
independence drug interaction analysis for the in vivo
phar-macodynamic interaction of voriconazole and anidulafungin
are summarized in Table 1. Statistically significant Bliss
syn-ergy was found for the combination of AFG5
⫹VRC based on
residual fungal burden, pulmonary infarct scores, and
pulmo-nary infiltrate volume (CT scan) for which the observed drug
effects were 10 to 30% higher than the expected effects under
the Bliss independent zero-interaction hypothesis (Table 1).
Similarly, Bliss synergy was found in vitro when voriconazole
was combined with anidulafungin (mean
⌬E⫾SEM 27 ⫾ 4%)
(Fig. 5). Using the higher dosage of anidulafungin (10 mg/kg),
there was Bliss independence (no synergy) based on residual
fungal burden, pulmonary infarct scores, and pulmonary
infil-trate volume. Moreover, Bliss antagonism was found based on
BAL fluid DNA, GMI, and serum GMI (
⌬E ⫺14% to ⫺37%)
(Table 1).
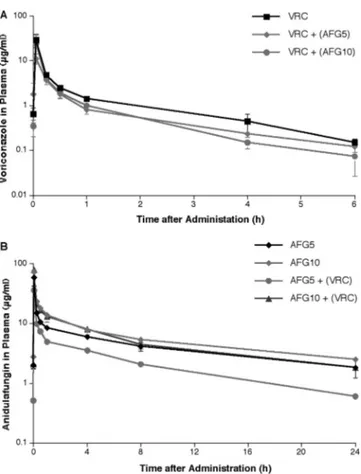
Pharmacokinetic analysis.
The observed plasma
concentra-tion-versus-time profiles of anidulafungin and voriconazole
FIG. 2. Pulmonary infiltrate volume determined by image
anal-ysis of serial CT scans of untreated controls (Control) (n
⫽ 6),
anidulafungin at 5 mg/kg/day (AFG5) (n
⫽ 4), at 10 mg/kg/day
(AFG10) (n
⫽ 4), voriconazole at 10 mg/kg/day q8h (VRC) (n ⫽ 4),
anidulafungin-voriconazole combinations (AFG5
⫹VRC) (n ⫽ 4),
and (AFG10
⫹VRC) (n ⫽ 4) treated rabbits. Animals treated with
AFG5
⫹VRC combination demonstrated significant resolution of
pulmonary infiltrate volume in comparison to that of anidulafungin
(
*
, P
ⱕ 0.05), and VRC (¶, P ⱕ 0.01) alone.
FIG. 3. Expression of galactomannan antigenemia in persistently
neutropenic rabbits with pulmonary aspergillosis treated with
anidu-lafungin at 5 (AFG5) (n
⫽ 6), anidulafungin at 10 mg/kg/day (AFG10)
(n
⫽ 8), voriconazole at 10 mg/kg q8h (VRC) (n ⫽ 10),
anidulafungin-voriconazole combinations (AFG5
⫹VRC (n ⫽ 7) and AFG10⫹VRC
(n
⫽ 8)), and untreared controls (Control) (n ⫽ 12). Animals treated
with the AFG5
⫹VRC combination and VRC alone had significantly
lower levels of galactomannan antigenemia in comparison to all other
groups (
*
, P
ⱕ 0.05).
on July 13, 2020 at UNIV DE LIEGE
http://aac.asm.org/
following administration of either compound alone and in
combination with each other are depicted in Fig. 6. The
cor-responding pharmacokinetic parameters are tabulated in
Ta-ble 2.
There was a significant difference in AUC
0–24 hof
anidula-fungin in animals receiving single agent versus combination
therapy, especially at 5 mg/kg (96.1
⫾ 39.07 to 38.1 ⫾ 9.47, P ⫽
0.007). On the other hand, there was no significant difference
between the mean AUC
0–24 hof anidulafungin at 10 mg/kg
coadministered with voriconazole and that of monotherapy
(P
⫽ 0.54). This interaction was mainly associated with faster
clearance of anidulafungin, and lower mean trough plasma
concentrations at the end of the 24 h dosing interval of
anidu-lafungin (Table 2). Coadministration of aniduanidu-lafungin was not
associated with a significant change in the plasma
pharmaco-kinetic parameters of voriconazole (Table 2). However, there
was a similar trend in decreased AUC
0–24 hof voriconazole
FIG. 4. Expression BAL fluid galactomannan antigen levels (A) and
A. fumigatus DNA levels (B) in persistently neutropenic rabbits with
pulmonary aspergillosis treated with anidulafungin at 5 (AFG5) (n
⫽ 6),
anidulafungin at 10 mg/kg/day (AFG10) (n
⫽ 8), voriconazole at 10 mg/kg
q8h (VRC) (n
⫽ 10), anidulafungin-voriconazole combinations
(AFG5
⫹VRC (n ⫽ 7) and AFG10⫹VRC (n ⫽ 8)), and untreated
con-trols (Control) (n
⫽ 15). (A): Animals treated with the AFG5⫹VRC
combination and VRC alone had significantly lower levels of
galactoman-nan antigen (
*
, P
ⱕ 0.05) in BAL fluid. (B): Animals treated with the
AFG5
⫹VRC combination and VRC alone had significantly lower levels
of DNA (
*
, P
ⱕ 0.05) in BAL fluid. AFG10⫹VRC treated rabbits showed
a significant decrease of DNA in BAL fluid in comparison of that to
AFG10-treated rabbits (†, P
⬍ 0.05), AFG5- and AFG10-treated rabbits
significantly higher DNA concentrations in BAL in comparison to that of
untreated controls (¶, P
⬍ 0.05).
TABLE 1. Efficacies of monotherapy and combination therapy and results of Bliss independence pharmacodynamic interaction analysis
aBiomarkerb
Efficacy of monotherapy Efficacy of AFG5⫹VRC combination Efficacy of AFG10⫹VRC combination
EVRC10 EAFG5 EAFG10 Observed Expected
c ⌬E (95% confidence interval)
(Bliss interaction)d Observed Expectedc ⌬E (95% confidence interval)
(Bliss interaction)d
RFB
22
⫾ 9
8
⫾ 3
22
⫾ 11 51 ⫾ 10
28
⫾ 5
23 (40–5)* (S)
45
⫾ 14
40
⫾ 5
6 (20-
⫺10) (I)
PIL
44
⫾ 13 27 ⫾ 12 30 ⫾ 11 85 ⫾ 7
59
⫾ 8
25 (42–8)** (S)
73
⫾ 7
61
⫾ 7
13 (29-
⫺3) (I)
LW
48
⫾ 11 24 ⫾ 13 26 ⫾ 10 64 ⫾ 6
60
⫾ 6
4 (18-
⫺11) (I)
50
⫾ 9
62
⫾ 5
⫺12 (4-⫺28) (I)
BAL GMI
30
⫾ 13
4
⫾ 1
0
⫾ 1
41
⫾ 14
33
⫾ 5
8 (45-
⫺29) (I)
8
⫾ 9
29
⫾ 5
⫺21 (2-⫺44)* (A)
BAL DNA
65
⫾ 13
7
⫾ 7
0
⫾ 4
76
⫾ 16
69
⫾ 4
6 (48-
⫺35) (I)
29
⫾ 7
67
⫾ 5
⫺37 (⫺19-⫺55)*** (A)
Serum GMI
62
⫾ 9
8
⫾ 6
8
⫾ 3
58
⫾ 12
65
⫾ 7
⫺7 (20-⫺38) (I)
47
⫾ 5
61
⫾ 4
⫺14 (⫺5-⫺27)* (A)
CT scan
66
⫾ 3
45
⫾ 1
45
⫾ 1
91
⫾ 5
81
⫾ 4
10 (1–19)* (S)
85
⫾ 4
81
⫾ 4
4 (12-
⫺4) (I)
aData are mean⫾ SE % reductions compared to the control group.
bRFB, residual fungal burden in lungs; PIL, pulmonary infarct lesions; LW, lung weight; BAL GMI, galactomannan index in BAL fluid; BAL DNA, Aspergillus DNA
in BAL fluid; serum GMI, kinetics of galactomannan index in serum; CT scan, kinetics of lung lesion volumes.
cAverages and SE for independent effects E
EXP5⫹ 10and EEXP10⫹ 10were derived by using all possible combinations of the monotherapy data for each of the
VRC- and AFG5- or AFG10-treated animals, respectively.
dA, Bliss antagonism; I, Bliss independence; S, Bliss synergy;ⴱ, P ⬍ 0.05; ⴱⴱⴱ, P ⬍ 0.001.
FIG. 5. Interaction surfaces obtained from response surface
anal-ysis of Bliss independence drug interaction model for the in vitro
combination of anidulafungin and voriconazole against A. fumigatus,
with 48 h of incubation. The X- and Y- axis are the concentrations of
anidulafungin and voriconazole, respectively. The Z- axis is the
⌬E in
%. The 0-plane represent Bliss independent interactions whereas the
volumes above the 0-plane represent statistically significantly
synergis-tic (positive
⌬E) interactions. The magnitude of interactions is directly
related to
⌬E. The different tones in the three dimensional plots
represent different percentile bands of synergy. The mean
⌬E⫾SEM
and sum
⌬E were 27 ⫾ 4% and 334%, respectively, after 48 h.
on July 13, 2020 at UNIV DE LIEGE
http://aac.asm.org/
from 6.02
⫾ 2.52 mg*h/L to 3.83 ⫾ 1.49 mg*h/L in the animals
treated with combination of AFG5⫹VRC.
Safety.
There were significantly lower levels of serum
creat-inine, urea nitrogen, ALT and AST in AFG5⫹VRC treated
rabbits in comparison to that of AFG5 alone (P
⬍ 0.05). In
addition AFG10
⫹VRC treated rabbits had significantly lower
levels of serum urea nitrogen and ALT in comparison to that
of AFG10 (P
⬍ 0.05). On the other hand, there was
signifi-cantly lower level of serum urea nitrogen, ALT, and AST in
rabbits receiving combination therapy of AFG5
⫹VRC in
com-parison to controls (P
⬍ 0.05), while combination of
AFG10
⫹VRC had significantly lower levels only of serum urea
nitrogen in comparison to controls (P
⬍ 0.05) (Table 3).
DISCUSSION
This study demonstrated in vitro and in vivo concentration
and dose dependent interactions between the echinocandin
anidulafungin and the triazole voriconazole by Bliss
indepen-dence drug interaction analysis of microbiological,
radiologi-cal, and antigenic endpoints. To our knowledge, this is the first
time that the potentially synergistic echinocandtriazole
in-teraction has been described by Bliss independence modeling.
Using the panel of different outcome variables, application of
Bliss independence analysis allowed us to demonstrate
syner-gistic, independent, or antagonistic interactions of this
poten-tially useful combination. There was a significant decrease of
pulmonary infarct score, lung weight, residual fungal burden,
and galactomannan antigenemia in combination with
anidula-fungin at 5 mg/kg/day and voriconazole, and only significant
decrease of pulmonary infarct score and lung weight with
anidulafungin at 10 mg/kg/day and voriconazole combination
when compare to monotherapies. Notably, the magnitude of
these interactions was similar for the in vitro and in vivo
com-bination studies when analyzed by the Bliss independence drug
interaction analysis.
When using voriconazole in combination with the lower
dosage of anidulafungin (5 mg/kg) in combination, the results
were synergistic or independent by Bliss pharmacodynamic
drug interaction analysis. There also was a correlation between
the synergy measured by echinocandin-triazole antifungal
ac-tivity in causing hyphal damage of A. fumigatus and the
syner-gistic interaction observed in vivo as measured by reduction of
residual fungal burden (log CFU/g), improved survival,
re-FIG. 6. Plasma concentration profiles of voriconazole and
voricon-azole
⫹anidulafungin (A), anidulafungin and
anidulafungin⫹voricon-azole (B), after multiple intravenous daily doses. All values represent
the means
⫾ standard errors of the mean.
TABLE 2. Pharmacokinetic parameters for anidulafungin and voriconazole in rabbits with invasive pulmonary aspergillosis treated with either
compound alone or in combination
aDrug and treatment regimen Vc(liters)b Kcp(h⫺1) Kpc(h⫺1) SCL (liters/h)c AUC0–24(mg䡠 h/liter)f
Anidulafungin at 5 mg/kg
Monotherapy
0.85 (0.38)
1.58 (1.49)
0.68 (0.27)
0.16 (0.06)
96.1 (39.07)
dCombination
0.94 (0.41)
3.22 (2.65)
1.55 (0.83)
0.40 (0.10)
38.1 (9.47)
Anidulafungin at 10 mg/kg
Monotherapy
1.02 (0.33)
1.00 (0.31)
0.36 (0.15)
0.20 (0.05)
136.29 (36.13)
eCombination
1.22 (0.62)
1.11 (0.94)
0.48 (0.26)
0.28 (0.17)
121.89 (50.96)
Voriconazole at 10 mg/kg
Monotherapy
5.26 (4.44)
1.69 (1.30)
0.45 (0.57)
5.40 (2.20)
6.02 (2.52)
Combination at 5 mg/kg
5.97 (2.25)
1.93 (1.12)
0.08 (0.03)
8.58 (4.60)
3.83 (1.49)
Combination at 10 mg/kg
5.67 (4.28)
1.43 (0.82)
0.09 (0.04)
6.19 (1.89)
4.84 (1.60)
aData are presented as means (SD). V
c, volume of central compartment; Kcpand Kpc, intercompartmental rate constants; SCL, clearance from central compartment.
bP⫽ 0.46 for comparison among groups for anidulafungin and 0.95 for comparison among groups for voriconazole, using ANOVA.
cP⫽ 0.003 for comparison among groups for anidulafungin and 0.15 for comparison among groups for voriconazole, using ANOVA.
dP⫽ 0.007 for monotherapy versus combination therapy at 5 mg/kg, using Student’s t test.
eP⫽ 0.54 for monotherapy versus combination therapy at 10 mg/kg, using Student’s t test.
fP⫽ 0.19 for comparison among groups for voriconazole, using ANOVA.
on July 13, 2020 at UNIV DE LIEGE
http://aac.asm.org/
duced galactomannan antigenemia, and decreased pulmonary
injury (lung weights, infarct scores, and pulmonary infiltrate
volume by CT) all of which were superior to the effects of the
single agents and untreated controls.
This synergistic interaction between the echinocandin and
the triazole is most likely due to simultaneous inhibition of
biosynthesis of (133)-
-D-glucan in the fungal cell wall and
ergosterol in the cell membrane. These apparently
indepen-dent mechanisms of action on the cell wall and membrane
would likely lead to an additive or synergistic interaction
against filamentous fungi. This additive to synergistic
interac-tion stands in contrast to the potential antagonism observed
with azoles and polyenes (16, 30, 31, 35). Antifungal azoles
deplete the fungal cell membrane of ergosterol and thereby
diminish the principal biochemical target of amphotericin B.
Both azoles and polyenes ultimately interact at the level of
ergosterol and thus carry the potential for antagonism against
A. fumigatus (34). However, in the setting of CNS aspergillosis
where concentrations of amphotericin B are substantially
lower in cerebral tissue, a different interaction may ensue to
result in additive to synergistic interaction. This is exemplified
by the combination therapy study of voriconazole and lipid
formulations of amphotericin B in experimental murine CNS
aspergillosis by Clemons et al. (2, 3). The synergistic
interac-tion described between voriconazole and anidulafungin is
likely applicable to the other combinations of the class of
echinocandins and triazoles. For example, Perea and
col-leagues reported in vitro synergistic interactions between
caspofungin and voriconazole (24). Manavathu and colleagues
reported in vitro synergistic interactions between itraconazole
and caspofungin, as well as between posaconazole and
caspo-fungin (15). Patterson and colleagues described in vivo synergy
between voriconazole and caspofungin in reducing the number
of positive cultures in experimental disseminated aspergillosis
in guinea pigs (11). In addition, we previously described in vivo
synergistic interaction between ravuconazole and micafungin
(26) in experimental invasive pulmonary aspergillosis in
per-sistently neutropenic rabbits.
Our analysis demonstrates that echinocandin-triazole
inter-actions may be concentration-dependent and dose-dependent.
The higher dosage of anidulafungin (10 mg/kg) in combination
with voriconazole resulted in Bliss independence and loss of
the synergy observed at lower anidulafungin dosage. This loss
of synergy at the higher dosage of anidulafungin (10 mg/kg)
was consistent across several outcome variables, including
re-sidual fungal burden, pulmonary infarct score, and pulmonary
infiltrate volume in replicate experiments. There also was
an-tagonism as shown by BAL fluid galactomannan, DNA, and
serum galactomannan levels at the higher dosage. Thus, when
choosing combination therapy, one should be aware that not
all doses might achieve the desired effect of synergistic
inter-action.
This dose dependent reduction of synergistic interaction
may have several possible mechanisms. An increase of
anidu-lafungin dosage from 5 to 10 mg/kg may cause increased cell
wall injury and disruption of the tertiary structure of
trans-membrane proteins that otherwise would facilitate uptake of
voriconazole. Alternatively, the higher dosage of
anidula-fungin may also result indirectly in secondary injury to the
fungal cytoplasmic structures, including mitochondria, and
potentially antagonize the effect of voriconazole on
ergos-terol biosynthesis.
At the same time, the effect of a given outcome variable
should be considered when analyzing results of combination
therapy. When combination therapy is not extremely superior,
not all outcome variables or tests chosen to assess efficacy, can
equally depict subtle differences. As evident from this study,
when residual fungal burden and pulmonary lesion score were
chosen for analysis using Bliss independence model, the
inter-action between echinocandin and triazole was synergistic.
However, when lung weight and BAL fluid galactomannan
index were analyzed, interaction demonstrated independence,
with trends suggestive of the benefit of combination therapy.
GMI and lung weight may be delayed in rapid return to normal
when therapy is effective. These findings underscore the
im-portance of studying multiple outcome variables in vivo and in
clinical settings.
The dose-dependent increase in BAL DNA in Fig. 4
dem-onstrates that the rabbits treated with echinocandin
(anidula-fungin, 5 and 10 mg/kg) had paradoxically higher
concentra-tions of DNA (log (femtograms DNA per ml)). This
paradoxically increased amount of DNA may pertain to the
mechanism of echinocandin where the effect of echinocandin
fragments hyphal structures and contributes to an overall
in-crease in the number of viable hyphal elements. In addition,
echinocandins will inhibit germination of Aspergillus conidia,
which will provide an additional source of DNA. The smaller
hyphal fragments may be more readily lavaged and recovered
in comparison to that of well-established hyphae invading
tis-sue in untreated controls.
Anidulafungin dosages were selected carefully to
approxi-mate human AUC exposure. A single anidulafungin dosage of
TABLE 3. Effects of anidulafungin-voriconazole combination on serum creatinine, serum urea nitrogen, serum ALT, serum AST, and
potassium concentrations in persistently neutropenic rabbits with pulmonary aspergillosis
aTreatment group (n) Serum creatinine
concn (mg/dl)
Serum urea nitrogen concn (mg/dl)
Serum ALT concn (U/liter)
Serum AST concn (U/liter)
Serum potassium concn (mmol/liter)
Controls (14)
1.67
⫾ 0.57
33.2
⫾ 9.86†
45.2
⫾ 13.5†
71.4
⫾ 28.5†
3.20
⫾ 0.21
VRC (12)
1.02
⫾ 0.06
12.8
⫾ 1.49
22.2
⫾ 5.52
26.8
⫾ 6.98
3.17
⫾ 0.32
AFG5 (9)
1.50
⫾ 0.24*
29.8
⫾ 9.42*
22.2
⫾ 3.65*
34.3
⫾ 5.78*
2.82
⫾ 0.13
AFG5
⫹VRC (10)
0.98
⫾ 0.08*
11.8
⫾ 1.20*†
11.8
⫾ 1.40*†
13.2
⫾ 3.37*†
3.90
⫾ 0.08
AFG10 (11)
1.34
⫾ 0.25
22.4
⫾ 2.54*
39.4
⫾ 7.22*
48.3
⫾ 15.4
3.45
⫾ 0.22
AFG10
⫹VRC (11)
0.94
⫾ 0.07
15.4
⫾ 1.86*†
19.2
⫾ 3.57*
16.0
⫾ 4.04
3.54
⫾ 0.35
aAll values are expressed as means⫾ SEM. *, for comparison between combination therapy and monotherapy, P ⬍ 0.05 (Mann-Whitney U test); †, for comparison
between combination therapy and controls, P⬍ 0.05 (Mann-Whitney U test).
on July 13, 2020 at UNIV DE LIEGE
http://aac.asm.org/
5 mg/kg in rabbits as monotherapy conferred a mean AUC of
96.1 mg*h/L. Similarly, the phase I study of safety and
phar-macokinetics of intravenous anidulafungin in children with
neutropenia at high-risk for invasive fungal infections at a
single dosage of 3 mg/kg conferred a mean AUC
0–24 hof 89.7
mg*h/L and 1.5 mg/kg after multiple dosage yielded a mean
AUC
ssof 99.5 mg*h/L. The plasma exposure is comparable to
that achieved by the standard 100 mg adult dose in steady state.
As the plasma pharmocokinetics appear to be linear, a dosage
of 10 mg/kg in rabbits would be equivalent to a dosage of 6
mg/kg in pediatric patients or a 200 mg adult dose.
Given the life-threatening nature of invasive pulmonary
as-pergillosis in neutropenic and other immunocompromised
hosts, the critical question arises as to whether a higher dosage
of echinocandin further enhances the antifungal activity of
the triazole echinocandin combination. Therefore, we tested
whether a doubling of the standard dosage equivalent was
beneficial. The doubling of the dosage led to an increase in
mean AUC of 136 mg*h/L. Thus, the dosage selected in these
experiments span the potential range of treatment of human
fungal disease. Higher dosages would have little clinical
rele-vance.
Thus, an increase in AUC beyond the approved equivalent
dosage did not confer increased benefit. Additional studies
exploring the lower ranges of anidulafungin may further
elu-cidate the synergistic interactions; however, as these lower
dosages would likely be below those of the approved
therapeu-tic doses, these studies are beyond the scope of the current
study.
The pharmacokinetic profiles of anidulafungin and
voricon-azole changed during combination therapy. These differences
are unlikely to be related to direct drug interactions. Dowell et
al. demonstrated that the pharmacokinetics of anidulafungin
and voriconazole were not affected by coadministration in
nor-mal human volunteers (5). The exposure of anidulafungin in
normal rabbits, as described by Groll and colleagues (7), is
similar to that of rabbits treated with combination therapy
AFG5
⫹VRC, which also was the more effective antifungal
regimen. Animals treated with the less active single agent
AFG5 had higher circulating concentrations. A reasonable
hy-pothesis, by which to explain these observations, is that rabbits
with more advanced aspergillosis (those receiving
mono-therapy) had smaller circulating blood volume (related to
in-sensible loss) and thus increased serum concentrations.
Rab-bits with more effectively treated aspergillosis had plasma
AUCs comparable to those of noninfected rabbits. Similar
trends of higher voriconazole exposures also were observed in
single agent treatment versus combination therapy, although
these differences did not achieve statistical significance.
That rabbits receiving the combination of AFG5
⫹VRC
physiologically approached the status of noninfected animals
also can be observed in Table 3. Rabbits in the AFG5
⫹VRC
group had lower values of serum creatinine, urea nitrogen,
ALT, and AST, as well as higher serum potassium in
compar-ison to all other groups, particularly those in the AFG5 and
AFG10. Thus, the improved efficacy of AFG5
⫹VRC in
treat-ment of invasive pulmonary aspergillosis correlates with
im-proved renal and hepatic function.
Results from this study and those of other laboratories
dem-onstrate the complexity and potential benefit of synergistic
echinocandin-triazole interactions. These in vitro and in vivo
studies may help guide the design and interpretation of
echi-nocandin-triazole clinical trials in treatment of invasive
pulmo-nary aspergillosis.
REFERENCES
1. Anaissie, E. 1992. Opportunistic mycoses in the immunocompromised host: experience at a cancer center and review. Clin. Infect. Dis. 14(Suppl. 1):S43–S53.
2. Clemons, K. V., M. Espiritu, R. Parmar, and D. A. Stevens. 2005. Compar-ative efficacies of conventional amphotericin B, liposomal amphotericin B (AmBisome), caspofungin, micafungin, and voriconazole alone and in com-bination against experimental murine central nervous system aspergillosis. Antimicrob. Agents Chemother. 49:4867–4875.
3. Clemons, K. V., R. Parmar, M. Martinez, and D. A. Stevens. 2006. Efficacy of Abelcet alone, or in combination therapy, against experimental central nervous system aspergillosis. J. Antimicrob. Chemother. 58:466–469. 4. Denning, D. W. 2001. Chronic forms of pulmonary aspergillosis. Clin.
Mi-crobiol. Infect. 7(Suppl. 2):25–31.
5. Dowell, J. A., J. Schranz, A. Baruch, and G. Foster. 2005. Safety and phar-macokinetics of coadministered voriconazole and anidulafungin. J. Clin. Pharmacol. 45:1373–1382.
6. Georgopapadakou, N. H. 2001. Update on antifungals targeted to the cell wall: focus on beta-1,3-glucan synthase inhibitors. Expert Opin. Investig. Drugs 10:269–280.
7. Groll, A. H., D. Mickiene, R. Petraitiene, V. Petraitis, C. A. Lyman, J. S.
Bacher, S. C. Piscitelli, and T. J. Walsh.2001. Pharmacokinetic and phar-macodynamic modeling of anidulafungin (LY303366): reappraisal of its ef-ficacy in neutropenic animal models of opportunistic mycoses using optimal plasma sampling. Antimicrob. Agents Chemother. 45:2845–2855. 8. Groll, A. H., P. M. Shah, C. Mentzel, M. Schneider, G. Just-Nuebling, and
K. Huebner.1996. Trends in the postmortem epidemiology of invasive fungal infections at a university hospital. J. Infect. 33:23–32.
9. Hope, W. W., and D. W. Denning. 2004. Invasive aspergillosis: current and future challenges in diagnosis and therapy. Clin. Microbiol. Infect. 10:2–4. 10. Johnson, M. D., C. MacDougall, L. Ostrosky-Zeichner, J. R. Perfect, and
J. H. Rex.2004. Combination antifungal therapy. Antimicrob. Agents Che-mother. 48:693–715.
11. Kirkpatrick, W. R., S. Perea, B. J. Coco, and T. F. Patterson. 2002. Efficacy of caspofungin alone and in combination with voriconazole in a guinea pig model of invasive aspergillosis. Antimicrob. Agents Chemother. 46:2564– 2568.
12. Kurtz, M. B., I. B. Heath, J. Marrinan, S. Dreikorn, J. Onishi, and C.
Douglas.1994. Morphological effects of lipopeptides against Aspergillus
fu-migatus correlate with activities against (1,3)-beta-D-glucan synthase. Anti-microb. Agents Chemother. 38:1480–1489.
13. Latge, J. P. 1999. Aspergillus fumigatus and aspergillosis. Clin. Microbiol. Rev. 12:310–350.
14. Leary, R., R. Jelliffe, A. Schumitzky, and M. van Guilder. 2001. An adaptive grid, nonparametric approach to pharmacokinetic and dynamic (PK/PD) models, p. 389–394. In Proceedings of the Fourteenth IEEE Symposium on Computer Based Medical Systems. IEEE Computer Society, Bethesda, MD. 15. Manavathu, E. K., G. J. Alangaden, and P. H. Chandrasekar. 2003. Differ-ential activity of triazoles in two-drug combinations with the echinocandin caspofungin against Aspergillus fumigatus. J. Antimicrob. Chemother. 51: 1423–1425.
16. Meletiadis, J., V. Petraitis, R. Petraitiene, P. Lin, T. Stergiopoulou, A. M.
Kelaher, T. Sein, R. L. Schaufele, J. Bacher, and T. J. Walsh.2006. Triazole-polyene antagonism in experimental invasive pulmonary aspergillosis: in vitro and in vivo correlation. J. Infect. Dis. 194:1008–1018.
17. Murphy, M., E. M. Bernard, T. Ishimaru, and D. Armstrong. 1997. Activity of voriconazole (UK-109,496) against clinical isolates of Aspergillus species and its effectiveness in an experimental model of invasive pulmonary as-pergillosis. Antimicrob. Agents Chemother. 41:696–698.
18. National Committee for Clinical Laboratory Standards. 2002. Reference method for broth dilution antifungal susceptibility testing of filamentous fungi. Approved standard M38-A. NCCLS, Wayne, PA.
19. National Research Council. 1996. Guide for the care and use of laboratory animals. National Academy Press, Washington, DC.
20. O’Sullivan, C. E., M. Kasai, A. Francesconi, V. Petraitis, R. Petraitiene,
A. M. Kelaher, A. A. Sarafandi, and T. J. Walsh.2003. Development and validation of a quantitative real-time PCR assay using fluorescence reso-nance energy transfer technology for detection of Aspergillus fumigatus in experimental invasive pulmonary aspergillosis. J. Clin. Microbiol. 41:5676– 5682.
21. Pannuti, C., R. Gingrich, M. A. Pfaller, C. Kao, and R. P. Wenzel. 1992. Nosocomial pneumonia in patients having bone marrow transplant. Attrib-utable mortality and risk factors. Cancer 69:2653–2662.
22. Patterson, T. F., W. R. Kirkpatrick, M. White, J. W. Hiemenz, J. R. Wingard,
B. Dupont, M. G. Rinaldi, D. A. Stevens, J. R. Graybill, et al.2000. Invasive
on July 13, 2020 at UNIV DE LIEGE
http://aac.asm.org/
aspergillosis. Disease spectrum, treatment practices, and outcomes. Medi-cine (Baltimore) 79:250–260.
23. Pennick, G. J., M. Clark, D. A. Sutton, and M. G. Rinaldi. 2003. Develop-ment and validation of a high-performance liquid chromatography assay for voriconazole. Antimicrob. Agents Chemother. 47:2348–2350.
24. Perea, S., G. Gonzalez, A. W. Fothergill, W. R. Kirkpatrick, M. G. Rinaldi,
and T. F. Patterson.2002. In vitro interaction of caspofungin acetate with voriconazole against clinical isolates of Aspergillus spp. Antimicrob. Agents Chemother. 46:3039–3041.
25. Petraitiene, R., V. Petraitis, A. H. Groll, T. Sein, S. Piscitelli, M. Candelario,
A. Field-Ridley, N. Avila, J. Bacher, and T. J. Walsh. 2001. Antifungal activity and pharmacokinetics of posaconazole (SCH 56592) in treatment and prevention of experimental invasive pulmonary aspergillosis: correlation with galactomannan antigenemia. Antimicrob. Agents Chemother. 45:857– 869.
26. Petraitis, V., R. Petraitiene, A. A. Sarafandi, A. M. Kelaher, C. A. Lyman,
H. E. Casler, T. Sein, A. H. Groll, J. Bacher, N. A. Avila, and T. J. Walsh.
2003. Combination therapy in treatment of experimental pulmonary as-pergillosis: synergistic interaction between an antifungal triazole and an echinocandin. J. Infect. Dis. 187:1834–1843.
27. Petraitis, V., R. Petraitiene, J. Solomon, A. M. Kelaher, H. A. Murray, C.
Mya-San, A. K. Bhandary, T. Sein, N. A. Avila, A. Basevicius, J. Bacher, and T. J. Walsh.2006. Multidimensional volumetric imaging of pulmonary infil-trates for measuring therapeutic response to antifungal therapy in experi-mental invasive pulmonary aspergillosis. Antimicrob. Agents Chemother.
50:1510–1517.
28. Pfaller, M. A., S. A. Messer, R. J. Hollis, and R. N. Jones. 2002. Antifungal activities of posaconazole, ravuconazole, and voriconazole compared to those of itraconazole and amphotericin B against 239 clinical isolates of
Aspergillus spp. and other filamentous fungi: report from SENTRY
Antimi-crobial Surveillance Program, 2000. Antimicrob. Agents Chemother. 46: 1032–1037.
29. Sambatakou, H., B. Dupont, H. Lode, and D. W. Denning. 2006. Voricon-azole treatment for subacute invasive and chronic pulmonary aspergillosis. Am. J. Med. 119:527.e17–527.e24.
30. Schaffner, A., and A. Bohler. 1993. Amphotericin B refractory aspergillosis after itraconazole: evidence for significant antagonism. Mycoses 36:421–424. 31. Schaffner, A., and P. G. Frick. 1985. The effect of ketoconazole on ampho-tericin B in a model of disseminated aspergillosis. J. Infect. Dis. 151:902–910. 32. Segal, B. H., N. G. Almyroudis, M. Battiwalla, R. Herbrecht, J. R. Perfect,
T. J. Walsh, and J. R. Wingard.2007. Prevention and early treatment of invasive fungal infection in patients with cancer and neutropenia and in stem cell transplant recipients in the era of newer broad-spectrum antifungal agents and diagnostic adjuncts. Clin. Infect. Dis. 44:402–409.
33. Stynen, D., J. Sarfati, A. Goris, M. C. Prevost, M. Lesourd, H. Kamphuis, V.
Darras, and J. P. Latge.1992. Rat monoclonal antibodies against Aspergillus galactomannan. Infect. Immun. 60:2237–2245.
34. Sugar, A. M. 1995. Use of amphotericin B with azole antifungal drugs: what are we doing? Antimicrob. Agents Chemother. 39:1907–1912.
35. Sugar, A. M., and X. P. Liu. 1998. Interactions of itraconazole with ampho-tericin B in the treatment of murine invasive candidiasis. J. Infect. Dis.
177:1660–1663.
36. Wald, A., W. Leisenring, J. A. van Burik, and R. A. Bowden. 1997. Epide-miology of Aspergillus infections in a large cohort of patients undergoing bone marrow transplantation. J. Infect. Dis. 175:1459–1466.
37. Walsh, T. J., J. Bacher, and P. A. Pizzo. 1988. Chronic silastic central venous catheterization for induction, maintenance and support of persistent granu-locytopenia in rabbits. Lab. Anim. Sci. 38:467–471.
38. Walsh, T. J., K. Garrett, E. Feurerstein, M. Girton, M. Allende, J. Bacher,
A. Francesconi, R. Schaufele, and P. A. Pizzo.1995. Therapeutic monitoring of experimental invasive pulmonary aspergillosis by ultrafast computerized tomography, a novel, noninvasive method for measuring responses to anti-fungal therapy. Antimicrob. Agents Chemother. 39:1065–1069.