Combining cross-hole geophysical and vadose zone monitoring
systems for vadose zone characterization at industrial contaminated
sites
Natalia Fernández de Vera
1, Jean Beaujean
2, Pierre Jamin
1, David Caterina
2, Marnik Vanclooster
3,
Alain Dassargues
1, Ofer Dahan
4,
Frédéric Nguyen
2, Serge Brouyère
15
1
Department of Hydrogeology and Environmental Geology, University of Liège, Liège, 4000, Belgium
2Department of Applied Geophysics, University of Liège, Liège, 4000, Belgium
3Earth and Life Institute - Environmental Sciences, Université Catholique de Louvain, Louvain-La-Neuve, 1348, Belgium 4
Department of Hydrology & Microbiology, Zuckerberg Institute for Water Research, Blaustein Institutes for Desert 10
Research, Ben Gurion University of the Negev, Sde Boker Campus, Negev 84990, Israel Correspondence to: N. Fernández de Vera (nfdvera@ulg.ac.be)
Abstract. Water flow and solute transport through a fractured vadose zone underneath an industrial contaminated site in
Belgium were studied with a new methodological concept. The Vadose Zone Experimental Setup (VZES) combines a vadose zone monitoring system (VMS) with cross-borehole geophysics. The VMS provides continuous chemical and 15
hydraulic information at multiple depths in the vadose zone. When combining such information with multidirectional subsurface imaging from geophysical measurements, flow and transport can be characterized at a scale that covers the spatial variability of the subsurface. The setup was installed on site and monitoring was carried out under natural recharge conditions. Results reveal quick rises in water content as a response to rainfall events in the upper and intermediate part of the vadose zone (down to 3.65m depth). Macropore, micropore, matrix and preferential flow mechanisms are identified at 20
these depth ranges. At greater depths, flow dynamics is slower and dominated by matrix flow. The governance of water flow mechanisms at different directions is controlled by the heterogeneous distribution of geological materials. Results from sampled waters across the vadose zone reveal that the chemistry of water collected from matrix is different from that collected from fractures. In addition, analysis of heavy metals indicates that Ni is leaching across the vadose zone, and its release might be a consequence of pyrite oxidation from backfilled materials. Results obtained from VZES indicate that the 25
combination of different techniques providing in situ quantitative and qualitative information improves conceptual models of flow and transport in a heterogeneous subsurface.
1 Introduction
Understanding flow and contaminant transport underneath industrial contaminated sites requires technologies that provide hydraulic and chemical information across the entire vadose zone area. Recent developments have adapted instrumentation initially designed for agricultural applications, allowing installation beneath shallow depths (<2m) in materials other than unconsolidated (Hubbell et al., 2002, Or et al., 2006). The most commonly used instrumentation includes water content 5
sensors such as Time Domain Reflectometry probes (TDR), suction cups for pore water sampling and tensiometers for water pressure measurements (Hubbell et al., 2002, Dahan et al., 2009). However, continuous developments provide alternative methods that aim to improve the quality of measurements. For example, Blonquist et al. (2005) proposed Time Domain Transmissometry sensors (TDT) as an alternative to TDR to reduce signal attenuation.
Implementation of sensors in deeper sections of the vadose zone are usually achieved by attaching them to the side wall of 10
uncased vertical and slanted boreholes (e.g., Burns et al., 2000; Gee et al., 2003; Hubbell et al., 2002; Flint et al., 2000; West and Truss, 2006). An alternative method of installation is provided with the Vadose Zone Monitoring System (VMS) (Dahan et al., 2003). The insertion of a flexible sleeve containing flexible TDR probes (FTDR) and vadose sampling ports in to a slanted borehole ensures maximum contact between probes and undisturbed soil (Dahan et al., 2009; Rimon et al., 2011; Amiaz et al., 2011; Baram et al., 2013; Turkeltaub et al., 2013; Dahan et al., 2014).
15
While most technologies have succeeded in characterizing flow and transport through sand, clay and gravels, in situ characterization in unsaturated fractured rocks remains challenging. This is caused by the heterogeneous distribution of porous matrix and fractures. In addition, it is difficult to establish whether sampled waters come from matrix pores or fractures (Or et al., 2006; Faybishenko et al., 2000). Therefore, it is clear that point measurements are not representative enough of such complex heterogeneous systems.
20
Recent developments in geophysical methods have allowed characterizing the spatial variability of the subsurface (Bakr et al., 1978). Electrical Resistivity Tomography (ERT) methods have allowed the delineation of geological structures and fractures in the subsurface through imaging of electrical properties (Al Hagrey et al. 1999; Boadu et al., 2005; Robert et al., 2011; Arora and Ahmed, 2011). To improve the limited depth sensitivity from surface surveys, electrode arrays were developed and installed in boreholes (Daily and Owen, 1991; Daniels et al., 2005, Perri et al., 2012). Despite improvements 25
in resolution, geophysical information is mostly used in a qualitative manner. However, it can be of extreme value if integrated with suitable hydrological information (Slater et al., 2002).
In this article, a new methodological concept for vadose zone subsurface characterization is presented by combining point measurements from the VMS and qualitative information from cross-hole ERT methods. Such merged technologies are being tested for the first time at an industrial contaminated site in Belgium, with the aim of characterizing flow and transport 30
through unsaturated fractured chalk. In addition, FTDR probes containing modified Acclima TDT moisture sensors are being tested for the first time. A description of the experimental site and setup is provided in this document, followed by an interpretation and discussion of first results.
2 Experimental site
The study area is located in the northern flank of the Mons Basin, which is a large east-west oriented syncline in the south-west of Belgium (Fig. 1). The geology of the basin consists of a succession of Mesozoic and Cenozoic deposits in discordance over a Paleozoic basement (Marlière, 1977; FPMS, 2000). Specifically, it covers the base of the Cretaceous chalk deposits. At the top, heterogeneous chalk levels from the St. Vaast and Maisières formations are encountered. These 5
lithologies are underlined by levels of silex and chalk (Silex d’Hautrage formation), marking the transition to marl deposits containing chert nodules from the Ville-Pommeroeul formation (Marlière, 1977; FMPS, 2000; Dassargues and Monjoie, 1993).
The experimental setup is located over the Cretaceous chalk aquifer, which is phreatic and shallow at the area of interest and is encountered at depths ranging from 6 to 15 m. The chalk is usually characterized by a dual-porosity and dual-permeability 10
structure (Dassargues and Monjoie, 1993; Brouyère et al., 2004). The chalk matrix has a strong storage capacity with a large total porosity (30-50%) and relatively low hydraulic conductivity (5.10-8 to 5.10-10 m/s). The fractures developed in the chalk rock contribute to the aquifer aptitude of the rock, with low associated porosity (0.5 % according to Barker and Wright, 2000) and larger hydraulic conductivity (5.10-5 to 2.10-3 m/s) (SPW, 2010). Preliminary studies focusing on detection and characterization of chalk fractures at the study site were particularly challenging as they are quite heterogeneous, soft and 15
humid. Therefore, fractures could not be characterized with conventional methods.
At the scale of the study site, groundwater flows from north to south (FPMS, 2000), although local fluctuations towards NW-SE directions have been observed (Fig. 1). The groundwater table is located at 8 m below ground surface, with seasonal variations of up to 3 m.
2.1 Soil and groundwater pollution
20
The study area is located at a former industrial site which was active from 1928 until 1997. Coal production and elaboration of by-products coming from coal distillation were the main activities around the area (SPaQuE, 2008). The legacy of such activities led to heavy soil and groundwater contamination. Results from a soil sampling survey carried out in 2011 indicate contaminated soils with PAH and heavy metals at the area where the experiment takes place. Groundwater sampling campaigns performed between 1996 and 2014 indicate groundwater contamination by cyanide, inorganic compounds 25
(sulfate, ammonium, chloride, nitrite, and nitrate), BTEX, PAH and heavy metals.
3 The Vadose Zone Experimental setup (VZES)
The VZES integrates two different elements: a slanted borehole containing a VMS and vertical boreholes designed for cross-borehole geophysical measurements. A map showing the location of the VZES is shown in Fig. 1.
3.1 The Vadose Zone Monitoring System (VMS)
The VMS is designed to provide in situ continuous measurements of the hydraulic and chemical properties of the percolating water across the entire unsaturated zone, from land surface to the water table. Technical descriptions of the VMS structure, performance and installation procedures have been previously presented in other publications (Dahan et al., 2009, 2014; Rimon et al., 2011; Baram et al., 2012, 2013; Turkeltaub et al., 2014). To avoid overloading the present manuscript with 5
technical information, only a brief description is presented here. In general, the VMS allows attachment of customized monitoring units to the side wall of an uncased small-diameter (150 mm) slanted (35o) borehole. It is composed of a flexible sleeve hosting multiple monitoring units along its length in the desired distribution (Fig. 2). Slanted installation ensures that each monitoring unit faces an undisturbed sediment column that extends the monitoring unit to land surface. In the borehole, the flexible sleeve is filled with non-shrinking cement grout to ensure sleeve expansion for proper attachment of the 10
monitoring units to the borehole’s irregular walls, sealing its entire void and preventing potential preferential flow along the borehole.
Each monitoring unit has a flexible time domain reflectometry sensor (FTDR) for continuous measurements of sediment water content, and vadose zone sampling ports (VSPs) for frequent collection of pore water samples from the partially saturated sediments. The FTDR probes are based on the modification of Acclima TDT moisture sensor (Acclima) which was 15
adopted for operation with flexible wave-guides (Dahan, 2003). Each sensor was calibrated individually prior to the installation to ensure linear correlation to varying moisture content values (average R2 = 0.97). The volumetric water content, interpreted from the sediment permittivity, was measured and recorded on hourly base.
The VSP are made of customized flexible porous interface which allows creation of hydraulic continuity between the sediment pore-water and an inner sampling cell (Dahan, 2009). The physical mechanism that allows sampling the vadose 20
zone pore water by the VSP is similar to standard tensiometers (suction lysimeters). Nevertheless, its flexible structure allows its application in boreholes of irregular diameters or hard rocks.
3.2 Geophysical monitoring system
To complete the information provided by the VMS, a geophysical method is used to characterize the structure of the subsurface in different directions. This technique allows detection of heterogeneities in the subsurface and broadens the 25
covered area of the study site. In order to define the main lithological structures in the vadose zone of the study area, cross-hole ERT techniques are applied. Such methodology requires electrode arrays installed in two or more borecross-holes. The electrodes are supplied with a known electric current. Some electrodes act as current electrode dipoles and others as potential measuring dipoles (Daily et al., 1992; Binley et al., 2002). By measuring the potential differences between pairs of electrodes, electrical resistivity data can be inferred (Kearey et al., 2002). Subsequently, the data is processed and inverted. 30
As a result, a two dimensional image of the subsurface is obtained; such image can be used to detect subsurface heterogeneities (Slater et al., 2000).
The electrodes were assembled and prepared prior to drilling operations. A single electrode consists of a stainless steel ring attached to a PVC tube (Fig. 2). A cable is run up from the electrode to the surface (Slater et al., 2000). Four vertical boreholes were drilled on site with a length of 15 m each and an external diameter of 4 inches. Each of the four boreholes installed on site were equipped with 24 electrodes with a spacing of 0.60 m. Upon drilling of each borehole, a 2 inch diameter PVC tube containing the assembled electrodes was inserted in the borehole. Subsequently, the borehole was filled 5
with a mixture of 25 Kg of bentonite and 12.5 Kg of cement. Such proportion was chosen so that the resistivity values of the mixture would not differ significantly from the values of background resistivity (10-60 ohm.m).
The site was also equipped with additional piezometers installed for groundwater studies (Fig. 1). A meteorological station (WS-GP1, Delta Services Ltd) was installed 220m NW of the site to measure wind speed and direction, relative humidity, air temperature, rain and solar radiation on an hourly basis. CTD divers were installed in 4 piezometers with the aim of 10
monitoring groundwater levels.
4 Results and discussion
4.1 Lithological characterization of the vadose zone
Geophysical images are first used to characterize the main lithological structures and heterogeneities of the vadose and saturated zones (Fig. 3). Measurements were carried out in pairs of boreholes with a bipole-bipole array. Six tomographic 15
images were acquired between G1-G2-G3-G4, allowing subsurface imaging in different directions. Several areas are distinguished as a function of bulk electrical resistivity variations. The presence of more resistive areas around the boreholes indicates obvious artifacts produced by the borehole annular space filled with bentonite and cement (Deiana et al., 2011). However, such artifacts do not hinder the interpretation or imaging between boreholes, as it may occur when very saline water is present (Deiana et al., 2011). A geological log, as interpreted from borehole logging, is shown next to the 20
tomographic model and displays fair correlation in terms of lithological zonation. Six main units can be distinguished in the electrical tomographic images (separated by dashed lines in Fig. 3).
The upper backfilled area is characterized by low to middle resistivity values, caused by the presence of abundant pore spaces and fluids (Campbell and Bristow, 2009). The lateral extent of this layer is not continuous; when it is present, thicknesses vary from 0.5 to 1 m. Underneath, there is a heterogeneous layer of variable thickness and higher resistivities, 25
corresponding to silts and sands. With increasing depths, the presence of chalk materials becomes more evident and resistivities are lower. At a depth of 4 m, an abrupt change in resistivity is marked by the presence of an accumulation of silexes, which are highly resistive in contrast to the chalk. Such values are detected at the same depth ranges in all measured directions, indicating that it extends laterally. At the basis of the silex layer, clay is also present, as both deposits are produced from chalk dissolution (Laignel et al., 1998). The presence of clay and chalk materials from 5 to 11 m depth is 30
higher electrical conductivities (Al Hagrey et al., 2005). Increases in resistivity at 11 m depth are produced by the presence of marl layers. At the time of data acquisition, the groundwater table was located at 7 m below ground surface.
4.2 Infiltration processes
4.2.1 Water flow dynamics along the vadose zone profile
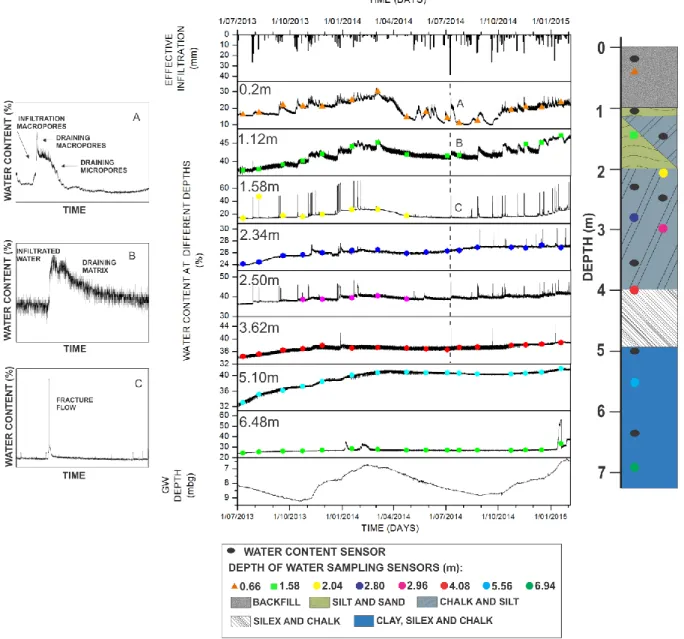
Continuous monitoring of the vadose zone shows temporal variations of water content which are mostly related to rain 5
events (Fig. 4). Infiltration of water across the vadose zone occurs through fast rises in rock water content, within a short delay with respect to infiltration episodes. The frequency and quantity of rainfall events control water content fluctuations over long term periods. However, on the first period that followed the VZES installation (July 2013-January 2014), such fluctuations might have been influenced by the disturbance effect of such installation. Changes in rock water content have almost an instantaneous response to rainfall events in upper part (0-1.58 m). Some of these fast water changes are observed 10
at greater depths (1.58-3.62 m). Water flow dynamics changes at higher depths (5.10 m), as no direct response to infiltration is observed and slow water content fluctuations prevail. A closer look at the wetting patterns indicates different types of reaction to rain events. Some of the sensors show a gradual wetting that is followed by long decrease in water content. This type of wetting pattern is typically related to micropore flow (Guebert and Gardner, 2000) or matrix flow (Rimon et al 2007; Dahan et al 2008). On the other hand some sensors indicate quick rises in water content which are followed by an instant 15
decrease. These are clear indications for preferential flow in the fracture network (Dahan et all 1999; Baram et al 2012). As rainfall percolates through the upper and intermediate part of the vadose zone, distinctive water content profiles are registered according to lithology, providing information about water flow mechanisms through different materials. A clear example of such patterns is observed during the percolation event on 09 July 2014 (indicated by a vertical dotted line in Fig. 4) where a high infiltration episode occurred during a low recharge period, generating almost instantaneous changes in water 20
contents up to 3.62 m depth.
During this event, water content increases instantaneously in the backfill (0.2 m). At this moment, water infiltrates through the backfill macropores and is transmitted through connected voids under the effect of gravitational forces. After rainfall stops, drainage occurs in two steps. During the first phase, there is a fast decline in water content due to macropore drainage. In the second phase, water decreases gradually as smaller pores are draining (Guebert and Gardner, 2000), as can been seen 25
by the water content decay at 0.2 m.
In the silts (1.12 m), a fast increase in water content is also registered. Such rapid change is indicative of preferential flow, where water is transmitted to underlying materials by gravity forces (Gerke et al., 2010, Baram et al., 2012). However, not all the water is infiltrated via preferential flow. During the percolation episode, matrix pores are also filled with water. Once the rainfall event stops, water content decreases gradually. Such slow transition occurs as water drains from the matrix pores. 30
The effect of the rain episode in the silts and chalk (1.58-3.62 m) is expressed in the form of sharp changes in rock water content. Water transmission to underlying materials occurs almost instantly, as indicated by the short delay between water
arrival and drainage. The absence of gradual water content variations during drainage implies that most of the matrix is bypassed as a consequence of preferential flow.
Below the layer of silex (5.01 m), matrix flow is predominant, as reflected by gradual changes in rock water content over time. The low hydraulic conductivity of clays might buffer the transmission of infiltrated water to underlying levels. At 6.48 m, increases in water content are registered during periods of high groundwater elevation. This trend implies that the zone is 5
temporary influenced by the capillary fringe area, and eventually reaches saturation.
4.2.2 Influence of geology and spatial variability on water flow dynamics
Given the information provided by the VMS setup on water flow dynamics in the vertical direction, it is clear that the flow mechanisms are strongly influenced by the type of lithology in the subsurface. Such relationship has been already demonstrated by e.g. Gates et al. (2014), where lithologic influences on recharge rates were observed during field 10
experiments performed at local and regional scales. The spatial distribution of geological materials observed from geophysical imaging allows identifying which water flow mechanisms are likely to occur during infiltration episodes. Tomographic images of the vadose zone taken in different directions reveal a heterogeneous distribution of deposits across the first 4 m of the vadose zone (Fig. 5). In the NW-SE direction (G1-G2 and G3-G4), the presence of backfill and sandy materials is significant, as reflected by intermediate resistivity values. Such distribution is also observed in the E-W direction 15
(G3-G2). Therefore, macropore, micropore and matrix flow are likely to be the main water flow mechanisms during infiltration episodes. However, such deposits are not as present in the NE-SE direction (G2-G4 and G3-G1) and in the N-S direction (G1-G4). Instead, low resistivity values are registered, which are caused by the dominance of chalk over silt deposits. Such low values might be caused by the presence of fractures and wet materials from preferential flow mechanisms.
20
4.3 Hydrochemistry of water across the vadose zone
Water samples from the vadose zone were obtained periodically at different depths and analyzed for major elements by capillary electrophoresis. Temporal evolution of Na+, SO42- as Ca2+ was assessed, as they were detected systematically.
HCO3- is monitored as well, as it is dominant in shallow groundwater (Deutsch, 1997) (Fig. 6). The first period (July 2013-
January 2014) is characterized by anomalous fluctuations in ion concentrations. At this time, the vadose zone was still 25
disturbed by the installation of the experimental setup. During the second period (March 2014-January 2015) the chemistry across the vadose zone evolves towards more constant concentrations over time. At this time it is considered that the vadose zone had returned to natural conditions. Results and discussion will focus on this latter period.
Continuous monitoring of the chemistry of vadose zone waters indicates a chemical evolution that is influenced by flow mechanisms, rock water interactions and recharge conditions.
30
In the upper part of the vadose zone (down to 1.58 m), calcium-magnesium-bicarbonate facies is dominant (Fig. 6a). Such chemical composition is typical of recharge conditions, where meteoric water interacts with soil components (Hall and Turk,
1975; Ophori and Tóth, 1988). In this area, water is not highly mineralized, as the soil is continuously washed out by successive infiltration episodes. However, during low recharge periods, the chemistry of water within the matrix pore might change, as observed in April and July 2014 (Fig. 6a and 6b). The residence time of water is higher, allowing the possibility of ion exchanges within the matrix.
The chemistry of water at greater depths of the vadose zone is controlled by water flow mechanisms. If preferential flow 5
mechanisms are dominant, chemistry remains typical of recharge waters. This is the case of water sampled at 2.04 and 2.96 m (Fig.6b). However, if water flows through the matrix, chemical facies are no longer controlled by recharge waters: instead, calcium-magnesium chloride-sulfate facies are dominant (Fig. 6b and 6c). This chemical composition is typical of waters with long residence times (Macpershon and Townsend, 1998) as they are held in matrix pores. At this point, a change in the chemistry is reflected by an increase in SO42- concentrations. Such change might be a consequence of reactive
10
processes occurring across the vadose zone. In order to understand which minerals might be present and reactive across the vadose zone, mineral saturation indexes (SI) are calculated with the following Eq. (Deutsch, 1997):
𝑆𝐼 = 𝑙𝑜𝑔10 (𝐼𝐴𝑃 𝐾⁄ 𝑚𝑖𝑛𝑒𝑟𝑎𝑙) (1)
15
Where 𝐼𝐴𝑃 is the ion activity product and 𝐾𝑚𝑖𝑛𝑒𝑟𝑎𝑙 is the equilibrium constant of a mineral. It is considered that the mineral
is likely to be present when SI ranges between -0.5 and 0.5. While such calculations cannot confirm if the mineral is actually present, they can indicate if such mineral would have a tendency to precipitate or to be dissolved, if present (Carlsson et al, 2003). Results from calculations show that saturation indexes of sulfate minerals (gypsum) increase from 2.98 m depth, indicating SO42- production (Fig. 7). While gypsum has not been found in soil and core samples, sulfide minerals such as
20
pyrite are present, especially in the backfill. When pyrite is oxidized, the primary effect of pyrite oxidation is an increase of SO42- concentrations (Larsen and Postma, 1997). Therefore, it is likely that the production of SO42- from 2.98 m to greater
depths is a consequence of pyrite oxidation and leaching through the vadose zone.
4.4 Heavy metal contamination in the vadose zone
Previous to installation of the VMS, soil and groundwater sampling campaigns were carried out for preliminary studies. 25
Heavy metals such as As, Cd, Cr, Co, Cu, Hg, Ni, Pb and Zn were analyzed. In the soil, concentrations over background values were found for all analyzed metals except for Co and Pb, which were not observed. In groundwater, As, Cr and Cd reached concentrations over background values, whereas Ni was found in higher concentrations (exceeding threshold values).
Based on results from preliminary studies, total concentrations of Ni, As, Cd and Cr were analyzed in samples collected from 30
the VMS by inductively coupled plasma (ICP). Due to the limited availability of pore water volumes in certain zones of the vadose zone profile, analysis were made on samples retrieved at three depths (0.66, 2.80 and 6.94 m). From the selected
metals, Ni is the only one detected systematically, at concentrations often exceeding threshold values. Therefore, it is assumed that As, Cr and Cd are sorbed in soil, whereas water across the vadose zone is polluted with Ni.
From September to December 2013, high concentrations of Ni were registered in the backfill (Fig. 8). This is the first recharge period that followed the VMS installation. Ni percolation across the vadose zone is reflected by a sequential increase of concentrations at 2.80 and 6.94 m depth. The release of Ni through the vadose zone might be related with 5
oxidation of pyrite from the backfill (Dold, 2010). While pyrite oxidization results in an increase of SO42- concentrations, it
might also produce a major source of metal contamination (Dold et al., 2009). The correlated patterns observed for SO42- and
Ni in Fig. 8 at shallow depths might be indicative of pyrite oxidation and leaching across the vadose zone. At 6.96m, Ni concentrations fluctuate in relation to variations in groundwater depth. A negative correlation between Ni concentrations and groundwater depths is observed, indicating Ni dilution in groundwater.
10
5 Conclusions and perspectives
Flow dynamics in the upper and intermediate part of the vadose zone (down to 3.62 m) is reflected through quick rises in water content as a response to rainfall events. Water infiltration occurs through different flow mechanisms according to the type of material in the subsurface. Macro and micropore flows are dominant in the backfill, whereas matrix flow prevails in sand and silt deposits. Fast infiltration of water through chalk occurs via preferential flow. The lower part of the vadose zone 15
(5-6.48) is characterized by slow flow dynamics and matrix flow. Capillary effects are observed at 6.48m.
The presence of backfill, sand and silt deposits is dominant in the NW-SE and E-W directions, as detected by geophysical imaging. Therefore, macro, micro and matrix flows are more likely to be dominant in these directions. The lower resistivities registered in the NE-SE and N-S directions are indicative of fractured chalk, indicating that preferential flow prevails. The chemical composition of waters sampled in the upper part of the vadose zone (up to 1.58 m) is typical of recharge 20
conditions (calcium-magnesium-bicarbonate facies). At higher depths, such chemistry prevails if preferential flow mechanisms are dominant. However, water flowing through the matrix have longer residence times, resulting in a shift in chemical composition towards calcium- magnesium chloride-sulfate facies. Data from sampled waters revealed that only Ni is being transported through the vadose zone and its transport might be related with pyrite oxidation coming from backfilled materials in the surface.
25
The significant differences in water flow and chemistry encountered at different depths and directions in the vadose zone are clearly influenced by heterogeneity. Understanding spatial variability of the subsurface is essential, as it affects the transport and times of residence of certain contaminants. Therefore, based on the results from the studies, it can be concluded that the implementation of the VZES could be a useful tool to improve protection and remediation plans for soil and groundwater, as the information that it provides can significantly contribute to the development of more detailed site conceptual models. 30
References
Acclima: http://acclima.com/wd/index.php?option=com_content&view=article&id=11&Itemid=9, last access: 6 February 2016
Amiaz, Y., Sorek, S., Enzel, Y., and Dahan, O.: Solute transport in the vadose zone and groundwater during flash floods, Water Resour. Res., 47, W10513, doi: 10.1029/2011WR010747, 2011.
5
Arora, T., and Ahmed, S.: Characterization of recharge through complex vadose zone of a granitic aquifer by time-lapse electrical resistivity tomography, J. Appl. Geophys., 73, 35–44, 2011
Bakr, A. A., Gelhar, L. W., Gutjahr A. L., and MacMillan, J. R.: Stochastic analysis of spatial variability in subsurface flows, 1, Comparison of one- and three-dimensional flows, Water Resour. Res., 14 (2), 263–272, 1978.
Baram, S., Kurtzman, D., and Dahan, O.: Water percolation through a clayey vadose zone, J. Hydrol., 424–425, 165–171, 10
2012.
Baram, S., Z. Ronen, D. Kurtzman, C. Kulls, and Dahan, O.: Desiccation-crack-induced salinization in deep clay sediment, Hydrol. Earth Syst. Sci., 17, 1533–1545, doi: 10.5194/hess-17-1533-2013.
Barker, J. A., and Wright, T. E.: A pulsed-velocity method of double-porosity solute transport modelling. In: Tracers and Modelling in Hydrogeology, IAHS Publ. no. 262, 2000.
15
Binley, A., Cassiani, G., Middleton, R., and Winship, P. : Vadose zone model parameterisation using cross-borehole radar and resistivity imaging, J. Hydrol, 267, 147–159, 2002.
Blonquist, J. M., Jones, Jr., S. B., and Robinson, D. A.: A time domain transmission sensor with TDR performance characteristics, J. Hydrol., 314, 235–245, 2005.
Boadu, F. K., Gyamfi, J. and Owusu, E.: Determining subsurface fracture characteristics from azimuthal resistivity surveys: 20
A case study at Nsawam, Ghana, Geophysics, 70, 35–42, 2005
Brouyère S., Dassargues A., and Hallet, V.: Migration of contaminants through the unsaturated zone overlying the Hesbaye chalky aquifer in Belgium: a field investigation, J Cont. Hydrol., 72, 135–164, 2004.
Burns, H. H., Wyatt, D., Maryak, M. , Butcher, T. , Cook, J., Looney, B., Rossabi, J., and Young, M.:, The Savannah River Site Vadose Zone Monitoring System, Proceedings of the Waste Management Symposia, Inc. (WM’00) , Tucson, 25
Arizona, February 27-March 2, 13 pp., 2000.
Campbell, G. S., and Bristow, K. L.: The Effect of Soil Thermal Resistivity (RHO) on Underground Power Cable Installations, Application Note, Decagon Devices, 4 pp., 2009.
Carlsson, E., Öhlander, B., Holmström, H.: Geochemistry of the infiltrating water in the vadose zone of a remediated tailings impoundment, Kristineberg mine, northern Sweden, Appl. Geochem., 18, 659–674, 2003.
30
Dahan, O., McDonald, E. and Young, M.: Development of a flexible TDR probe for deep vadose zone monitoring, Vadose Zone J., 2: 270–275, 2003
Dahan, O., Shani, Y., Enzel, Y., Yechieli, Y., and Yakirevich, A.: Direct measurements of floodwater infiltration into shallow alluvial aquifers, J. Hydrol., 344, 157-170. doi:10.1016/j.jhydrol.2007.06.033, 2007.
Dahan, O., Talby, R., Yechieli, Y., Adar, E., Lazarovitch, N., and Enzel, Y.: In-situ monitoring of water percolation in layered soils using a vadose-zone monitoring system. Vadose Zone J., 8, 916-925, 2009
Dahan, O., Babad, A., Lazarovitch, N., Russak, E. E., and Kurtzman, D.: Nitrate leaching from intensive organic farms to 5
groundwater, Hydrol. Earth Syst. Sci., 18, 333–341, doi:10.5194/hess-18-333-2014, 2014.
Daily, W. D., and Owen, E.: Cross-borehole Resistivity Tomography, Geophysics, 56, 1228-1235, 1991.
Daily, W., Ramirez, A., LaBrecque, D., Nitao, J.: Electrical resistivity tomography of vadose water movement, Water Resour. Res., 28, 14291442, 1992.
Daniels J.J., Allred B., Binley A., Labrecque, D., Alumbaugh, D.: Hydrogeophysical case studies in the Vadose zone, in 10
Hydrogeophysics, Rubbin, Y and Hubbard, SS., Springer, Netherlands, pp. 413-440, 2005.
Dassargues, A., Monjoie A.: Chalk as an aquifer in Belgium, in: Hydrogeology of the chalk of North-West Europe, Oxford University Press, Oxford, United Kingdom, pp. 153–169, 1993.
Deiana R., Cassiani, G. , Deidda, G.P., Mura, M., Schirru, F and Perri, M.T.: Cross-hole electrical resistivity tomography under extreme electrical resistivity conditions, in: 30° convegno nazionale Gruppo Nazionale di Geofisica della Terra Solida, 15
Trieste, Italy, 14-17 november 2011, p. 491–495, 2011.
Deutsch, W.J: Groundwater Geochemistry: Fundamentals and Application to Contamination, Lewis Publishers, New York, USA, 221 pp., 1997.
Dold, B., Wade, C., and Fontboté, L.: Water management for acid mine drainage control at the polymetallic Zn-Pb-(Ag-Bi-Cu) deposit of Cerro de Pasco, Peru, J. of Geochem. Explor., 100, 133–141, 2009.
20
Dold, B.: Basic Concepts in Environmental Geochemistry of Sulfidic Mine-Waste Management, in: Waste Management, Er Sunil Kumar (Eds.), InTech, 173-198, 2010.
Faculté Polytechnique de Mons (FPMS), 2000. Etude de la pollution des aquifères du bassin de Mons en aval du site Carbochimique à Tertre, Ministère de la Région Wallonne, DGRNE, 53 pp., 2000.
Faybishenko, B., Doughty, C., Steiger, M., Long, J.C.S., Wood, T.R., Jacobsen, J.S., Lore, J. and Zawislanski, P.T.: 25
Conceptual model of the geometry and physics of water flow in a fractured basalt vadose zone. Water Resour. Res. 36, 3499–3520: doi: 10.1029/2000WR900144, 2000.
Flint, A. L., and Flint, L. E.: Near surface infiltration monitoring using neutron moisture logging, Yucca Mountain, Nevada, in: Vadose Zone Science and Technology Solutions, B. B. Looney and R. W. Falta (Eds.), Battelle, Columbus, Ohio, USA, pp. 457– 474, 2000.
30
Gates J.B., Steele G.V., Nasta P., Szilagyi J.: Lithologic influences on groundwater recharge through incised glacial till from profile to regional scales: evidence from glaciated Eastern Nebraska, Water Resour. Res., 50, 466–481, 2014.
Gee, G.W., Ward, L. A., Sisson, J. B., Hubbell, J. M., Myers, D. A., and Sydnor, H. A., Hydrologic characterization using vadose zone monitoring tools: Status report, Pacific Northwest National Laboratory, Richland, Washington, U.S.A, 63 pp., 2003.
Gerke HH., German P., and Nieber J.: Preferential flow: from pore to the catchment scale, Vadose Zone J., 9, 207–212, 2010.
5
Guebert, M.D. and Gardner, T.W.: Macropore flow on a reclaimed surface mine: Infiltration and hillslope hydrology, Geomorphology, 39, 151–169, 2001.
Al Hagrey, S. A., and Michaelsen, J.: Resistivity and percolation study of preferential flow in vadose zone at Bokhorst, Germany, Geophysics 64, 746-753, 1999.
Hall W. D., and Turk L.J.: Aquifer evaluation using depositional systems: an example in north-central Texas, Ground Water, 10
13, 472–83, 1975.
Hubbell, J.M., Mattson, E.D., Sisson, J.B. and Mgnuson, S.O.: Understanding fluid and contaminant movement in the unsaturated zone using the INNEEL vadose zone monitoring system, in: Proceedings of the Waste Management Symposia, Inc. (WM’02), Tucson, Arizona, USA, February 24-28, 13 pp., 2000.
Kearey, P., Brooks, M. and Hill, I.: An Introduction to Geophysical Exploration, 3rd ed. Blackwell Science, Oxford, United 15
Kingdom, 262 pp., 2002.
Laignel B., Quesnel F., Macaire J.J., Meyer R. : Relations quantitatives entre les craies à silex et les formations résiduelles à silex de l’ouest du Bassin de Paris, Acta Geodyn., 11,171–181, 1998.
Larsen, F., and Postma, D.: Nickel mobilization in a groundwater well field: release by pyrite oxidation and desorption from manganese oxides, Environ. Sci. Technol., 31, 2589–2595, 1997.
20
Macpherson, G. L. and Townsend, M. A.: Water chemistry and sustainable yield, in: Perspectives on Sustainable Development of Water Resources in Kansas, Bulletin 239, Kansas Geological Survey, Kansas, USA, 239 pp., 1998.
Marlière R.: Carte géologique de la Belgique à l'échelle 1:25 000 N°139, Beloeil-Baudour, Service géologique de Belgique, Belgium, 1977.
Ophori, D.U. and Tóth, J.: A study of groundwater resources development and management in Ross Creek Basin, Alberta. 25
Final Report., Alberta Environment, Lethbridge, Canada, 112 pp., 1986.
Or, D., Tuller, M., and Stothoff, S.: Review of Vadose Zone Measurement and Monitoring Tools for Yucca Mountain Performance Confirmation Program, U.S. Nuclear Regulatory Commission, Washington D.C., USA, 110pp., 2006.
Perri, M. T., Cassiani, G., Gervasio, I., Deiana, R., and Binley, A. M.: A saline tracer test monitored via both surface and cross-borehole electrical resistivity tomography: comparison of time-lapse results, J. Appl. Geophys., 79, 6–16, 30
doi:10.1016/j.jappgeo.2011.12.011, 2012
Rimon, Y., Dahan, O., Nativ, R. and Geyer, S.: Water percolation through the deep vadose zone and groundwater recharge: preliminary results based on a new vadose-zone monitoring system, Water Resour. Res., 43, W05402, doi:10.1029/2006WR004855 , 2007.
Rimon, Y., Nativ, R., and Dahan, O.:Physical and chemical evidence for pore-scale dual-domain flow in the vadose zone, Vadose Zone J., 10, 322–331, 2011.
Robert T., Caterina D., Deceuster J., Kaufmann O. and Nguyen F.: A salt tracer test monitored with surface ERT to detect preferential flow and transport paths in fractured/karstified limestones, Geophysics 77, 55–67, 2012
Samouëlian, A., Cousin, I., Tabbagh, A., Bruand, A. and Richard, G.: Electrical resistivity survey in soil science: a review, 5
Soil Till. Res., 83, 173–193, 2005.
Slater, L.D., Binley, A.M., Daily, W., and Johnson, R.: Cross-hole electrical imaging of a controlled saline tracer injection, J. Appl. Geophys., 44, 85–102, 2000.
Société Publique d’Aide à la Qualité de l’Environnement de la Région wallonne (SPaQuE), Rapport Annuel 2008, Belgium, 115 pp., 2008.
10
Turkeltaub, T., Kurtzman, D., Bel, G., and Dahan, O.: Examination of groundwater recharge with a calibrated/validated flow model of the deep vadose zone, J. Hydrol., 522, 618–627, doi:10.1016/j.jhydrol.2015.01.026, 2015.
West, L. J., and Truss, S.W.: Borehole time domain reflectometry in layered sandstone: Impact of measurement technique on vadose zone process identification, J. Hydrol., 319, pp.143-162, 2006.
15
Figure 1: Location of the study site, along with the regional geology and hydrogeology of the site. A map with the location of geophysical boreholes from the VZES is also presented.
Figure 2: Schematic concept of the Vadose Zone Experimental Setup (VZES). A Vadose Zone Monitoring System (VMS) is installed in a slanted borehole with Vadose Sampling Ports (VSP) and Flexible Time Domain Reflectometry probes (FTDR) attached to the walls of a flexible sleeve. The geophysical setup consists of stainless steel electrodes installed in vertical boreholes. The figure is not to scale.
5
Figure 3: Resistivity images obtained from in-situ measurements and correlation with the lithologies of the subsurface. A logarithmic scale was chosen to represent resistivity values as opposed to a linear scale, as the image is visually clearer. Retrieval of geophysical images was carried out on 03 March 2014.
Figure 4: Water contents registered at different depths of the vadose zone. The upper diagram represents the daily effective infiltration and the lower diagram the groundwater depth. Points represent sampling times carried out from sampling sensors located below corresponding water sensors. The signal from the water content sensor located at 2.34 m was smoothed, as noise was present. The three graphs located on the left show a magnified view of infiltration patterns (indicated by letters A, B, C in the main 5
Figure 5: Tomographic images of the vadose zone retrieved at different directions of the study site. According to lithological distribution, different types of water flow mechanisms are likely to occur during infiltration episodes.
Figure 6: Evolution of Na+, SO42- , Ca2+ and HCO3- through different depths of the vadose zone. The upper diagram represents the
daily and monthly effective infiltration and the lower diagram the groundwater depth. The diagram is separated in two parts by the dashed line, indicating natural conditions (right) and disturbed conditions (left). Piper diagrams show the chemical evolution of vadose zone waters under natural conditions. Chemical information of waters at 2.04 and 2.96 m is not shown from May 2014, 5
Figure 7: Saturation index of gypsum at different times. It is considered that the mineral is present when SI ranges between -0.5 to 0.5 ranges.
Figure 8: Ni and SO42- concentrations at 0.66. 2.80 and 6.94 m. The upper diagram represents the daily and monthly effective
5
infiltration and the lower diagram the groundwater depth. Note that Ni concentrations are expressed in µg/l and SO4