CLASSIFICATION AND INTEGRATION OF MASSIVE 3D POINTS CLOUDS IN A
VIRTUAL REALITY (VR) ENVIRONMENT
A.Kharroubi 1, R.Hajji 1, R.Billen 2, F.Poux 2, *
1 Geomatics and Surveying Engineering school, Hassan 2 Agronomic and Veterinary Institute, Rabat, Morocco 2 Geomatics Unit, University of Liège, 4000 Liège, Belgium - fpoux @uliege.be
Commission II
KEY WORDS: Virtual reality, 3D Point cloud, Segmentation, Classification, Spatial Indexation, Octree data structure
ABSTRACT:
With the increasing volume of 3D applications using immersive technologies such as virtual, augmented and mixed reality, it is very interesting to create better ways to integrate unstructured 3D data such as point clouds as a source of data. Indeed, this can lead to an efficient workflow from 3D capture to 3D immersive environment creation without the need to derive 3D model, and lengthy optimization pipelines. In this paper, the main focus is on the direct classification and integration of massive 3D point clouds in a virtual reality (VR) environment. The emphasis is put on leveraging open-source frameworks for an easy replication of the findings. First, we develop a semi-automatic segmentation approach to provide semantic descriptors (mainly classes) to groups of points. We then build an octree data structure leveraged through out-of-core algorithms to load in real time and continuously only the points that are in the VR user's field of view. Then, we provide an open-source solution using Unity with a user interface for VR point cloud interaction and visualisation. Finally, we provide a full semantic VR data integration enhanced through developed shaders for future spatio-semantic queries. We tested our approach on several datasets of which a point cloud composed of 2.3 billion points, representing the heritage site of the castle of Jehay (Belgium). The results underline the efficiency and performance of the solution for visualizing classifieds massive point clouds in virtual environments with more than 100 frame per second.
1. INTRODUCTION
The use of laser scanners and photogrammetric reconstruction methods, coupled with the development of processing algorithms and the increase of computational power have led to the creation of massive point cloud data sets (Scheiblauer et al., 2014). In addition to position information, the laser scanner data is enhanced through different attributes (e.g. colour information for each point) which can be used through different point cloud rendering algorithms (Mures et al., 2016). Very interestingly, point cloud can be enhanced by integrating semantics (Poux, 2019; Poux et al., 2016a) through intelligent processes such as those based on semantic segmentation (Poux and Billen, 2019a). In this article, we will investigate the use of semantics for interaction and rendering purposes for highly immersive applications and decision-making. We will focus on low cost and open source solutions for better integrating semantically rich 3D point clouds in Virtual reality (VR) environments.
In several fields such as architecture, archaeology and cultural heritage, the production of 3D models representing a physical reality in a detailed and fast manner has gain a lot of attention. Indeed, through the application of new 3D visualization methods, one can visualize and manipulate virtual objects of interest in a virtual environment. As highlighted by (Mures et al., 2016; Whyte, 2018), these interactive renderings permit among other to see and control the progress and the quality of the work done on the worksite. It also allows archaeologists and curators to analyze archaeological and heritage sites remotely, also usable for teaching and training purposes. Also, architects can control the state of buildings and extract information for the exploitation and updating of their digital models. The immersive dimension in visualization techniques replaces the real environment with a
* Corresponding author
complete virtual one using a headset (VR) or a Cave Automatic Virtual Environment (CAVE), which permits the user to interact with objects without the limitations that the real world represents. In addition, visualization on a two-dimensional screen gives less immersion effect and less realism of the acquired environment. The current integration state of point cloud data in VR set-ups is very low, often needing data derivation through lengthy optimization pipeline to obtain coherent 3D models with multiple levels of Details (LoD) (Nebiker et al., 2010). Given their large volume and their discrete nature, visualization and 3D rendering is a great challenge, especially in terms of storage and processing capabilities (Scheiblauer et al., 2014). On top, to our knowledge, there is no work done on exploring the integration of semantics in VR environments to extend the possibilities by using both spatial and semantic attributes (Poux et al., 2016a; Poux and Billen, 2019b).
In order to structure semantics, we first provide a semi-automatic point cloud segmentation and classification (2) using solely Cloud Compare (CloudCompare, 2019). Then, after indexing and structuring the data into a coherent Octree structure (Schuetz, 2016), we implement the solution (3) under the Game Engine Unity (Unity, 2018) for loading and visualizing the results of classification. Finally, the application is deployed for immersive visualization with the Oculus rift VR headset (Oculus, 2019). At the end, performance tests are performed based on multiple criteria such as memory consumption and the number of frames per second (4). We finally provide several perspectives for future work (5).
The International Archives of the Photogrammetry, Remote Sensing and Spatial Information Sciences, Volume XLII-2/W17, 2019 6th International Workshop LowCost 3D – Sensors, Algorithms, Applications, 2–3 December 2019, Strasbourg, France
2. POINT CLOUD SEGMENTATION AND CLASSIFICATION
In this section, we first present the datasets and acquisition specificities (2.1). Then, we present a semi-automatic workflow (2.2) & (2.3) for classifying different datasets. Finally, we address the hierarchical structuration of the data (2.4).
2.1 3D point cloud data specificities
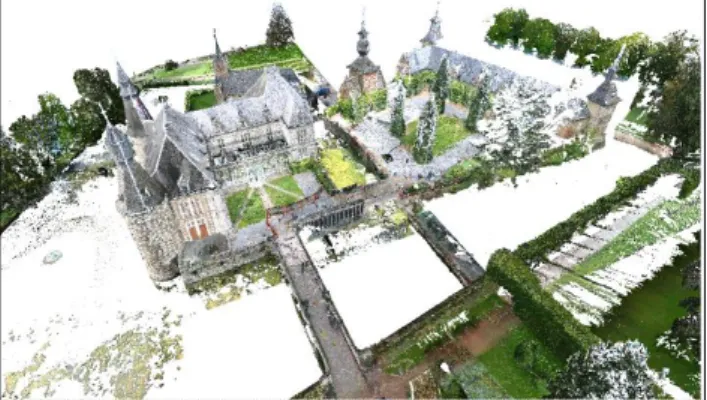
In addition to the point clouds acquired on site (Jehay Castle, (Poux et al., 2016b), Figure 1), we processed several points cloud (Table 1) from different sensors such as NavVIS M6 (NavVIS, 2019), GeoSLAM ZEB REVO (GeoSLAM, 2019), Structure From Motion(SfM) and terrestrial laser scanner(TLS) Leica P30 (Leica, 2019). Seven point cloud datasets were used and the purpose of this diversity is to test the influence of adding/lacking information (RGB, intensity) on the difficulty of segmentation especially when this operation is assisted by an operator. The second goal is to test the solution developed on several point clouds with variable sizes ranging from small to large number of points per cloud. The third goal is to create labelled datasets that can be used as training data and deep learning algorithms for semantic segmentation for the scientific community.
Figure 1. Point cloud of Jehay castle with approximately 3 billion points.
Id Points number Attribute sensor Size Go 1 2.300.247.428 RGB, intensity Leica P30 69.636 2 312.710.687 RGB, intensity TLS 4,907 3 259.101.028 RGB, intensity TLS 4,807 4 115.190.236 RGB, intensity TLS 3,824 5 44.847.540 RGB NavVIS 0,657 6 53.800.194 without REVO 0,630 7 4.244.416 RGB NavVIS 0,062
Table 1. Different points clouds to segment. 2.2 Segmentation
Segmentation is a crucial step for the introduction of semantic information on the physical objects contained in the point cloud. Shi Pu and George Vosselman, (2006) define it as a “the process of labeling each point of the point cloud, so that these points belonging to a particular surface or region, have the same label”.
The segmentation is done under CloudCompare software (CloudCompare, 2019). We started by segmenting the point cloud into subspaces as defined in (F. Poux et al., 2017) (e.g. rooms for building), then segmenting each subspace into smaller significant segments corresponding to classes (walls, doors, windows, chairs, offices, closets, etc.) as in Figure 2. The segmentation is done semi-automatically with the selection tools available on CloudCompare, assisted by the following automatic plugins:
• RANSAC Shape Detection: based on an automatic shape detection algorithm as proposed by (Wahl and Klein, 2007). It can detect geometric shapes, planes, spheres, cylinders, cones, and tori.
• CSF: is a tool used to separate ground points from the rest of the point cloud, based on the cloth simulation filter developed by (Zhang et al., 2016)
• Histogram filtering: filters the points of the selected cloud according to their associated scalar value (e.g. the Z value). A new cloud is created with points in the specified range.
• Label Connected Components: this tool segments the selected cloud(s) into smaller parts separated by a minimum distance. • CANUPO: it allows to create classifiers (by forming them on small samples) and / or to apply a classifier at the same time on a cloud of points in order to separate it in two subsets. It also generates a classification trust value for each point to quickly identify cases that are classification problems or misclassification (usually at the class boundaries).
(a)
(b)
The International Archives of the Photogrammetry, Remote Sensing and Spatial Information Sciences, Volume XLII-2/W17, 2019 6th International Workshop LowCost 3D – Sensors, Algorithms, Applications, 2–3 December 2019, Strasbourg, France
(c)
Figure 2. Multi scale segmentation :(a) raw point cloud ;(b) The point cloud segmented into a subspaces ;(c) Subspace
segmented into several smaller elements. 2.3 Classification
In this step, we assign for each created segment a specific class pointer. First, a classification list is established regrouping several indoor classes and outdoor classes that holds a great potential for several applications (Table 2). Then, a new scalar field with a constant integer value is created named "Classification", in order to respect the specifications of the export format which is the “.las” format. This point cloud format supports this attribute by default. A class number is assigned to this created classification field.
Indoor Outdoor
class number class number
0 Floor 40 LowVegetation 1 Ceiling 41 Human 2 Wall 42 Pole 3 Beam 43 LightingPole … … … … 24 Poster 50 Roof
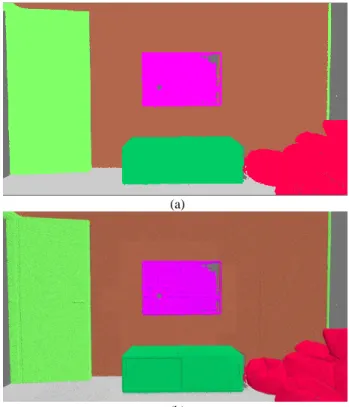
Table 2. An extract from the list of established classes. Finally, any object in the point cloud has its corresponding class information (Figure 3), and the point cloud is exported in “.las” format or its compressed one “.laz”
Figure 3. Classification results: a piece with different objects and their labels.
2.4 Structuration in a Potree’s octree structure
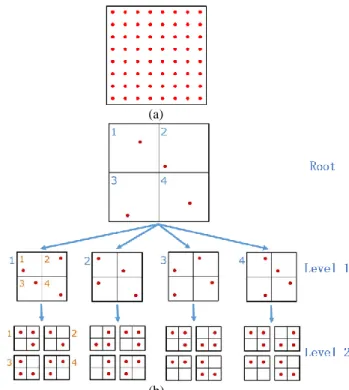
The main purpose of a data structure is to permit an easier/better access to the underlying data. As such, we orient ourselves by spatially indexing massive point clouds based on a Potree’s octree data structure for real time purposes. Potree uses a variation of the modifiable nested octree structure with a different subsampling method and a partition of the hierarchy into smaller, quickly streamable, chunks. The point cloud is iteratively subdivided into eight cubic parts (nodes in a tree) by starting from an initial "Bounding Cube" with an initial spacing. Then each part is subdivided in the same way and the spacing is halved to increase the density. The resolution of a node is defined by the spacing property, which specifies the minimum distance between points. Thus, as the depth of the tree increases, the spacing decreases and the level of detail increases, as shown in Figure 4. This step is done based on Potree Converter 1.6 (Potree, 2019). To have a structured point cloud in a Potree format, we take into account desired attributes being classification and intensity, which are kept during the on-disk structuring.
(a)
(b)
Figure 4. Potree’s octree structure explained in 2D: (a) Raw data; (b) the octree structure with a root with subsampling point
and level 1 and level 2.
3. APPLICATION IN VIRTUAL REALITY This rendering system was developed and implemented in C # under the Game Engine Unity version 2018.4.1f1, based on the scripts developed as part of Simon Maximilian Fraiss bachelor's thesis (Fraiss, 2017), entitled "Rendering Large Points Cloud in Unity".
3.1 Point cloud loading
The rendering of objects in Unity (Unity, 2018) is done by creating one or several GameObjects for each object to render. For each node of the structured point cloud that must be visible, one or more GameObjects must be created with an appropriate Mesh Filter and a Renderer Filter. For each node of the Octree that we want to display, we use a GameObject. If the node has The International Archives of the Photogrammetry, Remote Sensing and Spatial Information Sciences, Volume XLII-2/W17, 2019
more than 65,000 vertices as specified by Unity, several GameObjects are needed.
The loading process uses three threads: the Unity main thread, a traversing thread, and a loading thread. In the main thread, visible GameObjects are updated once per image if any necessary changes have been detected in the traversing thread. Game objects are created for Octree nodes that should be visible and do not yet have game objects, nodes that should no longer be visible have their game objects removed. Determining which node the game objects should be created or deleted is the job of the traversing thread. The loading thread is used to load point data from files (Fraiss, 2017).
(a)
(b)
Figure 5. The nodes in front of the camera (in white) are rendered in more detail than those partially in the view: (a)
original point cloud, (b) after classification.
A Least Recently Used Cache (LRU) was implemented in order to keep the memory usage below a certain threshold. The cache has a maximum number of points it can store and if this threshold is breached, the points of the least recently used node are removed from memory.
3.2 Point rendering
To give a more realistic look to the point cloud, different point rendering techniques have been implemented based on the work of (Fraiss, 2017). No lighting model has been implemented because the test data sets do not contain normals, and has been colored using photos presenting static lightning. But with the addition of the classification (each class represented with one different color), the point cloud no longer has a realistic aspect of 3D and depth such as in Figure 7.a. Thus, the creation of a shader to enhance the depth perception of a scene and to make the results look more pleasant is necessary.
This improvement in visual appearance is shown in Figures 6 and Figure 7.
The principle of this shader is simple, it consists in creating an effect like the Eye-Dome lighting (Boucheny and Ribes, 2017) by representing each point in the form of a square or circle, then assigning a black color to a corner (bottom left). In our case of square or circle rendering, it results as presented in figure 6:
(a) (b)
Figure 6. Principle of the implemented shader: (a) shown with the square shape, (b) and a circle.
To manage occlusion situations between points, Schütz and Wimmer,(2016) have developed a method that creates an interpolation of nearest neighbor type points (Scheiblauer and Wimmer, 2011; Schuetz, 2016). To do this, the points are represented in the form of 3D shapes, such as cones, spheres or paraboloids, facing the screen, instead of simple squares. In this work, interpolations with cones and paraboloids have been implemented.
(a)
(b)
Figure 7. Classified point cloud rendered;(a) before and after(b) application of the implemented Shader.
3.3 User interface
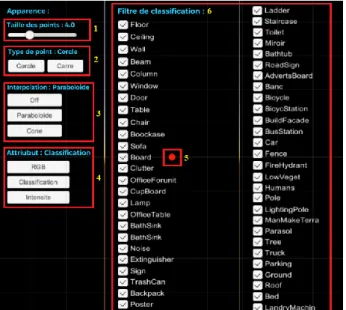
To facilitate interaction and to make the virtual reality experience more immersive, a user interface is created by adding a canvas that is a GameObject encompassing the elements of the user interface, Figure 8.
Once displayed in the virtual world directly in front of the user, it keeps the same fixed position for easy selection and pointing by a laser pointer (element 5) created by adding a Graphic Raycaster to our canvas (Menu that includes the different
The International Archives of the Photogrammetry, Remote Sensing and Spatial Information Sciences, Volume XLII-2/W17, 2019 6th International Workshop LowCost 3D – Sensors, Algorithms, Applications, 2–3 December 2019, Strasbourg, France
elements of type: Button, slider, check box, and text). After changing the parameters, the interface can be hidden and redisplayed when needed. This interface makes possible to change the size of the points (element 1), to change their shapes (element 2) (square or circle), to choose the interpolation to use between the types of paraboloid, cone, or without interpolation (element 3), to select the attributes (element 4) (rgb, classification, intensity) to display, and to check and uncheck the classes to be visualized (element 6).
Figure 8. User interface for interacting directly with point cloud. Then, we integrated the Oculus Rift in the Unity project to allow rendering on the headset (the version of the Oculus application used is Oculus 1.39.0.272909).
The OVRPlayerController is the easiest way to start navigating in a virtual environment. It is basically an OVRCameraRig prefab attached to a simple character controller. It includes a physics capsule, a movement system, a simple menu system with stereo rendering of text fields, and a cross-hair component.
OVRCameraRig contains one Unity camera, the pose of which is controlled by head tracking. The result as seen in the headset is shown in figure 9.
Figure 9. The scene as seen in the headset by the user. 4. RESULTS
In order to validate the proposed methodology and the solution implemented in this paper, several tests are done in Runtime (in play mode). It consist of testing the performance of the rendering methods used, the ability of the application to visualize classified
massive point clouds, and comparative tests on the influence of the number of points loaded on its performance in term of memory consumption and number of frames per second (FPS). While the use of the oculus rift requires minimal computing power especially in terms of graphics card (Nvidia GeForce GTX 1060 or better, AMD Radeon RX 480 or better), the application test is done on a computer with the following technical characteristics (Table 3):
Processor Intel® Core™ i6-6800K CPU @ 3.40GHz 3.40 GHz
Graphic card NVIDIA GeForce GTX 1080
RAM 48.0 Go
Exploitation system Windows 10 Pro, 64 bits
Table 3. Technical characteristics of the computer used with the Oculus headset.
4.1 Influence of the number of points loaded in the scene on the FPS
From figure 10 we clearly see the impact of the number of points allowed to be loaded in the scene (budget points) on the number of images rendered per second.
0 20 40 60 80 100 120 2000000 4000000 6000000 8000000 10000000 F P S Loaded Points
Figure 10. The variation of the FPS number according to the number of points loaded, JEHAY with 2.3 billion. It is visible that the more this number increases, the more the FPS decreases, due to numerous additional computing to display and render. With a number of 2 million, one ensures a good visual appearance of the visible scene, while keeping 90 FPS, which more than enough to ensure a smooth and comfortable viewing for the user as specified by Oculus rift (Oculus, 2019).
4.2 Influence of cache on memory consumption
The results of testing the influence of cache on memory consumption is given in Figure 11. We see that memory consumption increases proportionally when cache increases and the number of points loaded increases. For example, for a cache (LRU) of 100 million points, it is clear that the memory consumed passes from 1,475 Giga Byte for 2 Million points to be loaded to 1.985 GB for 10 Million points to load.
The International Archives of the Photogrammetry, Remote Sensing and Spatial Information Sciences, Volume XLII-2/W17, 2019 6th International Workshop LowCost 3D – Sensors, Algorithms, Applications, 2–3 December 2019, Strasbourg, France
Figure 11. Variation of the memory consumption (in Mo) according to the size of the point cloud loaded and the LRU
cache.
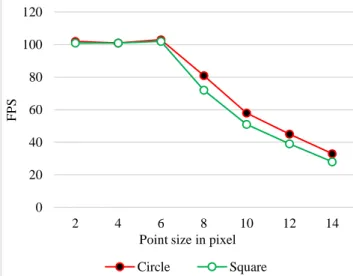
4.3 Influence of point size on the number of FPS
Among the rendering methods used in this work, we use a shader that allows to visualize each point as a square or circle on the screen, instead of viewing it on a single pixel. This type of visualization makes possible to circumvent the effects of point clouds density that form voids between points when this density is too low. However, this comes at the price that these methods are expensive in terms of rendering, greatly reducing the available FPS as seen in Figure 12.
Figure 12. Influence of the variation of the point size on the FPS, JEHAY with a budget of 2Million, interpolation =
paraboloid, LRU = 2M
The graph in Figure 12 shows the effect of varying the point size in the number of pixels on the screen to see its effect on the number of FPS. It is clearly visible that the number of FPS decreases inversely proportional to the size of the point. More the size of points increases more the number of FPS decreases.
5. DISCUSSIONS & PERSPECTIVES
Our methodology has three main essentials steps: The segmentation and classification workflow; the structuration in Potree’s octree data structure; the integration and interaction with classified point clouds in VR.
The segmentation and classification step presented includes semi-automatic methods. It has the advantage of being based on algorithms and open source tool but it remains time-consuming and requires the intervention of the experienced operator. Future use of semantic segmentation algorithms such as presented in (Florent Poux et al., 2017) will be investigated to reduce the intervention of the user.
For visualization of massive point cloud we use Potree’s octree structure. This structuration makes it possible to considerably optimize the real-time visualization of large point clouds but remains a data structure that does not allow efficient edition of the contained point data. In addition to this, the structuring takes a considerable time that can range from a few minutes to ten hours when the point cloud exceeds billions of points, which orient us to investigate new indexation ways for data handling For immersive viewing, we demonstrated the usage of virtual reality technology with the Oculus rift headset for point cloud rendering. On top, we provide an improved shader to permit to grasp the depth through rendering, as well as the ability to interact with classification data. Thus, we facilitate the interaction via a user interface allowing a set of operation and change on the methods of rendering.
The future works will mainly investigate the following 3 points: Development of semantic segmentation process to automate
the enhancement of point cloud with class information. Creation of a dual spatial and classification indexing to make
possible querying and direct interaction with the point cloud in the VR environment.
Implementation of the Continuous Level of Detail (Schütz et al., 2019) rendering method.
6. CONCLUSION
In this work, we propose a comprehensive approach for classifying and visualizing point clouds with several billion of points in real time, and continuously in a virtual reality (VR) environment. After a semi-automatic segmentation and classification, our approach proposes to leverage Potree’s data structure derived from the Modifiable Nested Octree to organize efficiently spatial and semantic attributes, primarily toward real-time VR visualisation. The implementation in the open source Unity application has shown great performance in visualisation of massive point cloud. The future will focus mainly on the automation of semantic enrichment and their usage in VR interactions. Then we will address our point rendering approach toward a continuous level of detail tailored to perform both search queries and modifications on the point cloud in a VR environment.
ACKNOWLEDGEMENTS
The authors are thankful to the developers of CloudCompare, Potree and Unity. We also thank a lot the users of the Github forum especially Simon Fraiss that helped us in several steps of this research. 1 304 1 475 1 489 1 495 1 503 1 342 1 482 1 494 1 519 1 528 1 475 1 661 1 770 1 840 1 985 2 000 000 4 000 000 6 000 000 8 000 000 10 000 000 M em o ry Co n su m p ti o n e n M o Loaded points
LRU=1 000 000 LRU=10 000 000 LRU=100 000 000
0 20 40 60 80 100 120 2 4 6 8 10 12 14 F P S
Point size in pixel
Circle Square
The International Archives of the Photogrammetry, Remote Sensing and Spatial Information Sciences, Volume XLII-2/W17, 2019 6th International Workshop LowCost 3D – Sensors, Algorithms, Applications, 2–3 December 2019, Strasbourg, France
REFERENCES
Boucheny, C., Ribes, A., 2017. Eye-Dome Lighting : a non-photorealistic shading technique.
CloudCompare, 2019. CloudCompare 3D point cloud and mesh processing software Open Source Project. cloudcompare.org (Accessed 25 August 2019).
Fraiss, S.M., 2017. Rendering Large Point Clouds in Unity, bachelor thesis.
GeoSLAM, 2019. GeoSLAM ZEB REVO.
https://geoslam.com/solutions/zeb-revo/ (Accessed 25 August 2019).
Leica, 2019. Leica P30. https://leica-geosystems.com/fr-ma/products/laser-scanners/scanners/leica-scanstation-p40--p30 (Accessed 25 August 2019).
Mures, O.A., Jaspe, A., Padrón, E.J., Rabuñal, J.R., 2016. Virtual Reality and Point-Based Rendering in Architecture and Heritage. NavVIS, 2019. NavVIS M6. https://www.navvis.com/m6 (Accessed 25 August 2019).
Nebiker, S., Bleisch, S., Christen, M., 2010. Rich point clouds in virtual globes - A new paradigm in city modeling? Comput. Environ. Urban Syst. 34, 508–517.
Oculus, 2019. Oculus Rift. https://www.oculus.com/rift/ (Accessed 25 August 2019).
Potree, 2019. PotreeConverter.
https://github.com/potree/PotreeConverter (Accessed 25 August 2019).
Poux, F., 2019. The smart point cloud Structuring 3D intelligent point data.
Poux, F., Billen, R., 2019a. Voxel-based 3D Point Cloud Semantic Segmentation: Unsupervised Geometric and Relationship Featuring vs Deep Learning Methods. ISPRS Int. J. Geo-Information 8, 213.
Poux, F., Billen, R., 2019b. A Smart Point Cloud Infrastructure for intelligent environments, in: Lindenbergh, R., Belen, R. (Eds.), Laser Scanning: An Emerging Technology in Structural Engineering, ISPRS Book Series. Taylor & Francis Group/CRC Press, United States.
Poux, F., Hallot, P., Neuville, R., Billen, R., 2016a. Smart point cloud: definition and remaining challenges. ISPRS Ann. Photogramm. Remote Sens. Spat. Inf. Sci. IV-2/W1, 119–127. Poux, F., Neuville, R., Hallot, P., Billen, R., 2017. Model for semantically rich point cloud data. ISPRS Ann. Photogramm. Remote Sens. Spat. Inf. Sci. IV-4/W5, 107–115.
Poux, F., Neuville, R., Hallot, P., Billen, R., 2016b. Point clouds as an efficient multiscale layered spatial representation, in: Vincent, T., Biljecki, F. (Eds.), Eurographics Workshop on Urban Data Modelling and Visualisation. The Eurographics Association, Liège, Belgium.
Poux, Florent, Neuville, R., Van Wersch, L., Nys, G.-A., Billen, R., 2017. 3D Point Clouds in Archaeology: Advances in
Acquisition, Processing and Knowledge Integration Applied to Quasi-Planar Objects. Geosciences 7, 96.
Scheiblauer, C., der Arbeit, V., Wimmer, M., Gervautz, M., gang Knecht, W.-, Marek, S., Hebart, G., Gschwantner, F.-M., Zimmer, N., Mayer, I., Fugger, V., Barsukov, Y., Preiner, R., Mayer, J., Pregesbauer, M., Tragust, M., Arikan, M., 2014. Interactions with Gigantic Point Clouds.
Scheiblauer, C., Wimmer, M., 2011. Out-of-core selection and editing of huge point clouds. Comput. Graph. 35, 342–351. Schuetz, M., 2016. Potree: Rendering Large Point Clouds in Web Browsers 84.
Schütz, M., Krösl, K., Wimmer, M., 2019. Real-Time Continuous Level of Detail Rendering of Point Clouds. IEEE VR 2019, 26th IEEE Conf. Virtual Real. 3D User Interfaces 1–8. Unity, 2018. Unity Personal. https://unity3d.com/fr/get-unity/download (Accessed 25 August 2019).
Wahl, R., Klein, R., 2007. Efficient RANSAC for Point-Cloud Shape Detection 0, 1–12.
Whyte, J., 2018. Industrial applications of virtual reality in architecture and construction.
Zhang, W., Qi, J., Wan, P., Wang, H., Xie, D., Wang, X., Yan, G., 2016. An easy-to-use airborne LiDAR data filtering method based on cloth simulation. Remote Sens. 8, 1–22.
The International Archives of the Photogrammetry, Remote Sensing and Spatial Information Sciences, Volume XLII-2/W17, 2019 6th International Workshop LowCost 3D – Sensors, Algorithms, Applications, 2–3 December 2019, Strasbourg, France