Clinal differentiation during invasion: Senecio inaequidens (Asteraceae)
along altitudinal gradients in Europe
Arnaud Monty ; Grégory Mahy
Laboratory of Ecology, Gembloux Agricultural University, Passage des Déportés, 2, 5030 Gembloux, Belgium
Abstract: The dynamics of plant population differentiation may be integral in predicting aspects of introduced
species invasion. In the present study, we tested the hypothesis that European populations of Senecio inaequidens (Asteraceae), an invasive species with South African origins, differentiated during migration from two independent introduction sites into divergent altitudinal and climatic zones. We carried out 2 years of common garden experiments with eight populations sampled from Belgian and ten populations from French altitudinal transects. The Belgian transect followed a temperature and precipitation gradient. A temperature and summer drought gradient characterized the French transect. We evaluated differentiation and clinal variation in plants germinated from field-collected seed using the following traits: days to germination, days to flowering, height at maturity, final plant height and aboveground bio-mass. Results showed that S. inaequidens populations differentiated in growth traits during invasion. During the 1st year of sampling, the results indicated clinal variation for growth traits along both the Belgium and French altitudinal transects. Data from the 2nd year of study demonstrated that with increasing altitude, a reduction in three growth traits, including plant height at maturity, final plant height and aboveground biomass, was detected along the French transect, but no longer along the Belgian one. Phenological traits did not exhibit a clear clinal variation along altitudinal transects. The possible evolutionary causes for the observed differentiation are discussed.
Keywords: Climatic gradient ; Altitude ; Genetic differentiation ; Clinal variation ; Invasive species
Introduction
Biological invasions, despite the harmful effects on biodiversity and economics (Pimentel et al. 2000), serve as an outstanding opportunity to address fundamental questions regarding evolution in response to environmental modification (Callaway and Maron 2006; Lee 2002; Sakai et al. 2001). When invasive species introduction and distribution history is well documented, invasions provide a rare chance to evaluate evolutionary change on a human time scale. Historical data provide information that was not intended for evolutionary studies, but is valuable metadata available to address more contemporary questions regarding environmental and evolutionary change (Sax et al. 2007).
The processes inherent in alien species establishment and migration, leading to an increase in abundance, can be divided into three distinct phases: establishment, naturalization and expansion (Kolar and Lodge 2001; Sakai et al. 2001; Sexton et al. 2002). At each phase, evolutionary processes may occur that are responsible for the success of the invasive taxon. A number of compelling studies reported phenotypic/genetic divergence between native and invasive populations (reviewed in Bossdorf et al. 2005). Dietz and Edwards (2006) argue that important selective regimes can also occur following the early stages of colonization, when an exotic plant encounters different habitat conditions. The non-native species may experience increased competition from the native flora (D'Antonio 1993), variable interactions with biotic factors (Siemann and Rogers 2001) or selection imposed by specific abiotic conditions (Mihulka and Pysek 2001). If ecological abiotic factors vary at the invasion fronts, changes in life history traits are expected, either due to plasticity or adaptation under selective pressures.
Climate is one of the most important abiotic factors in regard to species distribution. Expansion of the introduced species range will depend on how well exotic species cope with geographic heterogeneity in climate (Montague et al. 2008). Spread over broad climatic gradients is expected to involve clinal adaptive differentiation of populations (Cox 2004, Montague et al. 2008) because many climatic factors vary geographically in a continuous manner (Endler 1977). Large-scale latitudinal clines, interpreted as evolutionary adaptation to climate heterogeneity, has indeed been observed for different life history traits in an increasing number of introduced species (Etterson et al. 2007; Gilchrist et al. 2004; Huey et al. 2000; Kollmann and Banuelos 2004; Leger and Rice 2007; Montague et al. 2008; Weber and Schmid 1998). In contrast, analogous altitudinal life history
variation has been studied much less frequently in invasive species (but see Parker et al. 2003 for an example with a plant species). Overall, altitudinal trends can be expected to mirror latitudinal trends in that with increasing altitude or latitude, the reproductive season gets shorter, and climate becomes harsher. Hence, examination of differentiation patterns along altitudinal gradients is very complementary to our recent knowledge on latitudinal variation in invasive species and will foster our understanding of adaptation in introduced ranges.
For the majority of exotic plant species, the evolutionary interpretation of life history trait variation across the invasion range may be difficult. The species introduction history and subsequent patterns of dispersal over time are largely unavailable. This is particularly true for plant species with horticultural interest, where long-distance seed exchange, anthropogenic gene flow and multiple introduction events take place (Ellstrand and Schierenbeck 2006). However, in Europe, the African ragwort Senecio inaequidens DC. (Asteraceae) is a highly invasive species with a well-documented invasion history. As a result of wool importation from South Africa during the late 19th century, recorded independent introduction sites chronicle the species migration routes. It has extended over a range of climatic zones in Europe, but its distribution remains disjunct, suggesting that species dispersal was primarily spontaneous, although helped by roads and railways (Ernst 1998). The species is not extensively propagated for ornamental purposes, reducing the risk of anthropogenic gene flow among regions. As the species is now present over broad altitudinal and climatic regimes, regional adaptations can be expected. The unique introduction history of S. inaequidens makes it an ideal model to study rapid differentiation in response to climatic variation in its introduced range.
In the present study, we tested the hypothesis that populations of S. inaequidens differentiated towards divergent altitudinal and climatic zones during invasion from two independent introduction sites. Field observations and common garden experiments using 18 populations of S. inaequidens from two altitudinal transects were carried out to address the following question: along the two transects, could an altitudinal cline in phenology and growth traits be identified?
Methods
Study species and invasion history
S. inaequidens is a herbaceous perennial shrub native to South Africa and Lesotho, distributed mainly on river edges and in stony meadows (Ernst 1998). It was accidentally introduced to Europe in the late nineteenth-early twentieth centuries, where only tetraploids are reported. In its native range, the species occurs as two co-existing cytotypes (Lafuma et al. 2003). The precise origin of the introduced tetraploid populations in the native range is unclear, but the high mountain regions of Lesotho and Free State areas are the most likely regions (Bossdorf et al. 2008; Lafuma et al. 2003). Several introductions occurred in Europe during the nineteenth-early twentieth century, and well-documented historical data are provided for two of them. In Belgium, herbarium records document the first occurrence near the wool factories of Verviers in 1892, near Liege (Verloove F., personal communication). The species was later recorded in the same wool-processing area in 1922 (Mosseray 1936). After 40 years restricted to this site, it started to spread rapidly. It reached Gent, Namur and Charleroi (Belgium) in the 1970s (Lebeau et al. 1978) and Amsterdam (The Netherlands) in 1985 (Ernst 1998). In southern France, the species was initially collected in 1936 in the wool-processing center of Mazamet (Guillerm et al. 1990; Senay 1944). It was only after 1950 that the species began its expansion. By the 1970s, the species was considered an agricultural weed in southwestern France, well within the first introduction region (Jovet and Vilmorin 1975). In the early 1980s, the species reached the Mediterranean coast from Mazamet (Guillerm et al. 1990). A decade later, even though the species was mainly distributed along roads and railways, it was considered a threat to natural habitats (Michez 1995). Other primary introduction sites were recorded in European wool centers: Bremen and Hanover in Germany (Kuhbier 1977), Edinburgh in Scotland (Lousley 1961) and Verona in Italy (Pignatti 1982).
The first records of the species, inferred as introduction events, were all tied to the wool industry, and for several decades, specimens were only documented in the vicinity of wool-processing centers (e.g., Ernst 1998; Lousley 1961). Therefore, these historical and herbarium data strongly suggested seeds were introduced with the sheep wool trade and that the colonization events, e.g., in Belgium and France, were independent. The present absence of the species in geographic areas between Southern Belgium and Southern France strengthen this interpretation (personal observation).
S. inaequidens extends to 1 m tall with numerous stems bearing yellow capitulae. Individuals can produce up to 1,500 capitulae over a flowering period, each capitulum bearing roughly 100 achenes (hereafter referred to as
"seeds") (Lopez-Garcia and Maillet 2005). Sexual reproduction initiates in late spring (May-June), approximately 2 months after germination, and continues through late autumn (November-December). The species is considered self-incompatible, but some individuals were observed exhibiting partial self-fertility in France (Lopez-Garcia and Maillet 2005). Entomophilous pollination with generalist pollinators is most common. Seed populations
Two transects were defined along altitudinal gradients in France and Belgium (Fig. 1). Each transect corresponded to a colonization event from an introduction site. Transects were 150 km (Belgium) and 200 km (France) long. They were divided into four (Belgium) and five (France) topographic and climatic zones and numbered consecutively from sea level to high elevation: Belgium: (1) Coastal Oceanic (altitudinal reference: 0 m), (2) Oceanic (50 m), (3) Sub-oceanic (200 m) and (4) Sub-oceanic (400 m); France: (1) Coastal Mediterranean (altitudinal reference: 0 m), (2) Sub-Mediterranean (200 m), (3) Sub-oceanic (400 m), (4) Low-elevation mountain (800 m) and (5) Mid-Low-elevation mountain (1,600 m). Zone Number 3, in both countries, was the initial introduction zone for each colonization event. In each zone, two populations were selected at similar altitudes (Table 1) and were spaced at least 5 km apart. The 18 selected populations included at least 100 individuals and were all located along roadsides on rocky and/or gravel soils. In November 2005 and 2006, seeds were collected on two to three capitulae from ten randomly selected individuals per population. Based on large population size, sampled individuals were assumed not to be the same in 2005 and 2006. Seeds were stored at 4°C and sorted using a dissecting microscope: the ten largest seeds without anomaly per parent individual were preserved for the experiment as within-capitulum variability in seed mass has been shown for the species (Monty et al. 2008). The ten seeds per parent individually selected in 2006 were collectively weighed to the nearest 0.1 mg.
In November 2006, in situ measurements were performed in the 18 populations: the ten largest plants per population were recorded, and their height was measured. The largest individuals were considered instead of randomly selected ones in order to discard the effects of the demographic stage of the population, with the assumption that old plants (representative of the longevity of the species) were present in all populations. Common garden experiments
In spring 2006 and 2007, a randomized block common garden experiment was established on an open field in Gembloux (Belgium, altitude: 160 m) with the seeds collected in 2005 and 2006, respectively. Each of the ten blocks consisted of two rows of nine pots. To prevent aboveground competition, rows were placed 80 cm apart and pots in the rows separated by 50 cm. The common garden was surrounded by two additional rows of pots, to prevent edge effects. On 17 (block 1-5) and 18 (block 6-10) March 2006 and on 17 April
2007, the ten sorted seeds per parent individual were collectively sown in pots containing 2.51 of sand, 2.5 1 of compost and 0.5 1 of hydro-granulates. Pots were then covered with a protective light-permeable canvas until early May. Seedlings were counted every 2-3 days. The first emerged seedling in each pot was marked with a short rod for measurement. Other seedlings were removed after counting. In 2006 and 2007, each of the 180 sampled parent plants (10/population) was thus represented by ten seeds for germination study, then by one descendant. Germination was considered complete on 15 May 2006 and on 1 June 2007 when no additional seedlings had emerged for 10 days. Measurements were conducted until mid-December 2006 and late November 2007. During summer drought in 2006, plants were watered periodically. All data were recorded block by block and included the following: time to germination (d) since sowing, time to flowering (d) since germination and height at maturity (cm), defined as the height of the plant at first flowering (based on daily observations). At the end of each experiment, plants were harvested at ground level, final height (cm) was recorded and aboveground biomass (g) was measured after oven drying for 48 h at 60°C. Final plant height was measured for half the blocks (90 individuals) in 2006. Above-ground biomass was measured for half the blocks (90 individuals) both years.
Fig. 1: Sample population locations of Senecio inaequidens DC (Asteraceae) from a Belgian and b French
transects. Numbers correspond to transect altitudinal zones, and symbols correspond to populations. Open symbols represent populations from the first introduction sites
Table 1: Characteristics of Senecio inaequidens DC (Asteraceae) populations along the Belgian and the French
transects, and corresponding climatic stations
Transect Transect zone
Seed population Climatic station Population Location Altitude (m) Latitude N Longitude E Altitude (m) Latitude N Longitude E AnnT (°C) AnnP (mm) Belgium B1 A Ekeren 5 51°16' 4°23' 12 51°12' 4°28' 9.6 776 B Berendrecht 4 51°22' 4°17' B2 A Paal 35 51°03' 5°11' 55 51°10' 5°28' 9 799 B Hulst 22 51°04' 5°09' B3 A Venders 195 50°36' 5° 53' 186 50°39' 5°27' 7.4 1,127 B Goé 220 50°36' 5° 57' B4 A Malmédy 320 50°25' 6°00' 564 50°28' 6°11' 5.7 1,326 B Kaiserbaracke 480 50°20' 6°05' France F1 A Narbonne 5 43°11' 3°02' 5 43°11' 3°01' 16.1 598 B Narbonne-Plage 2 43°10' 3°11' F2 A Rieux-Minervois 95 43°16' 2°37' 80 43°16' 2°31' 15 670 B Caunes-Minervois 175 43°19' 2°32' F3a A Castaunouze 370 43°29' 2°23' 683 43°28' 2°21' 12.7 992 B Moulin de l'Oulne 330 43°29' 2°22' 232 43°33' 2°17' F4 A Nohèdes 785 42°37' 2°19' 1,000 42°38' 2°17' 10.3 888 B Taurynia 760 42°35' 2°25' F5 A La Llagone 1,695 42°32' 2°08' 1,600 42°31' 2°07' 6.3 708 B Egat 1,635 42°30' 2°01'
AnnT and AnnP are annual mean temperature and annual cumulated rainfall, respectively
Climatic data
Along each transect, a climatic station per zone was selected nearest the two populations per zone, at comparable elevation (Table 1). Available data included monthly mean temperature and rainfall over the period 2000-2005 for the French transect and over the last 25 years for the Belgian study site. The average values of two stations were used for the French third zone (F3) to be representative of the populations. In order to reduce the number of variables and control for autocorrelation, principal component analyses (PCA) were performed on the climatic data. First PCA axes will therefore be referred to as "PCA 1 CLIMATE." Climatic interpretation of the altitudinal gradients was made using Pearson's correlation coefficients between climatic data and principal components scores (Supplementary Table S1).
Data analysis
Evidence of clinal altitudinal differentiation was tested by calculating Pearson's correlation coefficients between the mean population values for each of the measured traits and the altitude of seed populations. To help visualization, corresponding linear regressions were performed in Fig. 2. Individual plant values were indirectly analyzed through the population mean because individuals within populations were not independent samples. In order to take into account maternal carry-over effects due to differences in seed provisioning among populations, in 2007, we used seed mass as a covariate in correlation analysis. In addition, we assessed whether populations were significantly different among altitudinal zones for the same traits employing mixed-model ANOVA (2006) and ANCOVA (2007). Populations (random) were nested within altitudinal zones (fixed), which were nested in the factor region (fixed), i.e., Belgium and France. The factor block was random. Altitudinal pattern of seed mass variation was tested by calculating Pearson's correlation coefficient between seed mass and population altitude.
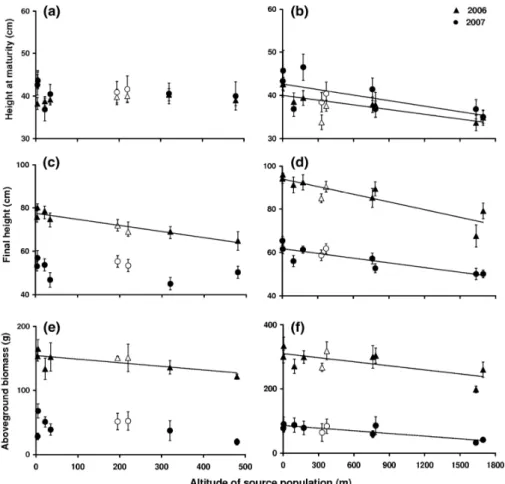
Fig. 2: Senecio inaequidens populations in the common garden experiments in 2006 and 2007: a, b height at maturity, c, d final height and e, f above-ground biomass against altitude of source populations Belgian (a, c, e) and French (b, d, f) transects. Symbols represent population trait means, with standard errors. Solid lines represent significant regressions (P < 0.05) along the transects. Open symbols represent populations from the first introduction site (Verviers in Belgium and Mazamet in France)
As plant traits tended to be correlated (Supplementary Table S2), in order to assess the global differentiation of plants in relation to climate, a PCA was performed on the plant traits data for each transect and each year separately. The scores of the four resulting first PCA axes (referred to as "PCA 1 PLANT TRAIT") were regressed against the corresponding PCA 1 CLIMATE scores (Fig. 3).
In situ measurements were analyzed by calculating Pearson's correlation coefficients (and corresponding linear regressions) between mean population height and (1) population altitude and (2) mean population height in the common garden.
Analyses of variance and covariance were performed using the general linear model (GLM) in Minitab software version 14.20 (Minitab Inc. 2000). Correlations analysis and PCA were made using Statistica software version 6.1 (Statsoft Inc., 2004). Aboveground biomass data were log-transformed to reach the assumptions of statistical analyses.
Results
Climatic description of the transects
Climatic data for increases in elevation along the French transect showed annual mean temperature decreased gradually from 16.1 to 6.3°C. Annual precipitation rose from sea level (598 mm) to the initial introduction zone (992 mm) and then fell at higher elevations. In Belgium, annual mean temperature decreased gradually from 9.6°C at sea level to 5.7°C at the highest altitude, and annual precipitation increased from 726 to 1,326 mm (Table 1). The first two PCA axes generated from the monthly climatic variables were informative. In France, the first axis explained 62.5% of the variance and was described as a temperature and summer-drought axis (Supplementary Table S1). In Belgium, the first axis explained 95.5% of the variance and was positively correlated to all the monthly temperatures and negatively correlated to all monthly precipitation levels. No significant correlation was found for the second axis. Along both the French and Belgium transects, the first axis was strongly and negatively correlated to altitude (France: r = -0.959, P< 0.001, Belgium: r = -0.963, P < 0.001), while the second axis revealed a lack of correlation (France: r = 0.266, P = 0.457, Belgium: r = 0.091, P = 0.831). This indicated that the French altitudinal transects followed a temperature and summer-drought gradient, with the warmest and most summer-dry zones at lower altitudes. The Belgian transect followed both a decrease in temperature and an increase in rainfall levels with increasing elevation. Most traits correlated with altitude were also correlated with each transect and the corresponding first PCA axis (Table 2).
Population differentiation in the common gardens
Germination occurred in every pot in the experimental gardens, and all selected plants survived and bloomed. ANOVA (2006) and ANCOVA (2007) (Table 3) revealed significant differences between the two regions (Belgium and France) for the aboveground plant biomass and final height in 2006. Within each transect, there were significant differences between altitudinal zones in height at maturity and aboveground biomass in 2006 and final plant height in 2006 and 2007. Populations within altitudinal zones differed only for time to germination in 2007. Seed mass in the 2007 ANCOVA explained a significant part of the variability in time to germination and final plant height.
In 2006 and 2007, populations from the French transect showed significant correlations with altitude for three traits in the common garden: height at maturity, final height and aboveground biomass. All trait values decreased with increasing elevation of the source populations (Fig. 2). A similar trend was found for time to flowering in 2006 that was not statistically confirmed in 2007. For the Belgian populations, final plant height and aboveground biomass also showed a significant decrease with altitude in 2006.
Those trends were not confirmed in 2007 as no significant correlations were found between traits and population altitude for Belgian populations. Both years, correlation signs were however similar: growth traits decreased with increasing altitude of the source populations (Table 2).
Despite a marginally significant correlation of seed mass and altitude along the French transect (r = 0.590, P = 0.072) and a significant influence on plant height in 2007 ANCOVA, including seed mass as a covariate in the correlation analysis in 2007 did not change the outcome of the analysis. Height at maturity, final height and above-ground biomass were still significantly correlated with altitude when seed mass was used as a covariate (P = 0.024, P = 0.004, P = 0.011, respectively).
From the PCA performed on plant traits, only the first axis was kept for further consideration. In Belgium, PCA 1 PLANT TRAIT explained 57.3 and 38.9% of the variance, respectively, in 2006 and 2007. In France, the explained variance was 69.0% in 2006 and 63.4% in 2007. Correlations of plant traits with PCA 1 PLANT TRAIT axes are presented in Supplementary Table S3. Figure 3 allows visualization of the global plant differentiation in relation to climate.
Fig. 3: Population scores for PCA 1 of climate and plant traits for (a) Belgian and (b) French transects in 2 years. Lines represent regressions for each year. Triangles and dotted lines: 2006. Circles and plain lines: 2007. Regressions were significant for the French transect in 2006 (r2 = 0.780, P = 0.001) and 2007 (r2 = 0.704, P = 0.002)
Table 2: Pearson's coefficient of correlation between population trait means in the common gardens 2006 and
2007, and altitude of source population along both transect and corresponding PCA 1 CLIMATE axes
Trait Belgium France
2006 2007 2006 2007
Altitude PCA 1 Altitude PCA 1 Altitude PCA 1 Altitude PCA 1
Time to germination -0.590 Ns 0.709 * -0.123 Ns 0.255 Ns 0.476 Ns -0.592 Ns 0.570 Ns 0.470 Ns Time to flowering -0.537 Ns 0.441 Ns -0.289 Ns 0.284 Ns -0.654 * 0.718 * -0.401 Ns 0.340 Ns Height at maturity -0.155 Ns 0.125 Ns -0.147 Ns 0.151 Ns -0.726 * 0.827 ** -0.670 * 0.731 * Final height -0.940 ** 0.919 ** -0.390 Ns 0.435 Ns -0.890 ** 0.872 ** -0.870 ** 0.868 ** Aboveground biomass -0.712 * 0.643 Ns -0.514 Ns 0.406 Ns -0.695 * 0.647 * -0.868 ** 0.809 **
Bold values are significant correlations
Ns not significant
* 0.01 ≤P< 0.05, ** 0.001 ≤P< 0.01
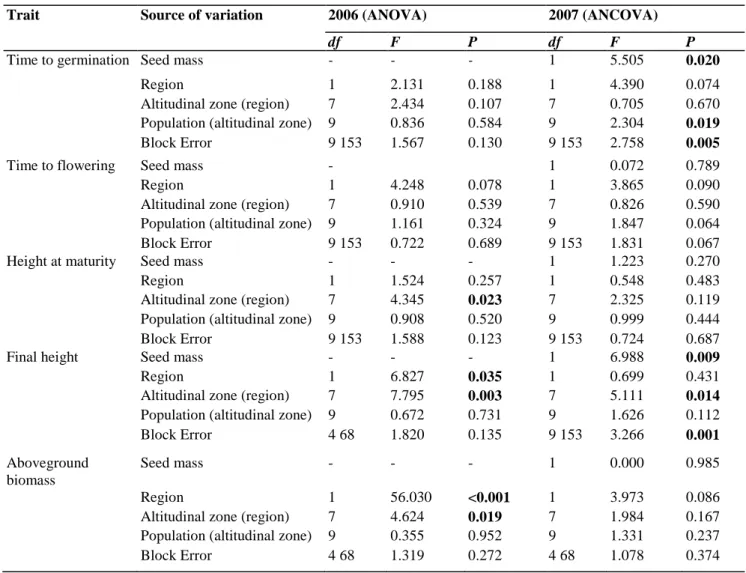
Table 3: Results of nested ANOVA (2006) and ANCOVA (2007, covariate: seed mass) for traits measured in the
common gardens
Trait Source of variation 2006 (ANOVA) 2007 (ANCOVA)
df F P df F P
Time to germination Seed mass - - - 1 5.505 0.020
Region 1 2.131 0.188 1 4.390 0.074
Altitudinal zone (region) 7 2.434 0.107 7 0.705 0.670
Population (altitudinal zone) 9 0.836 0.584 9 2.304 0.019
Block Error 9 153 1.567 0.130 9 153 2.758 0.005
Time to flowering Seed mass - 1 0.072 0.789
Region 1 4.248 0.078 1 3.865 0.090
Altitudinal zone (region) 7 0.910 0.539 7 0.826 0.590
Population (altitudinal zone) 9 1.161 0.324 9 1.847 0.064
Block Error 9 153 0.722 0.689 9 153 1.831 0.067
Height at maturity Seed mass - - - 1 1.223 0.270
Region 1 1.524 0.257 1 0.548 0.483
Altitudinal zone (region) 7 4.345 0.023 7 2.325 0.119
Population (altitudinal zone) 9 0.908 0.520 9 0.999 0.444
Block Error 9 153 1.588 0.123 9 153 0.724 0.687
Final height Seed mass - - - 1 6.988 0.009
Region 1 6.827 0.035 1 0.699 0.431
Altitudinal zone (region) 7 7.795 0.003 7 5.111 0.014
Population (altitudinal zone) 9 0.672 0.731 9 1.626 0.112
Block Error 4 68 1.820 0.135 9 153 3.266 0.001
Aboveground biomass
Seed mass - - - 1 0.000 0.985
Region 1 56.030 <0.001 1 3.973 0.086
Altitudinal zone (region) 7 4.624 0.019 7 1.984 0.167
Population (altitudinal zone) 9 0.355 0.952 9 1.331 0.237
Block Error 4 68 1.319 0.272 4 68 1.078 0.374
Populations (random) were nested within altitudinal zones (fixed), which were nested in the factor region (fixed), i.e., Belgium and France. Block was a random factor. P-values in bold are significant
Phenotypic variation in the field
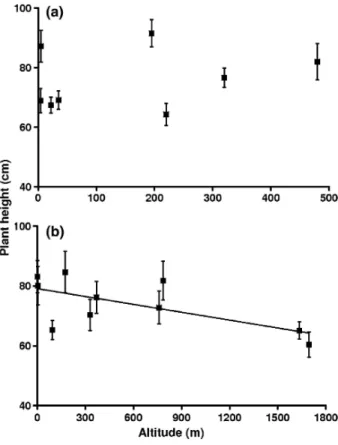
Mean population heights recorded in situ were significantly correlated to altitude (Fig. 4) along the French transect (r = -0.651, P = 0.042), but not along the Belgian transect (r = -0.265, P = 0.527). Similarly, there was a significant correlation between population mean height in the field and in the common garden for French populations (r = 0.704, P = 0.023), but not for the Belgian ones (r =-0.0591, P = 0.889).
Fig. 4: In situ variation of plant height with altitude for a Belgian and b French transects. Symbols represent
population means, with standard errors. The line represents the significant regression along the French transect
Discussion
In this study, we addressed whether populations of the invasive species S. inaequidens diverged during range expansion along altitudinal gradients, ca. 1 century after introduction, using field measurements and common garden experiments. We evaluated life-history traits by measuring characteristics of germination, flowering phenology and growth. We used two independent transects differing in their altitudinal range and repeated the experiments over 2 years with independent seed sources.
Clinal variation in the common garden experiments
Our most noteworthy result was a significant clinal reduction in plant height (height at maturity and final height) and aboveground biomass associated with increasing altitude in plants from the French transect. This study area exhibited the greatest altitudinal range. These results were consistently observed over 2 years of common garden experiments and parallel the variation observed in wild populations. A similar significant reduction of final height and biomass with increasing altitude was also observed for Belgian populations, the study area with a lower range of altitudinal variation. However, significant results were only observed for the 1st year of study. Altitudinal trends were globally less clear along the Belgian than along the French transect. The shorter experimental period in the 2nd year of the experiment may therefore be a reason for the lack of significant differentiation in growth traits along this transect.
Phenological traits, particularly time to flowering, are also considered important life-history traits, likely to influence invasive plant success (Griffith and Watson 2006). Among invasive plants, genetically based clinal variation for flowering time has been reported along large latitudinal gradients (e.g., Kollmann and Banuelos
2004; Montague et al. 2008; Weber and Schmid 1998). However, we did not detect such differentiation for S. inaequidens along altitudinal transects. Height at maturity gradually decreased with increasing elevation in France, but time to flowering did not exhibit consistent patterns of differentiation over the 2 years of study and among the transects. In S. inaequidens, this may be due to increased phenotypic plasticity for this trait than for growth traits. Selection pressure on flowering time may also be lower than on growth traits and size at maturity. This could be counteracted by gene flow, which is expected to be higher at the geographical scale of our study (100 km) rather than over latitudinal ranges (1,000 km).
Regressing principal component scores of plant traits against climate (Fig. 3) showed that globally, plant altitudinal differentiation was related to climatic variation along the French transect. Climatic interpretations revealed that the French transect followed a temperature and summer-drought gradient.
Non-adaptive mechanisms leading to clinal variation
Clines are typically interpreted as the product of local adaptation across an ecological gradient. However, alternative, non-exclusive hypotheses cannot be excluded on the basis of common garden experiments. Clines can originate from demographic processes, notably as a by-product of colonization routes and repeated founder events (Endler 1977) that are likely to occur in invasive species. Genetic drift associated with repeated bottlenecks may result in significant differences among populations and reduced genetic variation within populations (Barrett and Husband 1990; Parker et al. 2003). In our case, however, because source populations were in the middle of colonization routes, genetic drift should have led to opposite effects in the two colonization directions. We detected an increased frequency of larger individuals towards low altitudes versus an increased frequency of smaller individuals towards higher altitudes, an improbable scenario under complete genetic drift. Another possibility is the introduction of pre-adapted genotypes from climatically similar regions of the native range (climate matching, e.g., propagules from higher altitude in the native range are introduced directly into higher altitude localities in the introduced range) (Maron et al. 2004; Montague et al. 2008). Consequently, divergence in introduced regions would reflect prior divergence of source populations in the native range. Historical records of S. inaequidens range expansion make this explanation unlikely, particularly in regards to the transects explored in this study, where the species migration progression has been well documented by botanists (e.g., Ernst 1998; Guillerm et al. 1990; Jovet and Vilmorin 1975; Lebeau et al. 1978). In both regions, the species was first restricted to local sites of introduction (vicinity of wool factories) and started to spread to new localities in the 1970s. Hence, the expansion of the species was initiated following the end of the main known source of introduction, notably wool importation. In addition, differences in altitudinal range of the tetraploid S. inaequidens between native and introduced ranges make it unlikely that coincidental introduction is the cause for the observed clinal trait variation. Lafuma and Maurice (2007) reported that invasive tetraploid populations of S. inaequidens in Europe probably originated from South African high mountain regions, while invasive populations in Europe cover a range from sea level to mountain altitudes. Nevertheless, phylogeographic analysis including native and introduced populations coupled with estimates of genetic diversity along altitudinal transects would be required to elucidate the role of immigration history and/or genetic drift in geographical differentiation of life-history traits (e.g., Kliber and Eckert 2005; Maron et al. 2004). Because our seed source was from field collections, environmental maternal effects could have contributed to among-progeny variation in the common garden (Roach and Wulff 1987). Such effects could result from different seed provisioning among populations because of variation in the maternal growth environment. To overcome this limitation, levels of differentiation in traits should be further assessed using seeds generated under controlled conditions to ascertain genetic origins. However, different lines of evidence make it unlikely that maternal effects play an important role in the observed patterns of divergence. Height differentiation along both transects was low in juvenile stages and more discernable in mature individuals (data not shown). This indicated low maternal effect contributions as these are generally marked during primal growth (Roach and Wulff 1987). Moreover, controlling for seed mass in ANCOVA and correlation analyses between seed traits and altitude showed negligible changes in the results. Differences between altitudinal zones, as well as clinal variations, existed exclusive of the influence of seed mass. However, we cannot exclude maternal effect because of adaptive transgenerational plasticity that improves progeny fitness in maternal environments and may not involve differential provisioning (Galloway 2005).
Adaptive mechanisms leading to clinal variation
With our current knowledge of the species history, a significant role of evolutionary process due to selection along colonization routes may be the most parsimonious hypothesis to explain the observed altitudinal cline in growth traits along the French transect. Correspondence between the performance of populations in the field and
common gardens would be expected if geographic variation in life-history traits had a genetic component. We detected a similar trend of decreasing height with higher altitude both in the field and in the common gardens. Variation in life-history traits among introduced populations of S. inaequidens closely matched specific theoretical expectations for selection on growth traits across an altitudinal gradient and also corresponded to a climatic gradient. Small size is expected to reflect adaptation to harsher conditions and to shorter growing seasons, and is a common feature of alpine ecotypes in native species (e.g., Blanckenhorn 1997; Clausen et al. 1941; Galen et al. 1991; Körner 1999). Along elevationnal gradients, native herbaceous species were found to show a decrease in plant size and growth rate (Hemborg and Karlsson 1998; von Arx et al. 2006). This parallels clinal variation in size that has been observed in different invasive species, including both plants and animals, along latitudinal gradients that may represent similar climatic variation (e.g., Huey et al. 2000; Kollmann and Banuelos 2004; Weber and Schmid 1998). In S. inaequidens, the pattern of covariation between growth traits and elevation was stronger in France than in Belgium. Climatic analysis indicated the French transect was mainly along a temperature and summer-drought gradient and had the broadest temperature ranges. The Belgian transect covered a smaller range of altitude and temperature. Selection pressures might therefore be lower under these conditions. If the correlation analysis along the French transect is performed after removing the two highest populations (results not shown), although the overall pattern remains similar (smaller plants at higher altitudes), altitudinal trends in most traits (but final height) are no longer statistically significant. Altitudinal limitation in Belgium might therefore be a reason for the lack of significance in the results.
If adaptation occurred, different processes of selection may have shaped the observed differentiation among populations. Individuals dispersed from their native range may have already contained all the genetic variation that was later expressed among populations in the introduced localities. In that case, natural selection would have filtered among the available genotypes and favored those best suited to the new environments. This 'sorting' process would not have required the formation of new genotypes and evolutionary processes other than differential mortality after introduction (Sakai et al. 2001). Bossdorf et al. (2008) advocated such a 'sorting' process to explain trait differences between native and introduced populations of S. inaequidens in Central Europe, as they observed that invasive populations were less genetically variable than natives in a common garden experiment. However, the authors only included low altitude European populations, which did not encompass the full range of genetic variation in growth traits reported in the current study. In addition, for the traits showing an altitudinal cline, we did not detect evidence for a reduction of within-population trait variation along the study transects: the coefficients of variation were not correlated to altitude (data not shown). This would have been an indicator of selection of a subset of introduced genotypes. Alternatively, as the species is known to be largely self-incompatible (Lopez-Garcia and Maillet 2005), sexual reproduction may have resulted in the origin of novel genotypes in the introduced range for natural selection to favor or cull from the non-native populations. Lafuma and Maurice (2007) provided evidence that the S. inaequidens population of Mazamet (site of introduction, French transect) may have been founded by a mixture of several South African populations as they exhibited a higher number of compatible crosses compared to South African populations. Some authors have suggested that gene recombination in the introduced range between populations previously isolated in the native range may be an important force for rapid evolution in invasive species (Lee 2002; Sakai et al. 2001). The differential mortality and reproduction of genotypes resulting from sexual reproduction, dictated by environmental conditions, could lead to the observed clinal variation. A similar evolutionary scenario was proposed by Weber and Schmid (1998) to explain latitudinal differentiation in size of European Solidago altissima and Solidago gigantea.
Conclusions
Selection of adapted genotypes during migration from a colonist source seems the most likely explanation for the observed clinal patterns in growth traits for S. inaequidens. However, different evolutionary processes invoked are not mutually exclusive, and the immigration history of invaders is often complex. In addition, it is not yet clear how much the observed differences among populations for growth traits may affect fitness. A comprehensive evaluation of divergence patterns is made difficult by the use of only one common garden site. If genetically based differentiation can be linked to altitude and temperature/summer-drought conditions, reciprocal transplants would be a more viable test of the adaptive significance of the observed clinal variation (Lacey 1988; Rice and Mack 1991). For this reason, additional studies are needed to fully understand the evolutionary basis of the clinal trend observed in our study. Nevertheless, our study contributes to the growing body of evidence regarding the potential for rapid differentiation of invasive species populations as they disperse through their non-native range. The documentation of phenotypic and genotypic variation of exotic plants within their invasive range is vital to understand the evolutionary potential of these species. In the case of successful invaders such as S. inaequidens, adaptive differentiation, if confirmed by further studies, may be an important factor that promotes establishment and subsequent invasions.
Acknowledgments
We thank S. Maurice for useful information about French populations and Guy Buchet for technical assistance during the whole research project. Comments from I. Nijs, R. Irwin and two anonymous reviewers on a previous version of the manuscript were highly valuable and appreciated. This research was supported by the project FRFC 2.4605.06 from the Belgian FONDS NATIONAL DE LA RECHERCHE SCIENTIFIQUE.Arnaud Monty holds a doctoral grant from the FONDS NATIONAL DE LA RECHERCHE SCIENTIFIQUE. The experiments in this study comply with the current laws of the country in which they were performed.
Electronic supplementary material The online version of this article (doi:10.1007/s00442-008-1228-2) contains supplementary material, which is available to authorized users.
References
Barrett SCH, Husband BC (1990) Genetics of plant migration and colonization. In: Brown AHD, Clegg MT, Kahler AL and Weir BS (eds) Plant population genetics, breeding and genetic resources. Sinauer Associates, pp 254-277
Blanckenhorn WU (1997) Altitudinal life history variation in the dung flies Scathophaga stercoraria and Sepsis cynipsea. Oecologia 109:342-352
Bossdorf O, Auge H, Lafuma L, Rogers WE, Siemann E, Prati D (2005) Phenotypic and genetic differentiation between native and introduced plant populations. Oecologia 144:1-11
Bossdorf O, Lipowsky A, Prati D (2008) Selection of preadapted populations allowed Senecio inaequidens to invade Central Europe. Divers Distrib 14:676-685
Callaway RM, Maron JL (2006) What have exotic plant invasions taught us over the past 20 years? Trends Ecol Evol 21:369-374 Clausen J, Keck DD, Hiesey WM (1941) Regional differentiation in plant species. Am Nat 75:231-250
Cox GW (2004) Alien species and evolution. Island Press, Washington
D'Antonio C (1993) Mechanisms controlling invasion of coastal plant communities by the alien succulent Carpobrotus Edulis. Ecology 74:83-95
Dietz H, Edwards PJ (2006) Recognition that causal processes change during plant invasion helps explain conflicts in evidence. Ecology 87:1359-1367
Ellstrand NC, Schierenbeck KA (2006) Hybridization as a stimulus for the evolution of invasiveness in plants? Euphytica 148:35-46 Endler JA (1977) Geographic variation, speciation, and clines. Princeton University Press, Princeton
Ernst WHO (1998) Invasion, dispersal and ecology of the South African neophyte Senecio inaequidens in the Netherlands: from wool alien to railway and road alien. Acta Bot Neerl 47:131-151
Etterson JR, Delf DE, Craig TP, Ando Y, Ohgushi T (2007) ParaUel patterns of clinal variation in Solidago altissima in it native range in central USA and it invasive range in Japan. Botany 86:91-97
Galen C, Shore JS, Deyoe H (1991) Ecotypic divergence in alpine Polemonium viscosum: genetic structure, quantitative variation, and local adaptation. Evolution 45:1218-1228
Galloway LF (2005) Maternal effects provide phenotypic adaptation to local environmental conditions. New Phytol 166:93-100
Gilchrist GW, Huey RB, Balanyà J, Pascual M, Serra L (2004) A time series of evolution in action: a latitudinal cline in wing size in South American Drosophila subobscura. Evolution 58:768-780
Griffith TM, Watson MA (2006) Is evolution necessary for range expansion? Manipulating reproductive timing of a weedy annual transplanted beyond its range. Am Nat 167:153-164
Guillerm JL, Floc'h El, Maillet J, Boulet C (1990) The invading weeds in the Mediterranean Basin. In: di Castri F, Hansen AJ, Debussche M (eds) Biological invasions in Europe and the Mediterranean Basin. Kluwer, Dordrecht
Hemborg AM, Karlsson PS (1998) Altitudinal variation in size effects on plant reproductive effort and somatic costs of reproduction. Ecoscience 5:517-525
Huey RB, Gilchrist GW, Carlson ML, Berrigan D, Serra L (2000) Rapid evolution of a geographic cline in size in an introduced fly. Science 287:308-309
Jovet P, Vilmorin R (1975) Troisième supplément de La flore descriptive et illustrée de La France de l'abbé Coste. Librairie Scientifique et Technique Albert Blanchard, Paris
Kliber A, Eckert CG (2005) Interaction between founder effect and selection during biological invasion in an aquatic plant. Evolution 59:1900-1913
Kolar CS, Lodge DM (2001) Progress in invasion biology: predicting invaders. Trends Ecol Evol 16:199-204
Kollmann J, Banuelos MJ (2004) Latitudinal trends essai in growth and phenology of the invasive alien plant Impatiens glandulifera (Balsaminaceae). Divers Distrib 10:377-385
Körner C (1999) Alpine plant life. Springer, Heidelberg
Kuhbier H (1977) Senecio inaequidens DC- ein Neubürger der nord-westdeutschen. Flora Abh Naturwiss Ver Bremen 43:531-536 Lacey EP (1988) Latitudinal variation in reproductive timing of a short-lived monocarp, Daucus carota (Apiaceae). Ecology 69:220-232 Lafuma L, Balkwill K, Imbert E, Verlaque R, Maurice S (2003) Ploidy level and origin of the European invasive weed Senecio inaequidens (Asteraceae). Plant Syst Evol 243:59-72
Lafuma L, Maurice S (2007) Increase in mate availability without loss of self-incompatibility in the invasive species Senecio inaequidens (Asteraceae). Oikos 116:201-208
Lebeau J, Duvigneaud J, Delvosalle L, Depasse S (1978) Senecio inaequidens DC, S. vernalis Wadst. et Kit. et S. squalidus L., trois séneçons adventices en voie d'extension progressive et de naturalisation en Belgique. Natura Mosana 31:28-36
Lee CE (2002) Evolutionary genetics of invasive species. Trends Ecol Evol 17:386-391
Leger EA, Rice KJ (2007) Assessing the speed and predictability of local adaptation in invasive California poppies (Eschscholzia
californica). J Evol Biol 20:1090-1103
Lopez-Garcia MC, Maillet J (2005) Biological characteristics of an invasive African species. Biol Invasions 7:181-194 Lousley JE (1961) A census list of wool aliens found in Britain, 1946-1960. Proc Bot Soc Br Isles 4:221-247
Maron JL, Vila M, Bommarco R, Elmendorf S, Beardsley P (2004) Rapid evolution of an invasive plant. Ecol Monogr 74:261-280 Michez JM (1995) Le séneçon du Cap, de la laine à la vigne. Phytoma 468:39-41
Mihulka S, Pysek P (2001) Invasion history of Oenothera congeners in Europe: a comparative study of spreading rates in the last 200 years. J Biogeogr 28:597-609
Montague JL, Barrett SCH, Eckert CG (2008) Re-establishment of clinal variation in flowering time among introduced populations of purple loosestrife (Lythrum salicaria, Lythraceae). J Evol Biol 21:234-245
Monty A, Stainier C, Lebeau F, Pieret N, Mahy G (2008) Seed rain pattern of the invasive weed Senecio inaequidens (Astreraceae). Belg J Bot 141:51-63
Mosseray R (1936) Matériaux pour une flore de Belgique. V. Genre Senecio. Bull Jard Bot Nat Belg 14:57-82
Parker IM, Rodriguez J, Loik ME (2003) An evolutionary approach to understanding the biology of invasions: local adaptation and general-purpose genotypes in the weed Verbascum thapsus. Conserv Biol 17:59-72
Pignatti S (1982) Flora d'Italia. Edagricole, Bologna
Pimentel D, Lach L, Zuniga R, Morrison D (2000) Environmental and economic costs of nonindigenous species in the United States. Bioscience 50:53-65
Rice KJ, Mack RN (1991) Ecological genetics of Bromus tectorum. III. The demography of reciprocally sown populations. Oecologia 88:91-101
Roach DA, Wulff RD (1987) Maternal effects in plants. Annu Rev Ecol Evol Syst 18:209-235
Sakai AK, Allendorf FW, Holt JS, Lodge DM, Molofsky J, With KA, Baughman S, Cabin RJ, Cohen JE, Ellstrand NC, McCauley DE, O'Neil P, Parker IM, Thompson JN, Weller SG (2001) The population biology of invasive species. Annu Rev Ecol Evol Syst 32:305-332
Sax DF, Stachowicz JJ, Brown JH, Bruno JF, Dawson MN, Gaines SD, Grosberg RK, Hastings A, Holt RD, Mayfield MM, O'Connor MI, Rice WR (2007) Ecological and evolutionary insights from species invasions. Trends Ecol Evol 22:465-471
Senay P (1944) Le Séneçon adventice de Mazamet. Bulletin de la Société Botanique de France 91:111-113
Sexton JP, McKay JK, Sala A (2002) Plasticity and genetic diversity may allow saltcedar to invade cold climates in North America. Ecol Appl 12:1652-1660
Siemann E, Rogers WE (2001) Genetic differences in growth of an invasive tree species. Ecol Lett 4:514-518
von Arx G, Edwards PJ, Dietz H (2006) Evidence for life history changes in high-altitude populations of three perennial forbs. Ecology 87:665-674
Weber E, Schmid B (1998) Latitudinal population differentiation in two species of Solidago (Asteraceae) introduced into Europe. Am J Bot 85:1110-1121