relationships with reading achievement in an international context
(PIRLS 2011)
Dominique Lafontaine Virginie Dupont Doriane Jaegers Patricia SchillingsUniversity of Liège, Department of Educational Science, Unit research Evaluation and Quality in Education (EQUALE)
Abstract
Using data from 48 countries, this study investigated the factorial structure and tested the cross-cultural invariance of the PIRLS 2011 reading self-concept scale and its relationships with reading achievement. The study showed that a two-factorial structure of the self-concept scale in reading had the best fit with the data. Configural invariance and metric invariance were achieved, scalar invariance was not. The two dimensions ‘Perception of competence’ and ‘Perception of difficulty’ showed robust within-country correlations with reading achievement, especially the second one. At the country level, the ‘Perception of competence’ was negatively related with reading, illustrating the attitudes-achievement paradox: countries in which students on average reported a more positive self-concept performed lower. On the contrary, for the ‘Perception of difficulty’, the sign of the correlation remained the same at the within-country and at the country level.
Keywords
Self-concept, Reading, Response-style, Cross-cultural invariance, Attitudes-achievement paradox.
Introduction
Academic self-concept is a cornerstone concept in motivation and learning theories. It is often included in large-scale assessments of achievement, as a desirable outcome of education itself or as a correlate with achievement or other motivational constructs such as intrinsic motivation and engagement.
However, including a scale of self-concept in international large-scale assessments (ILSAs) does not mean that the same construct is captured in every country, and therefore that sound and valid comparisons are allowed. Numerous variables related to practices, attitudes, beliefs of students, teachers or principals have been assessed with self-report measures in ILSAs. In most cases, Likert-type scales were used and respondents were asked to report their level of agreement or rate the frequency of their activities or behaviors. Meanwhile, it is a well-established fact that Likert scales are prone to a number of methodological biases (e.g., Buckley, 2009; He & Van de Vijver, 2015). Individual respondents may be more or less prone to response- styles such as acquiescence, extreme responding or social desirability. Additionally, systematic response-style differences have been found between social groups and between cultures or countries (He & Van de Vijver, 2013; Van de Vijver & He, 2015). Whatever their origin, these differences limit measurement validity. Therefore, it is crucial to address response-style biases, and systematically check whether cross-cultural invariance is achieved.
The present study focused on the self-concept scale used in PIRLS 2011. PIRLS (Progress in International Reading Literacy Study), developed by the International Association for the Evaluation of Educational Achievement (IEA), is an international assessment of reading literacy of grade 4 students that has been conducted every five years since 2001. Our goal was to explore the dimensions of the self-concept scale in a cross-cultural context and secondly to check whether the self-concept scale used in PIRLS was cross-culturally invariant and if not, in what way the lack of invariance impacted comparisons between countries and correlations with reading achievement within and across countries.
Reading self-concept: definition and subcomponents
Academic self-concept can be defined as the perception a person has of his/her abilities in one academic domain. It has been shown that a person has distinct self-concepts related to academic domains (e.g., mathematics, science, verbal self-self-concepts) (Byrne & Shavelson, 1986; Marsh & Shavelson, 1985; Marsh, Byrne & Shavelson, 1988). Furthermore, researchers have investigated whether specific subcomponents of self-concept can be found within an academic domain. Two kinds of subcomponents have been explored: on the one hand, a distinction between the perception of competence (“I am a good reader”) and the perception of difficulty (“I have difficulty in reading”), and on the other hand, a distinction between an internal (self-referenced) and an external frame of reference model (comparison with classmates) (Marsh, 1986;
Bong, 1998). Chapman and Tunmer (1995) administered a reading self-concept scale of 50 items to a sample of 520 students attending grade 1, 2 and 3 in New Zealand. The scale mixed positive and negative items and the format was a 5-point Likert scale (from “no, never” to “yes, always”). They tested several confirmatory factorial analyses models and found evidence that a three-factor model fitted the data better. The three factors were “perceptions of competence”, “perceptions of difficulty” and “attitudes toward reading1”. This study showed that subcomponents were already well differentiated among young children (see also Cartwright, Marshall & Wray, 2015) and highlighted how important it is to assess self-concept through different items relating to perceptions of competence and perceptions of difficulty. Usually young children’s academic self-concepts are very positive. “By including a subcomponent of reading self-concept that assesses perceptions of difficulty, children are provided with an opportunity to indicate negative perceptions. Academic self-concept scales that do not assess perceptions of difficulty and that only indicate such perceptions on the basis of negative responses to positively worded competence items may yield inflated self-concept scores” (Chapman & Tunmer, 1995, p. 165). In one of their studies, Chapman and Tunmer (1995) also showed that the “perception of difficulty” had a stronger correlation with reading comprehension among students aged 10 and 11 than the “perception of competence” factor, possibly because the “perception of competence” items are more prone to response-styles such as acquiescence or social desirability. Similarly, Klauda and Guthrie (2015) in a longitudinal study investigating relationships between several motivational and engagement constructs and reading achievement (fluency and comprehension of general and information texts), provided evidence that perceived difficulty is a stronger predictor of reading achievement than self-efficacy2. They confirmed that avoidance and devaluation negatively predict growth in engagement and motivation indicators among grade 7 students, independently of their positive counterparts – self-efficacy, engagement in reading tasks and value.
Regarding the internal/external frame of reference model (Bong, 1998; Marsh, 1986), Park (2011) claimed that he found evidence in the PIRLS 2006 self-concept scale of two factors: one self-referenced (internal) and one peer-referenced (external). It should be noted that the PIRLS self-concept scale version of 2006 was different from the 2011 version. Only one item was pretty similar in both versions. Cronbach’s alpha was respectively .53 for the two items of internal reference and .69 for the external reference ones; correlations with reading achievement were respectively .26
1
Conceptually, this third dimension (attitudes) should not be part of a well-defined measure of self-concept. As underlined by Conradi, Jang & Mc Kenna (2014) in their extensive review of the use of motivation terminology in reading research, “problems persist in how motivation-related constructs are defined and investigated” (p. 127). Self-concept is one of the two constructs, together with interest, characterized by vague definitions, unlike self-efficacy, which is usually explicitly and accurately defined.
2
Conceptually, it is a measure of self-concept rather than self-efficacy, but the authors use the term “self-efficacy”.
reference) and .32 (peer-reference). However, there was a complete overlap between internal frame of reference and perception of competence on the one hand (positive items “Reading is very easy for me” and “When I am reading by myself, I understand almost everything I read”), and external frame of reference and perception of difficulty on the other hand (negative items “I do not read as well as other students in my class” and “I read more slowly than students in my class”). Empirical evidence of two factors within the self-concept scale was found, but their interpretation is debatable.
From a methodological point of view, there is extensive evidence that whatever the construct measured, when positively and negatively worded items are balanced in a scale, positive items tend to load on one factor and negative items on a second factor (Podsakoff, McKenzie, Lee & Podsakoff, 2003). However, these results are open to different interpretations. Some researchers might interpret the two factors as reflecting two different subconstructs (such as ‘Perceived competence and ‘Perceived difficulty”), others might consider that the two factors mainly reflect “ephemeral artifacts due to wording effects that have no substantive relevance” (Marsh, Scalas & Nagengast. 2010, p. 367) and others claim that method effects linked to the wording might reflect more stable response-styles. Complex statistical approaches are necessary to disentangle trait from method such as the one developed in the studies of Marsh, Scalas & Nagengast (2010). Applying a “methodological-substantive synergy” strategy to investigate the factor structure of the Rosenberg self-esteem scale, Marsh, Scalas & Nagengast (2010) showed that a model with one factor was the worst fitting model. A two-trait model with no method effect fit the data better, but worse than all other models including method effects associated with positively and/or negatively worded items. As the authors used longitudinal data, they also found that the method effects were stable over-time; this is a critical finding “providing support for the response-style hypothesis and undermining the ephemeral artifact hypothesis” (Marsh, Scalas & Nagengast, 2010, p. 377).
Validity in cross-national comparisons
Valid cross-national comparisons do not only require instruments meeting the traditional standards of construct, content, and criterion validity; the issues of cross-national bias and equivalence also need to be addressed (He & Van de Vijver, 2012; Van de Vijver & Poortinga, 1982; Van de Vijver & Tanzer, 2004).
Invariance has to be established by conducting a set of statistical analyses aimed at testing that the same construct is measured and that items behave in the same way across cultures or countries (Cheung & Rensvold, 1999; Meredith, 1993). Different levels of equivalence/invariance have to be achieved. The first is configural invariance (i.e., the same items load on the same latent variables across countries); the second one is metric invariance (i.e., factor loadings of the latent variables are constrained to be equal across countries) and the third one is scalar invariance (i.e., items are constrained to have the same intercepts across countries). Scalar invariance is the condition for valid
comparisons of means across countries. “Invariant intercepts across countries indicate that cross-country differences in the means of the observed items are due to differences in the means of the underlying constructs, whereas differences in intercepts suggest some systematic differential attractiveness of an item across cultures” (Van de Vijver & He, 2014, p. 15).
Cross-national differences in response styles
One form of method bias that often jeopardizes the validity of international surveys is cross-national/cultural3 differences in response styles. Response styles can be defined as “a systematic tendency to respond to a range of questionnaire items on some basis other than the specific item content” (Paulhus, 1991, p. 17). The five main response styles are: (1) acquiescence response style (ARS) – a tendency to “endorse items irrespective of the item contents” (Van de Vijver & He, 2014, p. 6); (2) extreme response style (ERS) – the tendency to use the endpoints of a response scale; (3) intermediate style – the tendency to use the midpoints, also known as modesty bias; (4) social desirability – the tendency to endorse the most normative or conforming answers; and (5) non-contingent responding – erratic, random answers.
A number of studies suggest variation at both the individual (mostly according to personality traits) and the culture/country level (for a synthesis, see Yang, Harkness, Chin & Villar, 2010). Country-level differences appear to reflect cultural traditions of larger regions such as individualistic or Confucian cultures. For example, acquiescence response style (ARS) seems to be higher in Latin American countries than in the USA (e.g., Harzing, 2006; Ross & Mirowsky, 1984). Some studies also found ARS and ERS (extreme response style) to be more prevalent in the Mediterranean than in North-Western Europe (Harzing, 2006; Van Herk, Poortinga, & Verhallen, 2004) and ERS to be higher in North America than in East Asian countries (Chen, Lee, & Stevenson, 1995; Heine et al., 2001; Lee & Green, 1991; Takahashi et al., 2002). Moreover, social desirability and a common method/general response style dimension were shown to be negatively correlated with achievement at the country level (Lie & Turmo, 2015; Van De Gaer & Adams, 2010; Van de Vijver & He, 2014) and with the affluence of the country (Van de Vijver & He, 2014).
Response-styles are also discussed as one reason for a puzzling observation that has been made in several cross-national studies, i.e. the lack of correspondence between individual and aggregate country-level correlations of attitudinal constructs with achievement. More precisely, correlations of student motivation, interest, or self-concept with student achievement are positive at the student level (within-country correlations), but negative at the aggregate country level. This so-called attitude-achievement paradox has been demonstrated repeatedly in cross-national studies such
3
as PISA and TIMSS and across different subjects, grades, and cohorts (He & Van de Vijver, 2016; Kyllonen & Bertling, 2013; Lie & Turmo, 2005; Lu & Bolt, 2015; Shen & Tam, 2008; Van de Gaer, Grisay, Schulz & Gebhardt, 2012).
The attitude-achievement paradox casts doubt on the validity of cross-national comparisons of student attitudes and motivation, because there is evidence that cross-national differences in scores for scales measuring attitudes or motivational constructs do not only represent the constructs of interest. Rather, score differences between countries can also be explained by reference group effects on the one hand (Heine, Lehman, Peng & Greenholtz, 2002; Van de Gaer, Grisay, Schulz & Gebhardt, 2012), and by cultural differences in self-expression norms (e.g., Harzing, 2006; Kobayashi & Greenwald, 2003; Kurman, 2003) and in response styles (e.g., Buckley, 2009; Peng, Nisbett & Wong, 1997; Vieluf, Kunter & van de Vijver, 2013) on the other hand.
Research questions
The main research questions of the present study were the following:
1. Are the two subdimensions “perception of competence” (positive items) and “perception of difficulty” (negative items) of the self-concept scale confirmed in an international context? Does a two-factor model show a better fit than a one-factor model in different countries?4
2. Does the self-concept scale achieve the three levels of cross-cultural equivalence – configural, metric and scalar?
3. How do the subdimensions of self-concept (if they are confirmed) – “perception of competence” and “perception of difficulty” – correlate with reading achievement within countries and at the country level? Is the attitude-achievement paradox observed for both dimensions?
Hypotheses in relation to research questions
Question 1: In line with Chapman and Tunmer (1995) and with the numerous studies having shown that positive and negative items usually load on two separate factors (Marsh, Scalas & Nagengast, 2010; Podsakoff, McKenzie, Lee & Podsakoff, 2003), we expected a model with two factors – “perception of competence” (positive items) and “perception of difficulty” (negative items) – to fit the data better than a one-factor (self-concept) model (Hypothesis 1).
Question 2: In line with what is usually observed in ILSAs for Likert scales and especially self-concept in other domains (Van de Gaer et al., 2012), our expectations were that configural invariance and metric invariance would be achieved and that scalar invariance would not be achieved.
4
Question 3: Within countries, moderate positive correlations of the factor Perception of competence with reading achievement were expected (Hypothesis 2a). Regarding the factor Perception of difficulty, strong negative correlations with reading achievement were expected (Hypothesis 2b). In accordance with Chapman and Tunmer (1995) and with Klauda and Guthrie (2015), we expected the Perception of difficulty factor to show on average a stronger correlation with reading achievement than the Perception of competence factor (Hypothesis 2c).
At the country level, we expected the correlations of the factor Perception of competence with reading achievement to be negative (Hypothesis 3) and the attitudes-achievement paradox to be observed, as in previous studies investigating self-concept or other motivational constructs in an international context (He & Van de Vijver, 2016; Van de Gaer et al., 2012). Regarding the factor Perception of difficulty, no evidence could be found in the literature of correlations between a negatively oriented self-concept scale and achievement in international studies, so no specific hypothesis was formed.
Method
Database and sample
The present study used PIRLS 2011 data. In 2011, 48 education systems and 9 benchmarking participants (i.e. regions such as Andalusia or several Canadian provinces) took part in PIRLS. Participation in IEA studies varies from one study to another and from cycle to cycle. Typically, an IEA study does not include all OECD or EU countries, and many education systems from non-Western or less developed countries participate, such as Botswana, Iran, South Africa, Indonesia, Colombia or the Honduras. For the present study, the 48 participating education systems were included; the total number of students was 273 550.
In PIRLS, representative stratified student samples are drawn in each participating country using a two-stage cluster sample design: during the first stage, schools are sampled with probabilities proportional to their size (PPS) from the list of all schools in the population that contains eligible students. The schools in this list can be stratified according to important demographic variables; during the second stage, one intact classroom (or more) is selected from the target grade in each participating school.
In addition to the cognitive tests, questionnaires were administered to students, teachers, school principals and parents, in order to collect background and contextual information about a broad set of variables, such as self-concept in reading, intrinsic motivation in reading and reading practices. The number of students per country and the percentage of missing – namely the percentage of students who did not answer any of the items of the self-concept scale – are displayed in Appendix Table A1. On average,
the percentage of missing was 2.1% of the total sample. The rates of missing were quite high in some non-Western countries such as Azerbaijan, Morocco or Kuwait, and as usual, in Germany5 (10.6%).
Measures
The variables used for the present study are reading achievement and reading self-concept.
Reading achievement. PIRLS assesses students’ reading comprehension across two overarching purposes for reading: reading for literary experience and reading to acquire and use information. Four processes of comprehension are assessed: “focus on and retrieve explicitly stated information”, “make straightforward inferences”, “interpret and integrate ideas and information”, and “examine and evaluate content, language and textual elements”. Approximately half of the questions are multiple-choice, half are open-ended, requiring constructed answers (Mullis, Martin, Kennedy, Trong & Sainsbury, 2013).
Students’ answers are scaled using IRT modeling with two or three parameters or a generalized partial credit model, depending on item type (dichotomous or polytomous). A matrix sampling design has been implemented (rotation of booklets) and the plausible value methodology is used to estimate the proficiency of all students tested (https://timssandpirls.bc.edu/methods/t-achievement-scales.html). The international average is 500 and the standard deviation 100.
Reading self-concept
In 2011, reading self-concept was measured by seven items using a four-point Likert scale ranging from “agree a lot” to “disagree a lot”. Data were recoded so that “agree a lot” gets a code 4 and “disagree a lot” a code 1. The scale involved the following statements: a) “I usually do well in reading”, b) “Reading is easy for me”, c) “Reading is harder for me than for many of my classmates”, d) “If a book is interesting, I don’t care how hard it is to read”, e) “I have trouble reading stories with difficult words”, f) “My teacher tells me I am a good reader”, g) “Reading is harder for me than any other subject”. The scale involved items measuring the two dimensions identified by Chapman and Tunmer (1995) “perception of competence” (a, b, f) (beliefs regarding ability and proficiency) and “perception of difficulty” (c, e, g) (beliefs that reading is hard or problematic). Item d cannot be classified along these dimensions; this item obviously does not capture self-concept, but rather perseverance or intrinsic motivation. All the negative items (“perception of difficulty”) were affirmatively worded. They were not recoded; students who get a higher score on these items report more difficulties.
5
We do not have a specific explanation for this, but in Germany, rates of missing in questionnaire data are usually much higher than in other EU or Western countries.
Analyses
Normality of the items has been tested using the Skewness and Kurtosis tests. As non-normality was pronounced, an estimator robust to non-normality (MLR) has been used in Mplus for the following analyses (Brown, 2015).
An exploratory factorial analysis analysis (EFA) with oblique rotation (Geomin) was firstly implemented using MPlus 7.4 software (Muthén & Muthén, 1998–2015) on the pooled data set and by country. Item d was not included6. The model’s fit was estimated using the RMSEA (root mean square error of approximation) and SRMR (standardized root mean square residual) rather than Chi-square statistics because of the sensitivity of the latter to sample size. If the RMSEA and SRMR are below .05, the model’s fit is considered excellent; if they are below .08, it is considered acceptable (Kline, 2005).
Secondly, a confirmatory factorial analysis (CFA) was implemented. In order to estimate the model’s fit, the CFI (comparative fit index) and TLI (Tucker-Lewis index) were used in addition to the RMSEA and SRMR. Values above .95 reflect an excellent fit, and values above .90 an acceptable fit (Marsh, Hau & Grayson, 2005). Cronbach’s alphas of the two latent variables were computed per country and on average.
In order to estimate cross-cultural invariance, hierarchical models using multigroup confirmatory analysis (MGCFA) were applied to the two-factor solution. More precisely, the level of invariance was estimated comparing the change in the fit indices. These models were generated by introducing constraints on factor loadings and intercepts sequentially. The first model was a multigroup model without any cross-group equality (configural invariance) for the latent variables. Configural invariance means that the “items in a measure exhibit the same configuration of salient and non- salient factor loadings across cultures7” (He et al., 2017, p. 4). In the second model, a constraint of equivalence of loadings between groups (metric invariance) was added; if metric invariance was achieved, comparing correlations of the latent variables with achievement in different countries would be valid. The third model (scalar invariance) constrained the loadings and intercepts to be equivalent between groups. Only when scalar invariance was achieved would the comparison of means on the latent variables in different countries allowed and valid (He et al., 2017, p. 5).
Chi-square statistics are often used to estimate invariance between consecutive models: significant changes prove that the model varies when constraints on loadings and/or intercepts are added, meaning that it is not invariant. However, Little (1997) highlights that Chi-square comparisons are especially sensitive to sample size. Therefore, it is recommended to use other fit indices (such as CFI or RMSEA). In the
6
A preliminary EFA analysis including all the items confirmed that the item d loaded on a separate factor and did not load neither on factor 1 nor on factor 2. Therefore item d was not included in further analyses.
7
contexts of large-scale assessments with dozens of countries, Rutkowski and Svetina (2014) proposed to set the cut point of change of CFI to .02 and that of RMSEA to .03 from configural to metric models; from metric to scalar models, the changes of both CFI and RMSEA should be within .01. (Rutwoski & Svetina, 2014).
In order to answer the third research question (links with reading achievement), Pearson product-moment correlations and Spearman rank-correlations were computed, because some “outlier” countries might influence the product-moment correlations. Correlations of the Perception of competence and Perception of difficulty standardized factor scores with reading achievement (plausible values) were computed within-country and at the within-country level using SAS (version 9.4).
Results
Factorial analyses and reliability
The EFA performed in MPlus compared two different models: a one-factor and a two-factor model. The analysis of the eigen values and of the scree test (Costello & Osborne, 2005) showed that the solution with two factors was the most adequate. The one-factor model did not show good fit indices (RMSEA = .184; SRMR = .087).
Table 1
Exploratory Factor Analysis of the Reading Self-concept scale (N = 267717)
Factor Items 1 Competence 2 Difficulty
1.I usually do well in reading. .72 .00
2.Reading is easy for me. .63 -.15
3. Reading is harder for me than for many of my classmates. -.01 .73 5. I have trouble reading stories with difficult words. .00 .51
6. My teacher tells me I am a good reader. .55 .06
7. Reading is harder for me than any other subject. .00 .70
Note. Exploratory factor analysis was conducted with maximum-likelihood estimation and oblique rotation. Low factor loadings (<.35) are in grey.
The two-factor model showed satisfactory fit indices (RMSEA= .01; SRMR= .003). Items 1, 2 and 6, all positively oriented, loaded on factor 1. This factor was interpreted as a perceived competence factor. Items 3, 5 and 7, negatively oriented, loaded on factor 2. This factor was interpreted as a perceived difficulty factor. For the sake of clarity, we opted for a substantive labelling of the factors rather than a method/artifact labelling (positively/negatively worded items), even if the trait cannot be disentangled from the method effect (positive and negative items) with the approach used. A difference between positive items loading on factor 1 and negative items
loading on factor 2 is worth mentioning: while the three positive items were quite vague, referring to reading in general terms, the three negative items targeted to some extent more specific elements, referring either to an external frame of reference (other classmates) or to an internal frame of reference (reading in comparison to other subjects) or to a reading task (“stories with difficult words”), this last item being closer to self-efficacy than to self-concept (Bandura, 2006). In other words, between items loading on factor 1 and items loading on factor 2, there were substantial differences beyond the wording (positive or negative).
A CFA with maximum likelihood was then performed, using Mplus with the option complex design, cluster=school. As recommended by Mplus, on the basis of the modification indices, term errors of item 1 with item 2 and item 6 were correlated. When this was done, indices of fit were excellent: χ2(6) = 18.71 p = .005; RMSEA = .003; SRMR = .003; CFI = .99; TLI = .99. For the first latent factor, item 6 had a low factor loading. This might be due to the fact that this item (“My teacher tells me I am a good reader”) does not exactly measure self-reported perceived competence, but rather students’ perception of teacher judgment.
The Cronbach’s alpha of the two latent variables was computed on average across all countries and by country. On average, the alpha of Perceived competence was .69, and the alpha of Perceived difficulty was .68. The alpha in the different education systems for Perceived competence ranged from .50 (Saudi Arabia) to .82 (Hungary), and for Perception of difficulty from .53 (Morocco) to .76 (Poland). Typically, alphas were higher in Northern or Western countries than in Southern countries in Africa or South America. Detailed alphas per country are displayed in Appendix Table A2.
Figure 1
A path diagram of CFA representing the two-factor model of the Reading Self-concept scale
The correlation between the two factors was -.43. However, quite substantial variations of the correlations between the two factors were observed between countries (see Appendix Table A3). In the majority of countries (33 out of 48), the correlation was robust (above -.60)8; in some countries, such as in Colombia (-.14), Honduras (-.02) and Indonesia (-.18), it was substantially lower. All countries in which the correlation between the two factors was weak were non-Western countries (South America, Africa, South Asia).
8
The correlation was negative because negative items were not recoded. The negative correlation means that students who reported that they were good readers reported less difficulties in reading.
Cross-cultural invariance (MGCFA)
Table 2
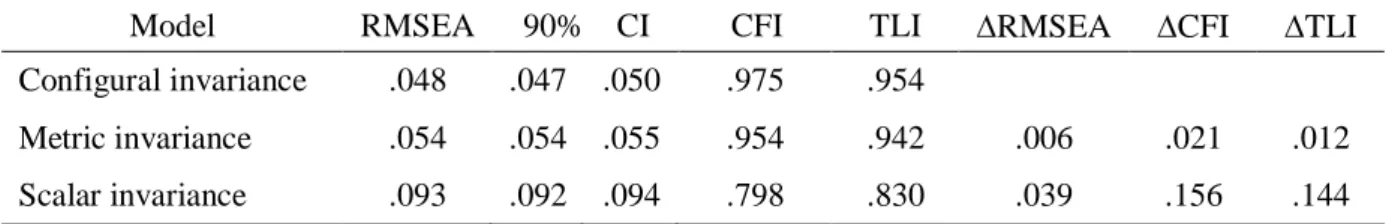
Goodness-of-fit indices for a Multiple Group Confirmatory Factor Analysis Testing Cross-National Invariance
Model RMSEA 90% CI CFI TLI RMSEA CFI TLI
Configural invariance .048 .047 .050 .975 .954
Metric invariance .054 .054 .055 .954 .942 .006 .021 .012
Scalar invariance .093 .092 .094 .798 .830 .039 .156 .144
Note: RMSEA = Root Mean Square Error of Approximation; 90%CI Confidence Interval; CFI = Comparative Fit Index; TLI = Tucker–Lewis
Table 2 presents the results of measurement invariance. The results show that configural invariance and metric invariance were achieved, but not scalar invariance. A multiple group model, which allowed for variation across countries for the factor loadings, item thresholds, residual variances, factor means, and factor variances, had a good fit (CFI = .98, TLI = .95; RMSEA = .05) according to common criteria (e.g., Hu & Bentler, 1999; Rutkowski & Svetina, 2014). When the factor loadings were restricted to be equal, the model fit dropped only slightly (ΔCFI = .02; ΔTLI = .01; ΔRMSEA = .006), but adding invariance constraints on the thresholds led to a noticeable drop in model fit (ΔCFI = .16, ΔTLI = .14; ΔRMSEA = .04), which was above the criteria suggested by Rutkowski and Svetina (2014) for cases with large samples and more than two groups. These results support the validity of cross-national comparisons of the size and strength of intra-group differences and correlations of the two subscales (which require metric invariance only), but they indicate that factor means should not be compared across countries (because they require scalar invariance).
Relationships of the self-concept subscales with reading achievement
Within countries
In every country except Honduras, the factor score Perception of competence was positively and significantly related with reading achievement. Similarly, in all countries, Perception of difficulty was negatively and significantly related with reading achievement.
Table 3
Within-country correlations of “Perception of competence” and “Perception of difficulty” with reading achievement Country Correlation between Perception of competence and achievement Correlation between Perception of difficulty and achievement Australia .43 -.52 Austria .32 -.39 Azerbaijan .18 -.29 Belgium French .37 -.48 Bulgaria .35 -.42 Botswana .36 -.50 Canada .39 -.45 Colombia .12 -.40 Croatia .35 -.41 Czech Republic .35 -.40 Germany .36 -.40 Denmark .44 -.49 England .40 -.50 Spain .28 -.37 Finland .35 -.37 France .37 -.45 Georgia .17 -.40 Hong Kong .21 -.38 Honduras -.01 -.41 Hungary .41 -.49 Indonesia .13 -.31 Ireland .37 -.46 Iran .25 -.41 Israel .36 -.46 Italy .22 -.32 Kowait .30 -.40 Lithuania .37 -.48 Morocco .21 -.33 Malta .44 -.52 Northern Ireland .32 -.46
Netherlands .32 -.33 Norway .34 -.42 New Zealand .30 -.52 Oman .38 -.38 Poland .42 -.51 Portugal .40 -.45 Qatar .29 -.52 Romania .41 -.50 Russian Federation .34 -.43 Saudi Arabia .34 -.45 Singapore .34 -.45 Slovak Republic .32 -.46 Slovenia .41 -.48 Sweden .38 -.42
Trinidad and Tobago .42 -.55
Taïwan .24 -.39
United States .37 -.44
United Arab Emirates .28 -.47
Note: All coefficients are significant at .0001, except in Honduras for Perception of competence. Within countries, students who perceived themselves as more competent in reading performed significantly better and students who perceived themselves as having more difficulty in reading performed less well. In addition, in all countries without exception, the correlations of reading achievement with Perception of difficulty were more robust (on average -.55) than the ones with Perception of competence (on average .42). All of them were above or very close to – 0.30. On the contrary, the correlations of the Perception of competence with reading were weak in some countries (Azerbaijan 0.18, Colombia 0.12, Georgia 0.17, Honduras – 0.01, Indonesia 0.13, Morocco 0.21). The difference between the two correlation coefficients varied quite substantially from one country to another.
At the country level
For the following analyses, the per country average of the two factor scores and the average reading achievement were correlated using Pearson product-moment and Spearman rank correlations. The Perception of competence (positive items) was weakly and negatively correlated with the country average of reading achievement (-.23 for the Pearson and -.29 for the rank correlation), meaning that in higher-performing countries students perceived themselves as less competent than in low-performing countries. This is a typical example of the attitude-achievement paradox, as the correlation of the Perception of competence (negative items) with reading had a different sign at the within-country level (positive correlation) and at the country level (negative
correlation). Figure 2 and Appendix Table A3 showed that it was in three Asian countries (Hong Kong, Singapore and Taïwan) that students reported the lowest levels of Perception of competence, while in Honduras and Indonesia high levels of competence were reported, which is paradoxical, as these countries performed below average.
Figure 2
Country-level product-moment Pearson correlations between “Perception of competence” and reading achievement
Conversely, the Perception of difficulty factor scores were strongly and negatively (-.70 for the Pearson and -.61 for the rank correlation) related to reading achievement at the country level, meaning that students reported more difficulty in low-performing countries (Colombia, Honduras, Morocco). In this latter case, the attitude-achievement paradox was not observed, as the sign of the correlation with reading (negative) was the same within country and at the country level.
Figure 3
Country-level product-moment Pearson correlations between “Perception of difficulty” and reading achievement
Discussion
Using data from 48 countries which participated in PIRLS 2011, our study confirmed that a two-dimensional model of the reading self-concept fit the data better than a one-dimensional model. The self-concept scale mixed positive items focusing on perceptions of competence (i.e. “Reading is easy for me”) and negative items focusing on perceptions of difficulty (i.e. “Reading is harder for me than for many of my classmates”). From a substantive (conceptual) perspective, the two-dimensional structure is consistent with Chapman and Tunmer (1995), who studied the development of students’ self-concept, attitudes and reading achievement in early primary education in New Zealand. From a method effect perspective, the findings are also congruent with the numerous studies which found that positive and negative items usually load on two separate factors (Marsh, Scalas & Nagengast, 2010). Hypothesis 1 is thus confirmed. The correlation between the two factors in our study was on average -.43, which was lower than in Chapman and Tunmer (1995) for a 9-year-old sample (correlation of .80). However, in our study, the correlation was also close to or above .80 in many Western, highly developed countries. The correlation was lower in non-Western, less affluent and low-performing countries in PIRLS such as Colombia, Honduras and Indonesia; in these countries, some students are likely to report at the same time that they feel competent in reading and have difficulties in reading, as younger students do (Marsh, 1986). One possible explanation for this is that their low level of ability in reading jeopardizes their understanding of the questions in the contextual questionnaire as low verbal ability does for young pupils.
In addition, the two items referring to an external frame of reference (other classmates) and an internal frame of reference (reading in comparison to other subjects) heavily loaded on the same factor; in our study, both items were negatively oriented. These results do not confirm the conclusions of Park (2011), who investigated the factorial structure of the PIRLS 2006 reading self-concept (although only one item was
common to the PIRLS 2006 and 2011 self-concept scales – “Reading is very easy for me”). His conclusions were that the four items of the PIRLS 2006 self-concept scale comprising two perceptions of competence (positive) items and two perceptions of difficulty (negative) items clustered under a self-referenced perceived competence (internal frame of reference) factor and a peer-referenced perceived competence (external frame of reference) factor. However, the internal vs external frame of reference (Bong, 1998; Marsh, 1986) clusters completely overlapped with the positively oriented items (perception of competence) on the one hand, and the negatively oriented items (perception of difficulty) on the other hand. The number of items was also very low (two items by factor), making their interpretation debatable.
Interestingly, the MGCFA confirmed that both configural invariance and metric invariance were achieved, meaning that a two-factor solution was acceptable in all countries. As expected, scalar invariance was not achieved. This pattern of results is similar to what has been repeatedly shown in ILSAs. When cross-cultural invariance is tested using MGCFA, most of the Likert scales show configural and metric invariance, but not scalar invariance. “It is uncommon to find support for scalar invariance in studies involving huge samples in many countries because the invariance tests are sensitive to sample size” (Van de Vijver & He, 2014, p. 17).
Regarding the relationships of the two self-concept factors – Perceived competence and Perceived difficulty – with reading achievement, several results are worth discussing. First of all, quite strong correlations of the two dimensions with reading achievement were observed within countries: positive for Perceived competence and negative for Perceived difficulty. This is consistent with the numerous cross-sectional or longitudinal studies that have investigated relationships between reading self-concept and reading comprehension (Bong, 1998; Chapman, Tunmer & Prochnow, 2000; Morgan & Fuchs, 2007; Park, 2011; Retelsdorf, Köller & Möller, 2014). Hypotheses 2a and 2b are thus confirmed. In addition, in all countries without exception, the correlations of reading achievement with Perception of difficulty were more robust (on average -.55) than those with Perception of competence (on average .42)9. Hypothesis 2 c is thus confirmed. This result is consistent with the study of Chapman and Tunmer (1995), who found a .40 correlation of Perception of competence with reading comprehension and a correlation of .53 of Perception of difficulty among 9-year-olds; among 10-year-olds, the coefficients were.43 and .65 respectively. The difference between the two correlations had about the same magnitude in our study. In a longitudinal study investigating relationships between several motivational constructs and reading comprehension for general and information texts, Klauda and Guthrie (2015) also provided evidence that perceived difficulty is a stronger
9
This higher correlation for the second factor could also be due to the fact that the factor Perception of difficulty comprises more precise items than the Perception of competence one, one of them being closer to self-efficacy, usually more correlated with achievement that self-concept (Unrau, Rueda, Son, Polanin, Lundeen & Muraszewski, 2018).
predictor of reading achievement than self-efficacy (i.e. perceived competence). This difference of robustness in the correlations of the two factors with the external criterion (reading achievement) is an indication that at least there is a substantive difference between the two-factors and not only a method effect linked to the wording of items.
What is worth mentioning in our study is that the difference between the two correlation coefficients with reading achievement varied quite substantially from one country to another. In terms of debate between trait and method, this result is more in line with a response-style/method than with a trait interpretation. As Marsh, Scalas & Nagengast (2010) has showed, applying a multimethod multitrait approach to the Rosenberg self-esteem scale comprising positive and negative items, the models with method effects have a better fit with the data than the models without method effect; in addition, as they used longitudinal data, they also found that the method effects were stable overtime. According to the authors, this critical finding has to be interpreted as “providing support for the response-style hypothesis and undermining the ephemeral artifact hypothesis” (Marsh, Scalas & Nagengast, 2010, p. 377).”
More precisely, as can be seen in Table 3, variations were less pronounced in the correlations of Perceived of difficulty (range from .29 to .55) than in the correlations of Perception of competence with reading comprehension (range from -.01 to .44). As far as Perception of competence is concerned, all the weaker correlations (close to or below .20) were found in the less affluent and low-performing countries from the South or East such as Azerbaijan, Colombia, Georgia, Indonesia, Honduras and Morocco, where response styles such as acquiescence or extreme response-styles are more often observed. This result is consistent with the findings of He and Van de Vijver (2016): “In countries of high extreme response style and/or high overclaiming, the positive association of self-report motivation is less strong than in countries of low extreme response style and/or low overclaiming” (He & Van de Vijver, 201610
, p. 15). Conversely, for Perception of difficulty, no clear pattern was observed between variations and response-styles. This suggests that the Perception of competence items were more prone to response-styles or biases than the Perception of difficulty ones, especially in a situation in which the Perception of difficulty items were affirmatively worded, meaning that the respondent had to agree if he/she acknowledged difficulties in reading. No evidence of such a contrasted pattern could be found in previous studies, but common sense and our experience in the development and analysis of questionnaires data suggest that social desirability should play less of a role for negative behaviors (reporting difficulties) than for positive ones (ability or competence). In terms
10
He & Van de Vijver (2016) computed several indicators of response-style for all participating countries in PISA 2012 (extreme response style, midpoint response style and overclaiming). Not all the PIRLS 2011 countries mentioned earlier were included, but Colombia and Indonesia were high on extreme response style, low on midpoint response style and high on overclaiming.
of extreme response-style or modesty bias, respondents have no reason either to overclaim that they have difficulties in reading or to be especially modest about it. This differential sensitivity of the positive and negative facets of self-concept to response styles or biases should also have consequences in the country-level correlations.
At the country level, the Perception of competence was negatively correlated with the country average of reading achievement. In higher-performing countries, students perceived themselves as less competent than in low-performing countries. Hypothesis 3 is thus confirmed. As surprising as it might seem, this is the typical pattern called “attitude-achievement paradox”. The result is consistent with the numerous studies that have shown an attitude-achievement paradox for self-reported measures using Likert scales in ILSAs (Kyllonen & Bertling, 2013; Lie & Turmo, 2005; Lu & Bolt, 2015; Shen & Tam, 2008; Van de Gaer, Grisay, Schulz & Gebhardt, 2012). Conversely, the Perception of difficulty scores were strongly and negatively (-.70) related to reading achievement at the country level: students reported more difficulty in low-performing countries (Colombia, Honduras, Morocco had the highest scores).
Interpreting this spectacular difference between the positive and negative facets of self-concept is challenging. The absence of attitude-achievement paradox in the relationship between Perceived difficulty (or negatively oriented items) and reading achievement might result from a lower prevalence of some typical cross-cultural response styles when the respondent has to agree that he/she faces difficulties: why would students agree or strongly agree that they face difficulties - which is not a socially desirable behavior - or why would they be especially modest about it?
Limitations and perspectives
The results of the present study are clearly restricted to the specific way self-concept was measured in PIRLS 2011, namely through three positively worded items capturing the Perception of competence – “I usually do well in reading”, “Reading is easy for me” and “My teacher tells me I am a good reader” and three negatively oriented items capturing the Perception of difficulty – “Reading is harder for me than for many of my classmates”, “I have trouble reading stories with difficult words” and “Reading is harder for me than any other subject”. One specific characteristic of the scale is that the negative set of items (difficulty) was affirmatively worded; students who face difficulties have to agree with the negatively oriented items.
The two factors in the model based on EFA (oblique factors) which was found to fit better the data were labelled and partially interpreted in psychological terms; one factor was labelled “perception of competence” (positive items) and the second one “perception of difficulty” (negative items). Nevertheless, it should be acknowledged that another interpretation is possible, in terms of method effect. There is evidence that “reverse-coded items may produce artifactual response factors consisting exclusively of
negatively worded items” (Podsakoff, McKenzie, Lee & Podsakoff, 2003, p. 884). In our simplistic EFA approach, if method effects exist linked to the item wording, they are confounded with the trait. Even if some indications could be found that the negative factor (perception of difficulty) is not only an artifact, such as the difference in the robustness of the two factors with reading achievement and the absence of attitude-achievement paradox, the fact remains that in the present study the analyses used did not allow to disentangle the method from the trait. This leads to be especially cautious in the interpretation of the factors, even if the ambition of our study was not to contribute to the evidence about the controversy trait-method.
If it were the case, more sophisticated approaches based on multitrait– multimethod models (correlated uniqueness CU or latent strategy factor LMF) should have been used to unconfound trait effects from method effects.
Conclusions and practical implications
The present study using PIRLS data provided good evidence of a two-factorial structure of the self-concept scale in reading mixing positive and negative items. As expected, configural invariance and metric invariance were achieved, while scalar invariance was not. The two subdimensions Perception of competence (positive items) and Perception of difficulty (negative items) showed robust within-country correlations with reading achievement, especially the second one, which was negatively correlated with reading achievement in all countries without exception. At the country level, the correlation of the Perception of competence with reading achievement was negative, illustrating the attitude-achievement paradox: countries in which students reported a more positive self-concept performed at a lower level. On the contrary, for the Perception of difficulty, the attitude-achievement paradox was not observed, which is really unusual for motivational constructs: the countries in which students reported more difficulties were indeed the lowest-performing ones.
In the discussion of their paper, Chapman and Tunmer (1995) recommended, on psychological grounds, that negative items on self-concept scales should be kept rather than eliminated. They argued that “by including a subcomponent of reading self-concept that assesses perceptions of difficulty, children are provided with an opportunity to indicate negative perceptions. Academic self-concept scales that do not assess perceptions of difficulty and that only indicate such perceptions on the basis of negative responses to positively worded competence items may yield inflated self-concept scores” (Chapman & Tunmer, 1995, p. 165). They thus seem to suggest that competence items are more prone to response-style biases such as overclaiming or social desirability. Our study comes to similar conclusions. Our investigation of the links between the positive and negative factors of the self-concept scale leaves no doubt that including negatively oriented items (Perception of difficulty) had added value, especially in a context of international comparisons. The attitude-achievement paradox, which was observed for the Perception of competence (positive items), suggest that
cross-cultural response styles were an issue and that the measurement of the construct was contaminated by unintended noise or nuisance. A similar phenomenon was not observed for the negative items (Perception of difficulty). On that basis, it seems reasonable to keep including negative items in self-concept scales in international or cross-cultural contexts, because Perception of difficulty or negatively oriented items seem less affected by response-style biases and therefore provide a more valid and cross-culturally stable measure of self-concept than the positive items do.
References
Bandura, A. (2006). Guide for constructing self-efficacy scales. In F. Pajares & T. Urdan (Eds.). Self-efficacy beliefs of adolescents (pp. 307-337). Greenwich, CT: Information age.
Bong, M. (1998). Test of the internal/external frames of reference model with subject-specific academic self-efficacy and frame-subject-specific academic self-concepts. Journal of Educational Psychology, Vol. 90, s1, 102-110.
Brown, T.A. (2015). Confirmatory Factor Analysis for applied research, second edition. New-York: The Guilford Press.
Buckley, J. (2009). Cross-National response styles in international educational assessments: Evidence from PISA 2006. Retrieved from https://edsurveys.rti.org/PISA/documents/Buckley_PISAresponsestyle.pdf Byrne, B.M., & Shavelson, R.J. (1986). On the structure of adolescent self-concept.
Journal of Educational Psychology, 78, 474-481. Doi: 10.1037//0022-0663.78.6.474
Cartwright, K.B., Marshall, T.R., & Wray, E. (2016). A longitudinal study of the role of reading motivation in primary students’ reading comprehension: Implications for a less simple view of reading. Reading Psychology, 37(1), 55-91. Doi: 10.1080/02702711.2014.991481
Chapman, J. W., & Tunmer, W. E. (1995). Development of young children’s reading self-concepts: An examination of emerging subcomponents and their relationship with reading achievement. Journal of Educational Psychology, 87, 154–167.
Chapman, J.W., Tunmer, W.E., & Prochnow, J.E. (2000). Early reading-related skills and performance, reading concept and the development of academic self-concept: A longitudinal Study. Journal of Educational Psychology, Vol. 92, 4, 703-708.
Chen, C., Lee, S., & Stevenson, H. W. (1995). Response-style and cross-cultural comparisons of rating scales among East Asian and North American students. Psychological Sciences, 6, 170–175. doi:10.1177/0146621697211001
Cheung, G. W., & Rensvold, R. B. (1999). Testing factorial invariance across groups: A reconceptualization and proposed new method. Journal of Management, 25, 1– 27. doi:10.1177/014920639902500101
Conradi, K., Jang, B.G., & McKenna, M.C. (2014). Motivation terminology in reading research: A conceptual review. Educational Psychology Review, 26, 127-164. Doi 10.1007/s10648-013-9245-z
Harzing, A.W. (2006). Response styles in cross-national survey research: A 26-country study. International Journal of Cross Cultural Management, 6, 243–266. doi:10.1177/1470595806066332
He, J., Buchholz, J., & Klieme, E. (2017). Effects of anchoring vignettes on comparability and predictive validity of student self-reports in 64 cultures.
Journal of Cross-Cultural Psychology, 48, 319-334. doi:10.1177/0022022116687395
He, J., & Van de Vijver, F. J. R. (2012). Bias and equivalence in cross-cultural research. Online readings in Psychology and Culture, 2. doi:10.9707/2307-0919.1111 He, J., & Van de Vijver, F. J. R. (2013). A general response style factor: Evidence from
a multi-ethnic study in the Netherlands. Personality and Individual Differences, 55, 794-800. doi:10.1016/j.paid.2013.06.017
He, J., & Van de Vijver, F. J. R. (2015). The value of keeping an open eye for methodological issues in research on resilience and culture. In L. Theron, M. Ungar & L. Liebenberg (Eds.), Youth resilience and culture. Commonalities and complexities (pp. 189-201). New York, NY: Springer.
He, J., & Van de Vijver, F. J. R. (2016). The motivation-achievement paradox in international educational achievement tests: Toward a better understanding. In R. B. King & A. B. I. Bernardo (Eds.), The psychology of Asian Learners. A Festschrift in honor of David Watkins (pp. 253-268). Singapore: Springer. doi:10.1007/978-981-287-576-1
Heine, S. J., Kitayama, S., Lehman, D. R., Takata, T., Ide, E., Leung, C., & Matsumoto, H. (2001). Divergent consequences of success and failure in Japan and North America: An investigation of self-improving motivations and malleable selves. Journal of Personality and Social Psychology, 81, 599-615. doi:10.1037/0022-3514.81.4.599
Heine, S. J., Lehman, D. R., Peng, K., & Greenholtz, J. (2002). What’s wrong with cross-cultural comparisons of subjective Likert scales: The reference-group problem. Journal of Personality and Social Psychology, 82, 903-918. doi:10.1037/0022-3514.82.6.903
Hu, L., & Bentler, P. M. (1999). Cutoff criteria for fit indexes in covariance structure analysis: Conventional criteria versus new alternatives. Structural Equation Modeling, 6, 1-55. doi:10.1080/10705519909540118
Klauda, S. L., & Guthrie, J. T. (2014). Comparing relations of motivation, engagement, and achievement among struggling and advanced adolescent readers. Reading and Writing, 28, 239-269.
Kline, R. B. (2005). Principles and practice of structural equation modeling (2nd ed.). New York, NY: Guilford Press
Kobayashi, C., & Greenwald, A. J. (2003). Implicit-explicit differences in self-enhancement for Americans and Japanese. Journal of Cross-Cultural Psychology, 34, 522–541. doi:10.1177/0022022103257855
Kurman, J. (2003). Why is self-enhancement low in certain collectivist cultures? An investigation of two competing explanations. Journal of Cross-Cultural Psychology, 34, 496–510. doi:10.1177/0022022103256474
Kyllonen, P., & Bertling, J. (2013). Innovative questionnaire assessment methods to increase cross-cultural comparability. In L. Rutkowski, M. von Davier & D. Rutkwoshi (Eds.), Handbook of International Large-Scale Assessment:
Background, Technical Issues and Methods of Data Analysis (pp. 277–285). Boca Raton, FL: Chapman & Hall/CRC.
Lee, C., & Green, R.T. (1991). Cross-cultural examination of the Fishbein Behavioral Intentions Model. Journal of International Business Studies, 22, 289–305. doi:10.1057/palgrave.jibs.8490304
Lie, S., & Turmo, A. (2005). Cross-country comparability of students’ self-reports Evidence from PISA 2003. Internal Working OECD/PISA document, TAG(0505)11.
Little, T. D. (1997). Mean and covariance structures (MACS) analyses of cross-cultural data: Practical and theoretical issues. Multivariate Behavioral Research, 32, 53–76.
Lu, Y., & Bolt, D. (2015). Examining the attitude-achievement paradox in PISA using a multilevel multidimensional IRT model for extreme response style. Large-scale Assessments in Education, 3. DOI 10.1186/s40536-015-0012-0
Marsh, H. W. (1986). Verbal and math self-concepts: An internal/external frame of reference model. American Research Journal, 23, 129-149.
Marsh, H.W., Byrne, B.M., & Shavelson, R.J. (1988). A multifaceted academic self-concept: Its hierarchical structure and its relations to academic achievement. Journal of Educational Psychology, 80(3), 366-380. Doi: 10.1037/0022-0663.80.3.366
Marsh, H.W., & Shavelson, R.J. (1985). Self-concept: Its multifaceted, hierarchical
structure. Educational Psychologist, 230, 107-125.
Doi:10.1207/s15326985ep2003_1
Marsh, H. W., Hau, K.-T., & Grayson, D. (2005). Goodness of fit evaluation in structural equation modelling. In A. Maydeu-Olivares & J. McArdle (Eds.), Contemporary psychometrics: A festschrift for Roderick P. McDonald (pp. 275–340). Mahwah, NJ: Erlbaum.
Marsh, H.W., Trautwein, U., Lüdtke, O., Köller, O., & Baumert, J. (March/April 2005). Academic self-concept, interest, grades, and standardized test scores: Reciprocal effects models of causal ordering. Child Development, Vol. 76, 2, 397-416.
Marsh, H.W., Scalas, L. F., & Nagengast, B. (2010). Longitudinal test of competing factor structure for the Rosenberg self-esteem scale: traits, ephemeral artifacts and stable response styles. Psychological assessment, 22, 2, 366-381.
Meredith, W. (1993). Measurement invariance, factor analysis, and factorial invariance. Psychometrika, 58, 525–542. doi:10.1007/BF02294825
Morgan, P.L., & Fuchs, D. (2007). Is there a bidirectional relationship between children’s reading skills and reading motivation? Exceptional Children, 73(2), 165-183.
Mullis, I., Martin, M. O., Kennedy, A. M., Trong, K. L., & Sainsbury, M. (2013). PIRLS 2011 Assessment Framework. IEA International Association for the Evaluation of Educational Achievement. Boston College.
Muthén, L., & Muthén, B. (1998-2015). Mplus User’s Guide (Seventh Edition). Los Angeles, CA: Muthén, & Muthén.
Park, Y. (2011). How motivational constructs interact to predict elementary students’ reading performance: Examples from attitudes and self-concept in reading. Learning and individual Differences, 21, 347-358.
Paulhus, D. L. (1991). Measurement and control of response bias. In J. P. Robinson, P. R. Shaver & L. S. Wrightsman (Eds.), Measures of personality and social psychological attitudes (pp.17–59). San Diego, CA: Academic Press, Inc. Peng, K., Nisbett, R. E., & Wong, N. Y (1997). Validity problems comparing values
cultures and possible solutions. Psychological Methods, 2, 329–344. doi:10.1037/1082-989X.2.4.329
Podsakoff, P. M., McKenzie, S. B., Lee, J. Y. & Podsakoff, N. P. (2003). Common method biases in behavioural research: a critical review of the literature and recommended remedies. Journal of Applied Psychology, 88, 879–903. doi:10.1037/0021-9010.88.5.879
Poortinga, Y. H. (1989). Equivalence of cross cultural data: An overview of basic issues. International Journal of Psychology, 24, 737–756.
Retelsdorf, J. Köller, O., & Möller, J. (2014). Reading achievement and reading self-concept – Testing the reciprocal effects model. Learning and Instruction, 29, 21-30.
Rutkowski, L. & Svetina, D. (2014). Assessing the hypothesis of measurement invariance in the context of large-scale international surveys. Educational and Psychological Measurement, 74, 31–57. doi:10.1177/0013164413498257 Schiefele, U., Schaffner, E., Möller, J., & Wigfield, A. (2012). Dimensions of reading
motivation and their relation to reading behavior and competence. Reading Research Quarterly, 47(4), 427-463. doi: 10.1002/RRQ.030
Shen, C., & Tam, H. P. (2008). The paradoxical relationship between student achievement and self-perception: a cross-national analysis based on three waves of TIMSS data. Educational Research and Evaluation, 14, 87–100. doi:10.1080/13803610801896653
Takahashi, K., Ohara, N., Antonucci, T. C., & Akiyama, H. (2002). Commonalities and differences in close relationships among the Americans and Japanese: A comparison by the individualism/collectivism concept. International Journal of Behavioral Development, 26, 453–465. doi:10.1080/01650250143000418 Unrau, N. J., Rueda, R., Son, E., Polanin, J. R., Lundeen, R. J. & Muraszewski, A. K.
(2018). Can reading self-efficacy be modified? A meta-analysis of the impact of interventions on reading self-efficacy. Review of educational research, 88, 2, 167-204. doi: 10.3102/00344654317743199
Van de Gaer, E., & Adams, R. (2010). The modeling of response-style bias: an answer to the attitude-achievement paradox? Paper presented at the annual conference of the AERA, Denver, Colorado, 30 April-4 May.
Van de Gaer, E., Grisay, A., Schlutz, W., & Gebhardt, E. (2012). The reference group effect: An explanation of the paradoxical relationship between academic achievement and self-confidence across countries. Journal of Cross-Cultural Psychology, 43, 1205–1228. doi:10.1177/0022022111428083
Van de Vijver, F. J. R., & He, J. (2014). Report on social desirability, midpoint and extreme responding in TALIS 2013. OECD Education Working Papers, No. 107. Paris, France: OECD Publishing.
Van de Vijver, F.J.R., & Poortinga, Y. (1982). Cross-Cultural generalization and universality. Journal of Cross-Cultural Psychology, 13, 387–408. doi:10.1177/0022002182013004001
Van de Vijver, F.J.R., & Tanzer, N. K. (2004). Bias and equivalence in cross-cultural assessment: An overview. Revue Européenne de Psychologie Appliquée/European Review of Applied Psychology, 54,119–135. doi:10.1016/j.erap.2003.12.004
Van Herk, H., Poortinga, Y.H., & Verhallen, T.M.M. (2004). Response styles in rating scales: Evidence of method bias in data from 6 EU countries. Journal of Cross-Cultural Psychology, 35, 346–360. doi:10.1177/0022022104264126
Vieluf, S., Kunter, M., & van de Vijver, F. J. R. (2013). Teacher self-efficacy in cross-national perspective. Teaching and Teacher Education, 35, 92–103. doi:10.1016/j.tate.2013.05.006
Wigfield, A., & Guthrie, J. T. (1997b). Relations of children's motivation for reading to the amount and breadth or their reading. Journal of Educational Psychology, 89(3), 420.
Yang, Y., Harkness, J. A., Chin, T.-Y., & Villar A. (2010). Response styles and culture. In J. A. Harkness, M. Braun, B. Edwards, T. P. Johnson, L. Lyberg, P. Ph. Mohler, B-E. Pennell & T. W. Smith (Eds.), Survey methods in multinational, multiregional, and multicultural contexts (pp. 203–223). USA: John Wiley & sons.
Appendices
Table A1
Number of sampled pupils and percentage of missing data by country
Country N % of missing Australia 6126 2.4 Austria 4670 1.5 Azerbaijan 4881 6.2 Belgium French 3727 1.3 Bulgaria 5261 1.1 Botswana 4197 1.1 Canada 23206 2 Colombia 3966 3 Croatia 4587 0.5 Czech Republic 4556 1.5 Germany 4000 10.6 Denmark 4594 2.1 England 3927 0.6 Spain 8580 1.1 Finland 4640 1.1 France 4438 0.9 Georgia 4796 1.9 Hong Kong 3875 1.4 Honduras 3893 1.7 Hungary 5204 1.8 Indonesia 4791 1.7 Ireland 4524 1.9 Iran 5758 0.6 Israel 4186 1.9 Italy 4189 2.1 Kowait 3363 10.4 Lithuania 4661 1.3 Morocco 7805 5.5 Morocco (6th grade) 7183 3.8 Malta 3598 2.9 Northern Ireland 3586 2 Netherlands 3995 1 Norway 3190 3.2 New Zealand 5644 2.7
Oman 10394 1.7 Poland 5005 1 Portugal 4085 1.1 Qatar 4120 3.3 Romania 4665 1.1 Russian Federation 4461 0.3 Saudi Arabia 4507 1.5 Singapore 6367 1.5 Slovak Republic 5630 0.5 Slovenia 4512 1.4 Sweden 4622 2.5
Trinidad and Tobago 3948 1.3
Taïwan 4293 0.3
United Arab Emirates 14618 2.7
USA 12726 1.8
Note: Percentage of missing is equal to the percentage of pupils who did not answer any of the items of the PIRLS self-concept scale.