HAL Id: hal-01488978
https://hal.archives-ouvertes.fr/hal-01488978
Submitted on 14 Mar 2017
HAL is a multi-disciplinary open access archive for the deposit and dissemination of sci-entific research documents, whether they are pub-lished or not. The documents may come from teaching and research institutions in France or abroad, or from public or private research centers.
L’archive ouverte pluridisciplinaire HAL, est destinée au dépôt et à la diffusion de documents scientifiques de niveau recherche, publiés ou non, émanant des établissements d’enseignement et de recherche français ou étrangers, des laboratoires publics ou privés.
Identification of Road User related Risk Factors.
SAfetyCube Deliverable 4.1
Rachel Talbot, Eva Aigner-Breuss, Susanne Kaiser, Raffaele Alfonsi, Eveline
Braun, Anita Eichhorn, Virginie Etienne, Ashleigh Filtness, Catherine
Gabaude, Charles Goldenbeld, et al.
To cite this version:
Rachel Talbot, Eva Aigner-Breuss, Susanne Kaiser, Raffaele Alfonsi, Eveline Braun, et al.. Identifi-cation of Road User related Risk Factors. SAfetyCube Deliverable 4.1. [Research Report] IFSTTAR - Institut Français des Sciences et Technologies des Transports, de l’Aménagement et des Réseaux. 2016, 541 p. �hal-01488978�
Identification of Road User related
Risk Factors
SafetyCube | Deliverable 4.1 | WP4 | Final 3
Identification of Road User related Risk
Factors
Work package 4, Deliverable 4.1
Please refer to this report as follows:Talbot, R., Aigner-Breuss, E., Kaiser, S., Alfonsi, R., Braun, E., Eichhorn, A., Etienne, V., Filtness, A., Gabaude, C., Goldenbeld, C., Hay, M., Jänsch, M., Leblud, J., Leskovšek, B., Paire-Ficout, L., Papadimitriou, E., Pilgerstorfer, M., Rußwurm, K., Sandin, J., Soteropoulos, A., Strand, N., Theofilatos, A., Van Schagen, I., Yannis, G., Ziakopoulos, A. (2016), Identification of Road User Related Risk Factors, Deliverable 4.1 of the H2020 project SafetyCube.
Grant agreement No 633485 - SafetyCube - H2020-MG-2014-2015/ H2020-MG-2014_TwoStages Project Coordinator:
Professor Pete Thomas, Transport Safety Research Centre, Loughborough Design School, Loughborough University, Ashby Road, Loughborough, LE11 3TU, UK
Project Start date: 01/05/2015 Duration: 36 months
Organisation name of lead contractor for this deliverable:
Loughborough University, UK
Report Author(s):
Talbot, R., Filtness, A. (LOUGH), United Kingdom
Aigner-Breuss, E., Kaiser, S., Braun, E. Eichhorn, A., Pilgerstorfer, M., Rußwurm, K., Soteropoulos, A. (KFV), Austria Alfonsi, R. (CTL), Italy
Hay, M., Etienne, V., Gabaude, C., Paire-Ficout, L. (IFSTTAR), France Goldenbeld, C., Van Schagen, I., (SWOV), Netherlands
Jänsch, M. (MHH), Germany Leblud, J. (BRSI), Belgium Leskovšek, B. (AVP), Slovenia
Ziakopoulos, A., Theofilatos, A., Papadimitriou, E., Yannis, G. (NTUA), Greece Sandin, J., Strand, N. (SAFER, VTI), Sweden
Due date: 01/11/2016 Submission date: 01/11/2016
Project co-funded by the by the Horizon 2020 Framework Programme of the European Union Version: Final
Dissemination Level: PU Public
Co-funded by the Horizon 2020
SafetyCube | Deliverable 4.1 | WP4 | Final 4
Table of contents
Executive summary ... 7
1
Introduction ... 9
1.1 SafetyCube ... 9
1.2 Purpose of this deliverable ... 10
2
Identification and prioritisation of risk factors ... 11
2.1 What is a risk factor? ... 11
2.2 Taxonomy of human related risk factors ... 11
2.3 Hot topics and priorities in road safety ... 13
3
Study selection and coding ... 15
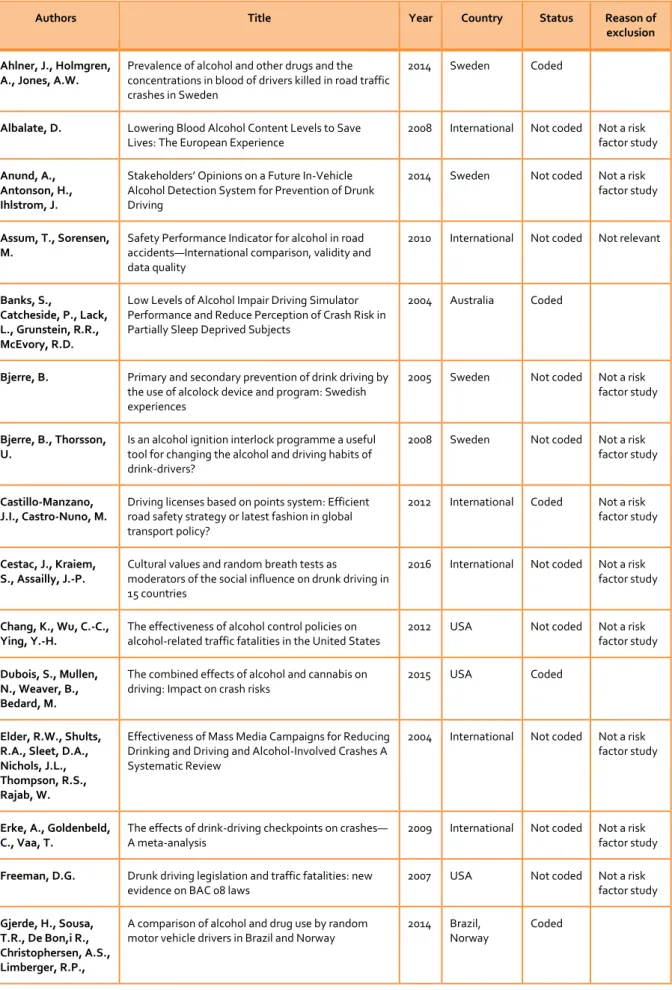
3.1 Literature search ... 15
3.2 Study Selection ... 15
3.3 Study Coding ... 17
4
Analysis and summary ... 18
4.1 Human related in-depth crash data ... 19
5
Risk factor synopses - Abstracts ... 22
5.1 Colour Code explanation ... 23
5.2 Influenced Driving - Alcohol ... 23
5.3 Influenced Driving - Drugs (Legal & Illegal) ... 24
5.4 Speeding and inappropriate speed ... 24
5.5 Traffic Rule Violations - Red light running ... 25
5.6 Risk taking - Overtaking ... 25
5.7 Risk taking - Close following Behaviour ... 25
5.8 Distraction - Cell phone use - handheld ... 26
5.9 Distraction - Cell phone use - hands-Free ... 26
5.10 Distraction - Cell phone use - Texting ... 27
5.11 Distraction - Music - entertainment systems ... 27
5.12 Distraction - Operating Devices ... 27
5.13 Distraction - Cognitive overload, inattention ... 28
5.14 Distraction - Conversation with passengers ... 28
5.15 Distraction - Outside of Vehicle ... 29
5.16 Fatigue - Not enough sleep, Driving While Tired ... 29
5.17 Fatigue: Sleep disorders - Sleep Apnea ... 29
5.18 Insufficient Knowledge and Skills ... 30
SafetyCube | Deliverable 4.1 | WP4 | Final 5
5.20 Functional Impairment - Cognitive impairment ... 31
5.21 Functional Impairment - Hearing Loss ... 31
5.22 Functional Impairment - Vision loss ... 31
5.23 Diseases and Disorders - Diabetes ... 32
5.24 Personal Factors - Sensation seeking ... 32
5.25 Personal Factors - ADHD ... 33
5.26 Emotions - Anger, aggression ... 33
6
Conclusions ... 34
6.1 Discussion of Results ... 34
6.2 Conclusions and Next steps ... 35
References ... 37
List of Abbreviations ... 39
Appendix A: Taxonomy and prioritisation (‘hot topics’) of human related risk factors .. 41
Appendix B: ACAS code list of human causation factors ...46
Appendix C: Stakeholder workshops – list of participants ...49
SafetyCube | Deliverable 4.1 | WP4 | Final 7
Executive summary
Safety CaUsation, Benefits and Efficiency (SafetyCube) is a European Commission supported Horizon 2020 project with the objective of developing an innovative road safety Decision Support System (DSS). The DSS will enable policy-makers and stakeholders to select and implement the most appropriate strategies, measures, and cost-effective approaches to reduce casualties of all road user types and all severities.
This document is the first deliverable (4.1) of work package 4 which is dedicated to identifying and assessing human related risk factors and corresponding countermeasures as well as their effect on road safety. The focus of deliverable 4.1 is on identification and assessment of risk factors and describes the corresponding operational procedure and corresponding outcomes. The following steps have been carried out:
Identification of human related risk factors – creation of a taxonomy
Consultation of relevant stakeholders and policy papers for identification of topic with high priority (‘hot topics’)
Systematic literature search and selection of relevant studies on identified risk factors Coding of studies
Analysis of risk factors on basis of coded studies Synopses of risk factors, including accident scenarios
The core output of this task are synopses of risk factors which will be available through the DSS. Within the synopses, each risk factor was analysed systematically on basis of scientific studies and is further assigned to one of four levels of risk (marked with a colour code). Essential information of the more than 180 included studies were coded and will also be available in the database of the DSS. Furthermore, the synopses contain theoretical background on the risk factor and are prepared in different sections with different levels of detail for an academic as well as a non-academic audience. These sections are readable independently.
It is important to note that the relationship between road safety and road user related risk factors is a difficult task. For some risk factors the available studies focused more on conditions of the
behaviour (in which situations the behaviour is shown or which groups are more likely to show this behaviour) rather than the risk factor itself. Therefore, it cannot be concluded that those risk factors that have not often been studied or have to rely more indirect and arguably weaker methodologies, e.g. self-reports , do not increase the chance of a crash occurring.
The following analysed risk factors were assessed as ‘risky’, ‘probably risky’ or ‘unclear’. No risk factors were identified as ‘probably not risky’.
SafetyCube | Deliverable 4.1 | WP4 | Final 8
Risky Probably risky Unclear
• Influenced driving – alcohol • Influenced Driving – drugs
(legal & illegal)
• Speeding and inappropriate speed
• Traffic rule violations – red light running
• Distraction – cell phone use (hand held)
• Distraction – cell phone use (hands free)
• Distraction – cell phone use (texting)
• Fatigue – sleep disorders – sleep apnea
• Risk taking – overtaking • Risk taking – close following
behaviour
• Insufficient knowledge and skills
• Functional impairment – cognitive impairment • Functional impairment –
vision loss
• Diseases and disorders – diabetes
• Personal factors – sensation seeking
• Personal factors – ADHD • Emotions – anger, aggression • Fatigue – Not enough
sleep/driving while tired • Distraction – conversation
with passengers • Distraction – outside of
vehicle
• Distraction – cognitive overload and inattention
• Functional impairment – hearing loss (few studies) • Observation errors (few studies) • Distraction – music –
entertainment systems (many studies, mixed results)
• Distraction – operating devices (many studies, mixed results)
The next step in SafetyCube’s WP4 is to identify and assess the effectiveness of measures and to establish a link to the identified risk factors. The work of this first task indicates a set of risk factors that should be centre of attention when identifying corresponding road safety measures (category ‘risky’).
SafetyCube | Deliverable 4.1 | WP4 | Final 9
1 Introduction
1.1 SAFETYCUBESafety CaUsation, Benefits and Efficiency (SafetyCube) is a European Commission supported Horizon 2020 project with the objective of developing an innovative road safety Decision Support System (DSS) that will enable policy-makers and stakeholders to select and implement the most appropriate strategies, measures and cost-effective approaches to reduce casualties of all road user types and all severities.
SafetyCube aims to:
1. develop new analysis methods for (a) Priority setting, (b) Evaluating the effectiveness of measures (c) Monitoring serious injuries and assessing their socio-economic costs (d) Cost-benefit analysis taking account of human and material costs
2. apply these methods to safety data to identify the key accident causation mechanisms, risk factors and the most cost-effective measures for fatally and seriously injured casualties
3. develop an operational framework to ensure the project facilities can be accessed and updated beyond the completion of SafetyCube
4. enhance the European Road Safety Observatory and work with road safety stakeholders to ensure the results of the project can be implemented as widely as possible
The core of the project is a comprehensive analysis of accident risks and the effectiveness and cost-benefit of safety measures focusing on road users, infrastructure, vehicles and injuries framed within a systems approach with road safety stakeholders at the national level, EU and beyond having involvement at all stages.
Work Package 4
The objective of work package 4 is to analyse data, implement developed methodologies (WP3) concerning accident risk factors and road safety measures related to the road users. It examines accident risks and safety measures concerning all types of road users including Vulnerable Road Users (VRU). Personal as well as commercial transportation aspects are taken into account. Therefore, various data sources (macroscopic and in-depth accident data) and knowledge bases (e.g. existing studies) will be exploited in order to:
Identify and rank risk factors related to the road use Identify measures for addressing these risk factors Assess the effect of measures
The work on human related risks and measures in road traffic is done according to the
methodologies and guidelines developed in WP3 (Martensen et al., 2017) and uniform and in parallel with the work packages dealing with infrastructure (WP5) and vehicle (WP6) related risks and measures. Furthermore, the latter process is monitored and steered by WP8.
All main results of WP4 will be integrated into the DSS and linked with each other (risk factors and measures) and with outcomes of other work packages (WPs 5, 6, and 71).
1 WP7 is dealing with serious injuries.
SafetyCube | Deliverable 4.1 | WP4 | Final 10
1.2 PURPOSE OF THIS DELIVERABLE
This deliverable reports on the work in Task 4.1. The overall aim of Task 4.1 was to identify road user related risk factors. However, it comprises additional tasks like in-depth accident analysis and the identification of knowledge gaps in order to get to the bottom of contributing road accident factors and as a basis for the next step of identifying related countermeasures.
This deliverable is dedicated to present the process of identifying, selecting, analysing and assessing road safety risk factors related to humans and their behaviour as well as its outcomes. The following steps were taken towards achieving the common purpose of SafetyCube and are described in detail in this deliverable:
Identification of human related risk factors – creation of a taxonomy Consultation of relevant stakeholders for ‘hot topic’ identification
Systematic literature search and selection of relevant studies on identified risk factors Coding of studies
Analysis of risk factors on basis of coded studies Synopses of risk factors (including accident scenarios)
The main results of deliverable 4.1 will be a variety of systematically analysed risk factors,
documented in risk factor ‘synopses’ which will be incorporated into the Safety Cube DSS and linked to corresponding road safety measures and cost-benefit-analyses of certain measures. As the synopses are very comprehensive, they form individual documents appended to this one and will be made available separately via the project website (www.safetycube-project.eu/) and on the DSS when it is launched. However, an overview of the risk factor-synopses can be found in this deliverable as well as all related abstracts.
It is crucial to note that the overall approach of SafetyCube – to quantify risk factors and assess measures quantitatively – is challenging to apply when human decision making and behaviour come into play. Human related risk factors are often not directly observable (e.g. a personality trait or fatigue) or have similar characteristics that make it difficult to distinguish between them. This requires the presence of such ‘unobservable’ risk factors to be inferred. Furthermore, human road safety risk factors tend not to occur as a singular phenomenon but in interaction with other (human) factors. Thus, the methods to determine them are manifold and sometimes vary considerably making it difficult to compare the outcomes. We are frequently dealing with studies which are investigating the effect of a risk factor on Safety Performance Indicators (SPI) such as self-reported behaviour or driving simulator measures, as opposed to the direct link between the risk factor and accidents. While the considered SPIs are either assumed or known to be linked to road safety, the relationship is sometimes indirect and cannot always be quantified
.
Taking all this into account makes it vital to provide qualitative information for each risk factor or road safety measure alongside the quantitative assessment.SafetyCube | Deliverable 4.1 | WP4 | Final 11
2 Identification and prioritisation of
risk factors
This chapter explains the process of deriving a taxonomy of human related risk factors in
road traffic for SafetyCube’s purpose. To ensure the relevance of this, the risk factors have
been further prioritized by considering valuable input from practitioners and stakeholders.
Moreover, the chapter shows how human risk factors are delineated from road safety
measures within this project as well as how vulnerable road users were taken into
consideration.
2.1 WHAT IS A RISK FACTOR?
Within the SafetyCube project ‘risk factor’ refers to any factor that contributes to the occurrence or the consequence of road accidents. Risk factors can have a direct influence on the risk of an accident occurring or more indirectly by influencing a Safety Performance Indicator (SPI). All elements of the road system can hold an accident risk factor. WP4 is dealing with those that are related to the road users and their behaviour in road traffic.
2.2 TAXONOMY OF HUMAN RELATED RISK FACTORS
As a first step towards assessing behavioural risk factors in a comprehensive manner, a list of known human related risks in road traffic has been created with broad categories. An important aim was to consider all individual modes of transport (pedestrians, cyclists, powered two-wheelers, car drivers) and all kinds of road users (children, elderly etc.). The taxonomy is furthermore the basis for linking risk factors with their corresponding measures.
While there have been various classifications of road safety risks developed already, mostly for accident causation analysis within former projects such as SafetyNet (Wallén Warner et al., 2008) or TRACE (Naing et al., 2007), none of them exactly suited the needs of SafetyCube since each of these tools was developed with a very specific aim. Therefore it was decided to create a new, made-to-measure taxonomy, although the accident causation classifications formed a useful starting point.
The topics, only categorized roughly at that point, like 'speeding', 'distraction', or 'fatigue', have been assigned to all partners involved in Task 1 according to their expertise and preference. Partners then further refined and differentiated their topics - based on literature search and their expertise - on two sublevels in an iterative process to arrive at a three-level taxonomy. This three-level structure is uniform across the analytical WPs and that is how the topics will also appear within the web-based DSS. Proposals of classifications have been circulated within the WP for feedback of others and consolidated centrally.
During this process the creation of a draft taxonomy of human related road safety measures has been started in parallel to use resources for the first literature screening as effectively as possible (for the taxonomy of behavioural measures see deliverable 4.2 – available from Aug 2017). Figure 1 shows an example of the three-level classification for the topic of driving under the influence. The full taxonomy of road user related risk factors can be found in appendix A.
SafetyCube | Deliverable 4.1 | WP4 | Final 12
Figure 1: SafetyCube’s three-level taxonomy using the example of driving under the influence.
In the course of establishing the risk factor taxonomy in parallel with the WPs dealing with
infrastructure and vehicles, it was not always clear right away how to separate certain factors from each other. As the three areas - behaviour, infrastructure, and vehicle - are of course interrelated in the traffic system as a whole, some division between topics had to be made purely for the reason of splitting project work - not suggesting a division content-wise. On the one hand, there has been some overlap with WP6 (vehicles). For example, the lack of maintenance of a car or a powered two-wheeler, which clearly is risky for road safety, can be interpreted as belonging to the sphere of vehicles but also relates to human behaviour. However, it has been decided in accordance with WP6 and 8 to assign all risk factors to WP6 that are physically tied to the vehicle like checking tire
pressure or car maintenance in general.
Similarly, it is debatable whether certain behaviours are interpreted as risks or as measures. Not using a bicycle helmet (or any other safety device) is a risk in terms of severity of injury in the case of an accident. Using the helmet in turn is a measure to mitigate injury outcomes. In the end, safety devices will be dealt within the next task which is to prioritize and assess measures targeting unsafe human behaviour (see deliverable 4.2, available August 2017).
While road safety research shows clearly that certain age groups are more at risk than others (e.g. young males, children, elderly), it is inappropriate to claim that 'age' is a risk factor per se. Therefore, age groups will not be treated as a separate risk factor but tackled within the other risk factors (e.g. functional impairment and elderly). A focus will be put on these groups that are at risk when it comes to identifying and selecting measures for assessment. However, the topic of age appears in the WP4-taxonomy as a separate topic for practical reasons. Whenever an included study deals with a certain risk of a certain age group, it is assigned primarily to that risk factor and then to the age group to make it traceable for the DSS-user (e.g. cognitive impairment among elderly, lack of knowledge among children etc.).
Several adaptations of the taxonomy had to be made in an iterative process since it was not possible to anticipate all aspects of all topics prior to conducting a systematic literature search which was the next step. As the DSS is designed to be a living rather than a static system, the taxonomies of road safety risks and measures do not claim to be exhaustive.
SafetyCube | Deliverable 4.1 | WP4 | Final 13
2.3 HOT TOPICS AND PRIORITIES IN ROAD SAFETY
During the task of creating a list of risk factors, policy makers and other stakeholders were consulted and various policy documents were reviewed to identify research and policy priorities. The close engagement of various stakeholders including EU bodies, member states, road and vehicle industry but also e.g. the health sector is crucial throughout the project to ensure a high level of impact of SafetyCube's DSS. The stakeholders' consultations in the form of two workshops were organised and lead by the dissemination WP (2) and were designed to cover the focus of all WPs. Additionally, stakeholders had the opportunity to contribute at any time via an ‘Interactive Stakeholders’
Platform’ (see Deliverable 2.4). Furthermore, various policy papers and outcomes of research projects have been screened for highlighted topics and priorities in road safety work.
The consideration of stakeholders’ opinion, policy papers and research outcomes did not only help to prioritize but also to make sure the most pressing issues are covered within SafetyCube beyond the obvious human related risk factors. The following sources have been collected and further systematically processed:
Stakeholder workshops (A list of participants is available in appendix C) Brussels, June 17th 2015
Ljubljana, October 14th 2015 Projects
PROS (Urban, 2014)
Rosee (Štaba & Možina, 2014) Policy papers
Towards a European road safety area: policy orientations on road safety 2011-2020 (EC, 2010)
Towards Zero Deaths: A National Strategy on Highway Safety (Zegeer et al., 2010) Towards safer roads in Europe (FERSI, 2014)
Individual expert consultation FERSI representative Project consortium
Processing of stakeholders' input and policy and research outcomes
All statements and topics mentioned in the screened papers on various road user related risk factors were counted and recorded. The identified hot topics are within different levels of the WP4
taxonomy. Some nominations are very explicit like 'distraction due to cell phone use' and some are on a very global level like 'driving under the influence'. Furthermore, there had not always been a separation between risks and measures. The input on priorities of measures will be used for the next task of assessing road safety measures. The outcome of this procedure can be found in appendix A (colour highlighting).
In conclusion, the following are considered to be ‘hot topics’ (minimum of three nominations):
Speed choice
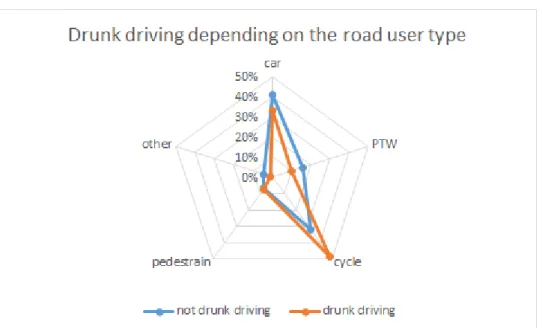
Drunk driving/riding
Drugged driving/riding (legal, medicine)
Fatigue
Cell phone use & operation other devices (e.g. in-vehicle information systems) Cognitive Impairment
Aggression and anger Elderly road users
SafetyCube | Deliverable 4.1 | WP4 | Final 14 Young adult road users
Children
The identified hot topics are widely covered in the work reported in this deliverable. However, also various other risk factors from the taxonomy were selected and included in the further analysing process to cover a wider range of topics:
Drugged driving/riding (illegal drugs) Risk taking – overtaking and close following Insufficient skills and knowledge
Functional impairment – vision loss and hearing loss Diseases and disorders – diabetes
Personal factors – sensation seeking and ADHD
Distraction through conversation with passengers, music/entertainment systems and outside of vehicle
Observation errors
Vulnerable road users
Generally the term ‘vulnerable road users’ (VRU) either refers to the modes of transport that provide the least protection for the road user or a certain age group. The latter is considered vulnerable due to their physiology or potentially limited task capability. Resilience is also a factor that distinguishes between vulnerable road users and others (SWOV, 2012). VRU are defined in the SafetyCube project to be pedal cyclists, pedestrians, powered two-wheelers, children, and elderly. Even though the number of fatalities on EU's roads decreased in the decade to 2010 (45% reduction in fatalities, 30% reduction of all injured, EuroStat, 2012), in 2010 more than 50% of all fatally injured were VRU (EC, 2010).
As mentioned earlier, rather than declaring a whole group of VRU, such as elderly, a risk factor, they require high attention when it comes to designing and selecting effective road safety measures. SafetyCube will therefore put an emphasis on these groups in the next task when dealing with road safety measures. All studies included in the DSS on risk factors that have a look at a VRU group will be assigned to both the specific risk factor and the age group or mode of transport (e.g. cognitive impairment of elderly, insufficient skills and children, or young males and speeding). Consequently, DSS users will be able to find the information by either searching for the risk factor and for the VRU group respectively.
SafetyCube | Deliverable 4.1 | WP4 | Final 15
3 Study selection and coding
This chapter provides an overview of the process of searching and selecting studies on
human related risk factor estimates that have been included in SafetyCube’s repository and
will be available through the DSS.
The aim was to collect information of studies dealing with the effect of risk factors on road safety in a uniform manner (as far as possible). Therefore, a standard methodology was developed by WP3. This included a literature search strategy, a coding scheme to record key data and metadata from individual studies and guidelines for summarising the findings per risk factor. Copies of these documents and the associated instructions and guidelines can be found in Martensen et al. (2017).
3.1 LITERATURE SEARCH
For each of the identified and selected risk factor topics a standardised literature search was conducted in order to identify relevant studies to include in the DSS and to form a basis for a concluding summary (synopsis) and further analyses. A standardised procedure was developed in WP3 and applied for each examined risk factor in SafetyCube (within WPs 4, 5, 6, 7). The closer look at each risk factor in terms of the literature search resulted in the need for several adaptations of the risk factor taxonomy, especially on the second and third, more detailed levels. The literature search was documented according to the Guidelines of WP3 in a standard template to make the gradual reduction of relevant studies transparent. This documentation of each search is included in the corresponding supporting documents of the synopses (see Appendix D). The databases used in WP4 are the following:
Scopus Google Scholar Web of Science Science Direct Dok Dat2 PubMed 3.2 STUDY SELECTION
Accident counts versus Safety Performance Indicators as Outcome
The initial aim was to find studies that provided an estimate of the risk of being in an accident due to the presence of the risk factor. However, while the actual occurrence of accidents can be seen as the ultimate measure for road safety, in recent years more and more often, Safety Performance
Indicators (SPI) have been taken into consideration to quantify the road safety level (Gitelman et al., 2014) - like driving behaviour, such as speed choice, drink driving or seat belt use. In addition, attitudes and intentions can be utilised as SPI given that a link between attitudes and behaviour can be established by psychological theory (Martensen et al., 2017).
SPIs such as attitudes or driving behaviour are often used to test the impacts of, for example, campaigns or enforcement strategies (e.g. their effect on speeding or driving under influence). When considering road user related risks, it is especially important to also have a look at studies that
SafetyCube | Deliverable 4.1 | WP4 | Final 16 report on SPIs such as self-reported behaviour or cognitive diagnostic measures. That is because the presence of a human related risk factor in an accident is far less easy to determine than the presence or absence of a safety feature in a vehicle or the presence or absence of an infrastructural element. However, it is important to note that the effect of a given risk factor on accidents via a SPI is indirect and often the relationship between an SPI and accident involvement is a missing link in road safety knowledge.
Studies have been considered which either assess the effect of a risk factor on accidents (fatal, injured, material damage) or on one or several SPIs. The following measurement variables have been included in WP4:
Accident and injury data, statistics Self-reported accident history
Near miss or critical event data (self-reported, observed)
Directly observed or measured behaviour (e.g. red light running, speeding) Self-reported behaviour (e.g. speeding, risk taking etc.)
Real world driving (Naturalistic, driving test on road)
Driving test in simulator (e.g. reaction time, lane deviation etc.) Attitudes towards unsafe behaviours
Outcomes of psychological diagnostic assessment
Studies that compared two different kinds of (variations of) risk factors are not suitable in terms of risk factors assessment and have been excluded for that reason. Studies with no control or
comparison group (e.g. group not exposed to risk factor) were also excluded.
Prioritising
Since the study design and the outcome variables are just basic criteria, for some risk factors the literature search resulted in a large amount of studies, so further selection criteria were required. Furthermore, on major and well-studied human risk factors meta-analyses were available and these were prioritised. While the aim was of course to include as many studies as possible for as many risk factors as possible, it was simply not achievable to examine all available studies for all risk factors and their variants. The criteria for the prioritisation of studies were the following (no obligatory application):
Key meta-analyses (studies already included in the key meta-analysis were not coded again) Most recent studies
Quality of studies
Country origin: Europe before US/Australia/Canada before other countries Importance: number of citations
Language: English Peer-reviewed journals
According to the level of detail of the topic and the history of research in the field, the number of studies that were eligible for 'coding' varied (see synopses for the number of studies included per topic). To keep track of the number of studies per risk factor topic and to avoid double-coding of different partners with overlapping topics, a document was kept and updated where partners recorded all of their studies.
A challenge within the task of identifying studies to be included in the repository of risk factor studies was to distinguish between risk factors and countermeasures. For example, studies dealing with speeding are often designed to record e.g. accidents before and after the establishment of a certain speeding measure (e.g. section control). So the study is at the same time assessing the risk factor and the corresponding measure.
SafetyCube | Deliverable 4.1 | WP4 | Final 17
3.3 STUDY CODING
Within the aim of creating a database of estimates of risk factors and safety effects, a template was developed (WP3) that determined what information per study had to be provided and offered the opportunity to report this information uniformly across topics and WPs.
Guidelines were also made available for the task of coding with detailed instructions on how to use the template. The design of the coding template accommodates the variety and complexity of different study designs. A workshop was organised to train coders on how to use the template.
The following information is provided per study and will also be retrievable in the DSS:
Road system element (Road User, Infrastructure, Vehicle) and level of taxonomy so that users of the DSS will be able to find information on topics they are interested in
Basic information of the study (title, author, year, source, origin, abstract, etc.)
Road user group examined
Study design
Measures of exposure to the risk factor
Measures of outcome (e.g. number of injury crashes) Type of effects
Effects (including corresponding measures such as confidence intervals)
Biases
Summary
For the full list of information provided per study see Martensen et al. (2017). Completed coding files were uploaded to the web-based DSS. In total, more than 180 studies on human related risk factors have been coded within WP4.
Quality control for coding task
Even though the instructions for coding were very detailed, there is sometimes still room for interpretation e.g. which design describes the study the best (if not mentioned by author), which estimates to include or exclude, what are the main weak points of the study etc. Therefore, a quality control procedure was established. Every coded study was checked by a second person (within or outside the same organisation) and at least one study per organisation was checked by the WP leader. Furthermore, coders had the opportunity to have more than one study checked if they were uncertain.
Iterative process and adaptation of taxonomy and coding template
The structure of this deliverable suggests a sequential approach of creating a risk factor taxonomy, identifying studies that assess the risk in terms of quantitative measures, and coding all these studies. However, the actual process was rather more iterative: creating a draft taxonomy, finding few suitable studies, adapting the taxonomy according to that, filling in a draft coding template, feedback to the methodology developers (WP3), adaptation of the template, refining the taxonomy, searching for suitable studies etc. This process was necessary since it was not possible to anticipate all methodological details of all studies, neither was is possible to establish a suitable taxonomy of risk factors and measures without going into detail in terms of a literature review of each topic. This approach required tight cooperation between WP3 and the executing WPs 4, 5, and 6. Several adaptations of the taxonomy and the coding template were necessary.
SafetyCube | Deliverable 4.1 | WP4 | Final 18
4 Analysis and summary
This chapter describes how the information from the coded studies and additional in-depth
crash data was analysed and summarized. For many risk factors this analysis and summary
will be available through the DSS in the form of a risk factor ‘synopsis’. The audience of the
synopses will be varied – both academic and non-academic stakeholders e.g. policy makers.
Thus, risk factor synopses are structured in different sections, for different target groups,
that can be read independently.
The DSS will provide information for all coded studies (see above) for various risk factors and measures. The synthesis of these studies will be also be available, in the form of a ‘synopsis’ indicating the main findings for a particular risk factor derived from meta-analyses or another type of comprehensive synthesis of the results (e.g. vote-count table).
Synopses were created for the identified hot topics and furthermore for several other risk factors of the taxonomy (for measures see deliverable 4.2, available from August 2017) on different levels of the risk factor taxonomy, thus, for different levels of detail. Whether a synopsis was created for the first, second, or third level of the taxonomy was decided during the task of searching literature (see 3.1) by the responsible partner, mainly dependent on the availability of studies for a certain topic. All synopsis for individual risk factors are presented in the appendix D. Moreover, the synopses contain context information for each risk factor from literature that could not be coded (e.g. literature reviews or qualitative studies). On the other hand, not all the coded studies that will populate the DSS are included in the analysis documented in the synopsis.
The synopses aim to facilitate different end users: decision-makers looking for global estimates vs. scientific users interested in result and methodological details. Therefore, the synopses contain sections for different end user groups that can be read independently. Moreover, the structure of the synopses is differentiated into three distinct parts:
a. Summary: A two-page document reporting the key aspects of the topic, the main results, and transferability conditions. This part addresses users, who need a short overview of the topic and the main results, such as policy makers.
b. Scientific overview: A four to five page document including a short synthesis of the
literature, an overview of the available studies, a description of the analysis methods, and an analysis of the effects by condition. This section aims to describe the way the reported effects have been estimated, with a full analysis of the methods and results, in order to give the user all the necessary information to understand the results and assess their validity. c. Supporting document: This section describes the literature search, compares the available
studies in detail (optional) etc. It aims to provide the most detailed information for the scientific reader and interested user (no initial page limit).
A colour code was assigned to each synopsis to give an indication about the evidence that the risk factor(s) covered has a negative effect on road safety (see chapter 5.1).
SafetyCube | Deliverable 4.1 | WP4 | Final 19
4.1 HUMAN RELATED IN-DEPTH CRASH DATA
To enrich the background information in the synopsis, in-depth accident data from The German In-Depth Accident Study (GIDAS) has been used for those risk factors, which are sufficiently
represented in the corresponding database. The analysis of accident causes in GIDAS was conducted by GIDAS researchers and used the Accident Causation Analysis System (ACAS) which particularly focuses on the identification of human failures. The theoretical framework for the analysis of these human causes is a hierarchical classification scheme of five categories of basic human functions in which errors are identified. More detailed information about GIDAS and ACAS can be found below. The codes of the accident analysis system ACAS widely covers the identified risk factors of the WP4 taxonomy which made it possible to gain more knowledge about the relation of the factor in question with other important characteristics of accidents, such as the type of road user involved, their age, the time of the day or the week, the type of the road, etc.
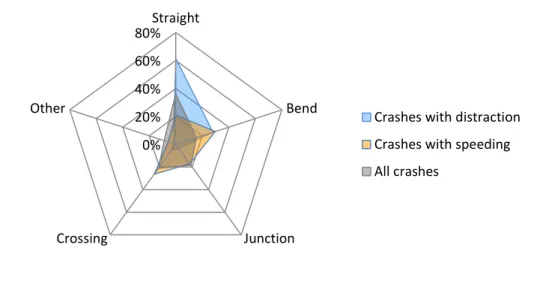
As an example, Figure 2 gives an overview of the distribution of accident locations for crashes in which either distraction or speeding was a contributory factor and for all crashes together respectively. It is clear that each contributory factor has a distinctive ‘footprint’ with distraction accidents taking place exclusively on straight road segments and in curves, while speeding crashes are underrepresented on straight roads and overrepresented in curves and also at crossings.
Figure 2: Radar plot of distribution of accident sites from the GIDAS database for crashes with distraction and speeding involved, and all crashes respectively.
About GIDAS
The German In-Depth Accident Study (GIDAS) is a joint venture between Federal Highway Research Institute (BASt) and the German Association for Research in Automobile Technology (FAT), initiated in July 1999. It is the largest in-depth accident study project in Germany and based on the work of the BASt-founded investigation team at the Hanover Medical School (MHH), in co-operation with the investigation team of the Technical University Dresden. Approximately 2,000 accidents involving personal injury are recorded in the area of Dresden and Hannover annually (Otte et al., 2003).
In GIDAS, road traffic accidents involving personal injury are investigated using the “on the scene” approach and are collected according to a statistical sampling process. This means that teams are called promptly after the occurrence of any kind of road traffic accidents with at least one injured person which occurred in determined time shifts. Comparisons with the official accident statistics
0% 20% 40% 60% 80% Straight Bend Junction Crossing
Other Crashes with distraction
Crashes with speeding All crashes
SafetyCube | Deliverable 4.1 | WP4 | Final 20 are made regularly and weighing factors are applied (to avoid biases). Investigation areas were chosen accordingly to represent the German national road network and built-up areas.
The detailed documentation of the accidents is performed by survey teams consisting of specially trained students, technical and medical staff. The documentation scope obtained reaches up to 3,000 encoded parameters per accident. The data scope includes technical vehicle data, crash information, road design, active and passive safety systems, accident scene details, and cause of the accident. Surveyed factors include impact contact points of passengers or vulnerable road users, environmental conditions, information on traffic control, and other parties (road users) involved. To collect detailed injury and accident causation information individual interviews of the involved accident participants are followed by detailed surveying of the accident scene based on existing evidence. All information available retrospectively is collected in close collaboration with police, hospitals and rescue services and each documented accident is reconstructed in a simulation program (entire course of the accident).
About ACAS
The analysis of the accident causes at the investigation team at MHH is conducted using ACAS (Accident Causation Analysis System). It was developed to aid the on-scene accident research team, GIDAS to analyse and collect relevant factors of causes of accidents. ACAS focuses especially on the identification of human failures (Otte et al., 2009). Within the ACAS-methodology causation factors of traffic accidents are identified and collected using a code of 4 numbers. For each accident
participant multiple codes may apply.
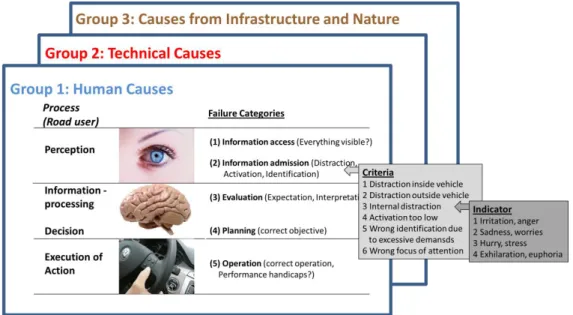
The causation factors of traffic accidents can be divided in to three different groups (first number of the code):
Group 1. Human causation factors
Group 2. Factors from the technical nature of vehicles and Group 3. Factors from the range of the infrastructure and nature.
Each causation factor group consists of specific categories which are subdivided into different criteria and within Group 1 (Human causation factors) the criteria are further subdivided into different indicators of each criteria, see Figure 3.
SafetyCube | Deliverable 4.1 | WP4 | Final 21 The analysis of the human factors is achieved by describing the human participation factors - and failures of these - in a chronological sequence from perception to concrete action/operation. This is done by considering the logical sequence of five basic human functions which the road user
continuously engages in when participating in the road traffic system. These functions provide the 5 categories of human factors (group 1) and are the core of the causation analysis system. The full list of ACAS codes can be found in the appendix B.
CARE database
The Care CADaS database was also looked at to describe the relationship between a human related risk factor and crashed. The database contained information for some risk factors like alcohol or distraction by devices but the data was only available for some countries for some years with an uncertain quality. For this reason, the data was not analysed further.
SafetyCube | Deliverable 4.1 | WP4 | Final 22
5 Risk factor synopses - Abstracts
This chapter provides an overview of all human related risk factor synopses that have been
written as of October 2016 and these will be available through the DSS when it is launched
in 2017. However, since these are very comprehensive documents, only the abstracts and
the corresponding colour code - which indicates the level of evidence for a given risk factor
(see section 5.1) - will be provided in this chapter. The synopses are intended to be
periodically updated to reflect new research or in some cases to expand their scope. The full
text of the synopses in their current form (v1.0) can be found in Appendix D and any future
updates or additions will be available on the project website
(
http://www.safetycube-project.eu/
) and the DSS.
Full list of Synopses: 3
Influenced driving - alcohol
Influenced driving - drugs (legal & illegal) Speeding and inappropriate speed Traffic rule violations - red light running Risk taking - overtaking
Risk taking - close following behaviour Distraction - cell phone use - hand held Distraction - cell phone use - hands free Distraction - cell phone use - texting
Distraction - music - entertainment systems Distraction - operating devices
Distraction - cognitive overload, inattention Distraction - conversation with passengers Distraction - outside of vehicle
Fatigue - not enough sleep, sleepy at wheel Fatigue - sleep disorders - sleep apnea Insufficient knowledge and skills Observation errors
Functional impairment - cognitive impairment Functional impairment - hearing loss
Functional impairment - vision loss Diseases and disorders - diabetes Personal factors - sensation seeking Personal factors - ADHD
Emotions - aggression, anger
3 The titles of the synopses are not always in line with the wording of the corresponding topics in the taxonomy. Some
specific topics have been summarised in one synopsis. Sometimes the chosen synopsis title was better suitable corresponding to the content and literature respectively.
SafetyCube | Deliverable 4.1 | WP4 | Final 23
5.1 COLOUR CODE EXPLANATION
A colour code was assigned to each synopsis to give an indication about the evidence that the risk factor(s) covered has a negative effect on road safety. [Adapted from Martensen et al., 2017]
Red (risky)
Red was used when the study results were relatively consistent showing an increased risk upon exposure to the risk factor in question.
Good number of studies (at least 3 per relevant condition, at least 5 in total) Fair quality (at least for a number of studies showing the result)
Consistency across studies & conditions Good indictor (proven relation with accidents)
Yellow (probably risky)
Yellow was used when there was some indication that exposure to the risk factor increases the accident or injury risk, but the results were not consistent. This could either be due to conditions under which the risk factor has been shown to be unproblematic, or because the study results are inconsistent (but with the majority of studies pointing to an increased risk).
Few studies (of sufficient quality)
Inconsistent results (but majority showing risk effect) Weak indicator (unsure relation to accidents)
Grey (unclear)
If several of the above issues listed in the yellow category were applicable (few studies with inconsistent results, or few studies with weak indicators or an equal amount of studies with no (or opposite) it was concluded that the evidence for the effect of the risk factor on road safety was ‘unclear’ and so was assigned the category ‘grey’
No studies that investigate effect Mixed results
Insufficient quality & quantity of studies that might show a risk effect
Green (probably not risky)
This colour was selected to indicate that studies suggest that the ‘risk factor’ was probably not risky or actually had a positive effect on road safety. The absence of a risk effect is a null-effect which is notoriously difficult to “prove”, therefore this category was only chosen if there were a reasonably large number of studies with fair quality – such that one could expect a risk effect (if it existed) to become apparent in them.
Sufficient quantity and quality of studies
Large majority of studies show null-effect or opposite effect
Meta-analysis on a large number of studies shows no significant effect or opposite effect
5.2 INFLUENCED DRIVING - ALCOHOL
Colour code: Red
Driving under the influence of alcohol generally has a significantly increased risk of crashes and poor driving performance. There is a common understanding that driving under the influence of alcohol is associated with higher risk of being involved in crashes with injuries and possible fatalities as the outcome. Alcohol is a depressant. It slows down the brain and affects the body’s responses. At the same time, if you have been drinking, you are more likely to take risks. Combined, these reactions increase the likelihood of accidents happening.
SafetyCube | Deliverable 4.1 | WP4 | Final 24
Abstract
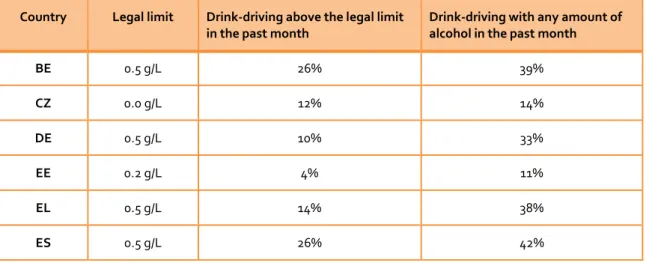
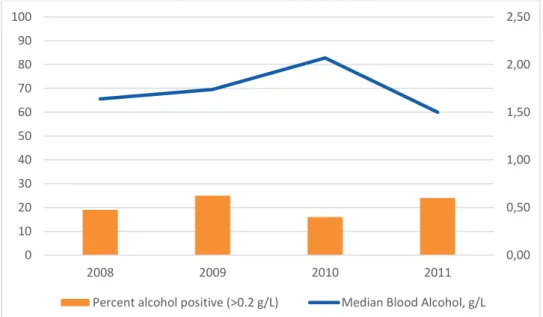
Drinking and driving is one of the main causes of road crashes worldwide. Efforts to deter drunken driving have a long history as evidenced by enforcement of statutory blood-alcohol concentration (BAC) limits of 0.20, 0.50 or 0.80 g/L (20, 50 or 80 mg/100 mL) in most nations. In high-income countries, about 20% of fatally injured drivers have excess alcohol in their blood, while in some low- and middle-income countries these figures may be up to 69%. Although injuries and fatalities related to road accidents have decreased in recent decades, the prevalence of drunk driving among drivers killed in road accidents has remained stable, at around 25% or more during the past 10 years. In the context of driving, it is relevant to distinguish between drivers who exceed the BAC limit only once, and those who do it repeatedly (recidivists). Driving under the influence (DUI) laws,
enforcement and penalties vary between countries and have been implemented at different
historical moments. In addition, the driver’s knowledge and respect for the DUI laws vary; therefore, the incidence of driving under the influence of alcohol or drugs and the involvement of alcohol and drugs in fatal crashes varies.
5.3 INFLUENCED DRIVING - DRUGS (LEGAL & ILLEGAL)
Colour code: Red
Legal and illegal drugs generally have a significant negative effect on crashes and driving
performance. The crash risk is increased with most drug types. When combined with other drugs or alcohol, the effect on road safety is even worse than when taken alone.
Abstract
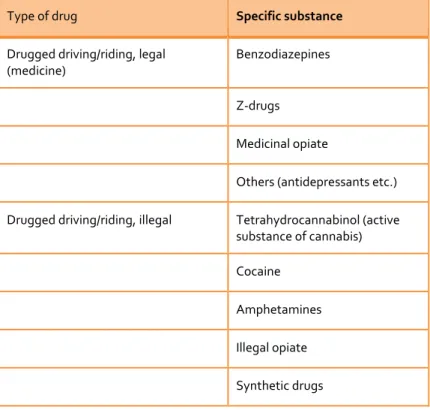
‘Drugs’ is a very common term which refers to countless numbers of substances. It can have positive or negative effects on efficiency, reflexes, concentration, sleeping etc. More specifically, substances having physiological effects on the human body and behaviour are defined as psychoactive drugs. In the context of road safety, they could be a major danger when driving a vehicle. In this synopsis the main types of drugs were assessed to determine their impact on road safety. Legal drugs studied were divided into benzodiazepine and medicinal opioids. Illegal drugs were divided into
amphetamines, cocaine, opioids, and cannabinoids. The literature study firstly highlighted that driving under the influence of drugs is a well-studied subject, with hundreds of papers found. It also showed that the main legal and illegal drugs have a negative impact on road safety. They increase the crash risk, injury severity, fatal crash rate, but also the general ability to drive. When combined with alcohol or other drugs, their effects are even worse. Considering that more than 10% of fatal accidents could be linked to drug use, it is important to systematically monitor their use and increase the enforcement.
5.4 SPEEDING AND INAPPROPRIATE SPEED
Colour Code: Red
Research shows that there is a very strong statistical relationship between speed and road safety. When speed increases, the number of accidents and the number of injured road users rises. When speed goes down, the number of accidents and the number of injured road users decreases.
Abstract
Speed is a well-known risk factor. Studies documented a strong statistical relationship between speed and road safety. If the (mean) speed of traffic is reduced, the number of accidents and the severity of injuries decrease. The relationship between changes in speed and changes in road safety can be described by the Power Model – developed by Nilsson in 1981. Mainly case-control,
cross-SafetyCube | Deliverable 4.1 | WP4 | Final 25 sectional and observational study designs are used for investigating the effect of speeding. Studies mainly compare speeders and non-speeders, drivers with and without crashes, or analyse accident outcomes regarding the proportion of speeders. However, studies on speeding often reveal several limitations like availability of a control group or completeness of data.
5.5 TRAFFIC RULE VIOLATIONS - RED LIGHT RUNNING
Colour code: Red
Red light running can lead to two basic types of traffic conflicts at intersections: right-angle and left turn-opposed conflicts. Red light running is a traffic violation that is associated with very serious crash outcomes (fatality or serious injury). Red-light-running related crashes compose a substantial part of urban road safety. It has been estimated that when a pedestrian crosses an intersection at red light his relative crash risk is eight times higher compared to a legal crossing at green (or amber) light.
Abstract
Red light running is a risky traffic violation leading to traffic conflicts at intersections that may result in death or serious injury. It has been estimated that pedestrians’ relative crash risk is eight times higher when they cross an intersection at red light instead of green (or yellow) light. Relative risk estimates for red light running by drivers and cyclists have not yet been made. Red light running is fairly scarce amongst drivers (a few drivers per 1,000 vehicles), but fairly frequent among cyclists and pedestrians (percentages may run up to over 50% at specific days, times and locations). Red light running is influenced by several factors, including age and gender, static and dynamic
intersection characteristics, day and time, and weather. Most research has been done in busy, large metropolitan city areas in China, Europe, and the USA.
5.6 RISK TAKING - OVERTAKING
Colour Code: Yellow
Research shows compared to other vehicle manoeuvres (risky) overtaking tends to increase accident severity. Regarding accident frequency however it seems that only a small share of crashes occurs while overtaking another vehicle. In addition, some situational factors (traffic volume, speed) and driver characteristics (age, gender) seem to influence (the frequency of) risky overtaking.
Abstract
Overtaking is known as one of the most complex manoeuvres for road users. From studies in the international literature, it appears indeed that compared to other vehicle manoeuvres, (risky) overtaking significantly increases accident severity, however regarding accident frequency –
although associated with a higher crash risk in one study – it seems that only a small share of crashes occurs while overtaking another vehicle. Moreover, studies indicate that various situational factors and driver characteristics – especially age – seem to influence (the frequency of) risky overtaking: younger drivers tend to be more likely to engage in risky overtaking manoeuvres, than older drivers. This seems to be also the case for other situational factors (traffic volume, speed) and driver
characteristics (gender).
5.7 RISK TAKING - CLOSE FOLLOWING BEHAVIOUR
Colour Code: Yellow
Although following too closely is seen as one of the main reasons for rear end crashes, studies that evaluate the risk of this behaviour in connection to accidents are rare. However, if headway
SafetyCube | Deliverable 4.1 | WP4 | Final 26 can be presumed as risky. Quite a proportion of drivers engage in such a behaviour. Results of one study indicate a higher crash risk for short headways.
Abstract
Headway is the distance from a following vehicle to a lead vehicle in a traffic following situation. A minimum headway distance of two seconds to the vehicle in front is generally recommended as safe. Considerably shorter headways for a longer period are seen as risky and addressed as
tailgating. Headway distance is mainly measured in seconds (time headway), which is independent from velocity, or meters (headway distance). The prevalence of close following behaviour in traffic differs considerably depending on the location, traffic situation, time of the day and type of measurement (prevalence of risky drivers, prevalence of driving time). Studies which evaluate the risk of this behaviour in connection to accidents are rare. One naturalistic driving study shows an increased crash risk for close following behaviour with a low prevalence of this behaviour present in the driving condition. Several driving characteristics and situational factors such as age, personality, weather and presence of roadworks seem to have an effect on the choice of headway distance.
5.8 DISTRACTION - CELL PHONE USE - HANDHELD
Colour code: Red
The effects of handheld cell phone use for conversation have long related to accidents, with a very large number of literature studies presenting findings to support that. Those studies have good levels of quality, and are overall consistent in their results. Finally, study results and professional practice indicate that handheld cell phone use has a proven relation with accidents.
Abstract
The use of handheld cell phones induces a level of distraction to the person driving. This distraction translates to slower reaction times to events, increased percentages of time with eyes off the road, speeding, increased number of crashes and near misses and also increased crash injury severities. Thirteen high quality studies, including four meta-analyses, regarding various related topics were coded. On a basis of both study and effect numbers, it can be argued that handheld cell phone use creates negative impacts on road safety, with most factors being statistically significant. There were cases, however, that reported no statistically significant relation of cell phone use to various road safety variables (including behavioural factors) or even positive effects from overcompensation. The presence of meta-analyses makes the results generally transferable.
5.9 DISTRACTION - CELL PHONE USE - HANDS-FREE
Colour Code: Red
The effects of hands-free cell phone use for conversation have long related to accidents, with a large number of literature studies presenting findings to support that. Those studies have good levels of quality, and are overall consistent in their results. Finally, study results and professional practice indicate that hands-free cell phone use has a proven relation with accidents.
Abstract
The use of hands-free cell phones induces a level of distraction to the person driving. This
distraction translates to slower reaction times to events, increased percentages of time with eyes off the road, speeding, increased crashes and near misses, and also increased crash injury severities. Nine high quality studies regarding various hands-free cell phone topics were coded. On a basis of both study and effect numbers, it can be argued that hands-free cell phone use creates negative impacts on road safety, with most factors being statistically significant. There were cases, however,
SafetyCube | Deliverable 4.1 | WP4 | Final 27 that reported no statistically significant impact to various road safety variables (including
behavioural factors). The presence of meta-analyses makes the results generally transferable.
5.10 DISTRACTION - CELL PHONE USE - TEXTING
Colour code: Red
The effects of texting have long been related to accidents, with a large number of literature studies presenting findings to support that. Those studies have good levels of quality, and are overall consistent in their results. Finally, study results and professional practice indicate that texting has a proven relation with accidents.
Abstract
The use of cell phones for texting induces a level of distraction to the person driving. This distraction translates to an increase of; accidents and near misses, injury severities, reaction times to events, percentage of time with eyes off the road, speeding, and to inconsistencies in driving behaviour. Eight high quality studies regarding various texting topics were coded. On a basis of both study and effect numbers, it can be argued that texting via cell phones or other devices creates negative impacts on road safety, with most factors being statistically significant. There were cases, however, that reported no statistically significant relation of texting to various road safety variables (including behavioural factors). The presence of meta-analyses makes the results generally transferable.
5.11 DISTRACTION - MUSIC - ENTERTAINMENT SYSTEMS
Colour code: Grey
The effects of listening to music while driving have been suspected to link to accidents, and thus many relevant scientific studies have been conducted to investigate the matter. The coded studies have good levels of quality, however they fail to settle to a common conclusion for the effects of this risk factor, or in some cases even reach opposite results. As there is a balance between positive and negative effects, and a lot of uncertainties, the overall impact of music is characterised as grey (unclear).
Abstract
The employment of music for entertainment while driving induces a level of distraction to the person driving. The specific impacts of these distractions vary, but in general music has an unclear impact on road safety. While in absolute numbers a lot of the effects of this risk factor are
detrimental, there are many beneficial impacts as well, and a considerable number of variables remain statistically non-significant (not sufficiently related) to music. Driver behaviour variables such as speed and (lateral) positioning are affected. There is evidence to support that
overcompensation occurs by certain drivers, but whether the overall, collective effects of this risk factor are negated is still unclear. The results of the analysis are generally transferable. The majority of the studies were quasi- or experimental studies with the capability to investigate various
behavioural variables.
5.12 DISTRACTION - OPERATING DEVICES
Colour code: Grey
The effects of operating devices while driving have been suspected to link to accidents, and thus many relevant scientific studies have been conducted to investigate the matter. The coded studies have good levels of quality, however they fail to settle to a common conclusion for the effects of these risk factors, or in some cases to even reach consistent and significant results. As there is a
SafetyCube | Deliverable 4.1 | WP4 | Final 28 presence of several positive and negative effects, and a lot of uncertainties, the overall impact of operating devices is characterised as grey (unclear).
Abstract
The use or operation of various devices (generally IVIS) while driving induces many distractions to the person driving. The specific impacts of these distractions vary, but in general it can be assumed that driver behavioural variables are affected. Six high quality studies regarding various IVIS topics were coded. On a basis of both study and effect numbers, it can be argued that operating devices have an unclear impact on road safety, with most factors not being statistically significant. There were cases, however, that reported increased crash counts and reaction times to events (e.g. bicycle appearance) when distracted by IVIS. The results are moderately transferable.
5.13 DISTRACTION - COGNITIVE OVERLOAD, INATTENTION
Colour code: Yellow
The effects of the risk factor of inattention (daydreaming and distraction through state of mind (pondering etc.)) and cognitive overload while driving have been suspected to link to accidents, and thus investigated accordingly. The coded studies have good levels of quality and decent consistency, though there are some unclear areas. As there are more detrimental effects than beneficial ones to road safety, the overall impact of inattention is characterised as yellow (probably risky).
Abstract
The inattention of drivers through loss of focus, daydreaming or state of mind induces a level of distraction to the person driving. On a basis of both study and effect numbers, it can be argued that the risk factor of inattention while driving has a likely detrimental effect on road safety. The specific impacts of these distractions vary, but they are negative and in general it can be assumed that driver behavioural variables such as perception and braking performance are affected. There are some positive results that show reduced injury severity or increased perception, but these occur mainly due to overcompensation and effects and are limited. The results of the analysis are generally transferable with caution. The majority of the studies were observational/case control studies which investigated past accident data.
5.14 DISTRACTION - CONVERSATION WITH PASSENGERS
Colour Code: Yellow
The meta-analyses carried out showed that conversation with other passengers (both adults and children) corresponds to a significant proportion of road accidents. There is also evidence to support that this distraction activity slows reaction times and increases injury severity, but more studies are needed to further support this statement.
Abstract
Conversation and other interactions with passengers induce a level of distraction to the person driving. This distraction translates to slower reaction times to events or to increased severity of driver injuries in accidents. On a basis of both study and effect numbers, it is observed that a consistent non-negligible proportion of road accidents are caused by driver conversation with other passengers in the vehicle. The results of the meta-analyses carried out confirmed this trend and showed that this proportion is significant. In general, findings for this risk factor are generally transferable, though caution and care against oversimplification are always required.