A New Survey 2MO to analyze Remittances from France to Southern and Eastern Mediterranean and Sub-Saharan Countries
LUIS MIOTTI*,EL MOUHOUB MOUHOUD**,JOEL OUDINET*
*CEPN-CNRS,UNIVERSITY PARIS-NORD
**LABORATORY OF ECONOMICS OF DAUPHINE (LEDA)
29th annual meetings of the MIDDLE EAST ECONOMIC ASSOCIATION (MEEA) in conjunction with annual meetings of the ALLIED SOCIAL SCIENCE ASSOCIATIONS (ASSA),
January 3-5, 2009, San Francisco, CA
Keywords: Survey, Migration, Immigrants, characteristics, objectives, determinants, subjective factors
JEL Classification: D64 ; F24; J61
1 A New Survey 2MO to analyze Remittances from France to Southern and
Eastern Mediterranean and Sub-Saharan Countries
Luis Miotti, El Mouhoub Mouhoud and Joel Oudinet
Introduction
International migration has changed in nature and its effect on the host country, as well as on the country of origin has major implications in the dual context of globalization of economies and industrial countries' entry into the economy of knowledge. At the same time, despite the restrictions that weigh heavily on flows of international migration, remittances from migrants have grown in volume in many countries of emigration. These remittances have tripled during the period of 1995-2008 from 102 billion dollars to over 337 billion in 2008, they account for more than three times development assistance and have surpassed foreign direct investment to developing countries. So, despite their sharp drop in 2009 due to the crisis (the World Bank has estimated this drop at 317 billion dollars), they continue to be larger than capital flows and ODA. In addition, these figures are underestimated since more than 100 billion dollars go through informal channels (World Bank, 2005).
The decline in remittances is also sensitive for countries of the Southern and Eastern Mediterranean (SEM), going from 34 to 32 billion dollars between 2008 and 2009, but the total amount remains high: for Algeria, Morocco, Tunisia and Turkey, the amount of remittances in 2008 is twice as high as direct investment abroad or ODA.
Remittances to Morocco are relatively the highest (about 8% of Morocco's GDP in 2008) and the most stable over time. Remittances are increasingly facilitated by Moroccan banks and transaction costs associated with them have dropped, which explains the growth in recent years. It is estimated that the total flows of remittances may increase by one quarter or one third if one includes informal transfers or shipments of goods to Morocco. In the case of Tunisia, remittance flows remain equally stable but at a level twice as low since they represent 4.7% of GDP in Tunisia. For Algeria, the formal remittance flows are higher, but
2 remain relatively low (1.3% of GDP in 2008) because it is this country, among the four studied, that informal remittances are the largest (estimated at 70% of formal flows).
The determinants of these remittances must be studied both at the macro and micro-economic level.
At the macroeconomic level, the economic situation of both the host country and country of origin must be taken into account when determining the magnitude of remittances (Mouhoud, Oudinet, Unan, 2007). At the microeconomic level, several factors must be taken into account: considerations of insurance against the volatility of family income in the country of origin, investment motivations, and reasons for acquiring homes (Rapoport, Docquier F, 2006).
However, although the variables "collective or familial" strongly structure the allocation of migrants’ remittances in general, there is some variability in individual behavior, determined by a complex set of factors. The choices on the decisions of the remittances and their allocation result first from demographic characteristics of the migrant (origin, social status and education), from his socioeconomic status, both in the country of origin and in the host country (the level and stability of the income of the migrant give him a higher capacity of savings, the number of relatives residing in the country of origin and type of familial relationship (the size of the immediate or close dependent relatives and their income level). However, other factors which are even more individual also come into play, such as the purpose and duration of migration (the feeling of belonging to two different spaces is a key determinant of transfer behavior), as well as orientation of the migration project to the country of origin, especially in terms of return to the country of origin, or on the contrary, to the host country.
Finally, factors related to the context of the country of origin must also to be taken into account (Miotti, Mouhoud, Oudinet, 2009)1. Furthermore, certain measures put in place by financial and political institutions in both the country of origin and the host country can be either be encouraging or dissuasive with regards to allocation of savings. This paper presents a survey called 2MO2
1These factors, which are part of the findings of the 2MO survey, are particularly important. (Miotti, Mouhoud, Oudinet, 2009).
,
on the determinants of remittances of migrants, conducted in post offices in France and the descriptive results lead to the proposal of a typology of migrants who send remittances to the southern Mediterranean and to countries in Sub-Saharan Africa.
2Survey 2MO (“Mediterranean Migrants and Objectives”) targeting 1000 migrants andundertaken by Miotti-Mouhoud-Oudinet in
3 1.
A new survey on the attitudes of migrants from southern
Mediterranean and Sub-Saharan Africa
We conducted this survey in 2008 as part of a research agreement with the “Caisse des Dépôts et Consignations” and “Mission Recherche de La Poste”, surveying 1,000 people sending remittances to Algeria, Morocco, Tunisia, Turkey and the countries of Sub-Saharan Africa. The survey was conducted in post offices in France, since migrants use French post offices to send money in several different ways, such as money orders, or through Western Union, which has offices in French post offices since an agreement was made with the French Postal Service.
1.1. Methodology of the survey
It is impossible to know in advance the characteristics of the structure of the population that makes remittances and to draw a representative sample of this population. Our sample cannot be limited for example to the immigrant population in its strict sense; Children of immigrants born in France or naturalized individuals also send money to the country of origin of their parents. Consequently, and while still relevant to our analysis, the 2004-2006 INSEE annual surveys cannot be used as a basis for identifying migrants. The sample size was set to 1000 respondents and included 216 individuals sending remittances to Morocco, 196 to Algeria, 196 to Tunisia, 196 to Turkey and 196 to Sub-Saharan Africa (including 55 from Senegal, 46 to Mali, and 34 to Cote d'Ivoire). It is important to be reminded here r that the purpose of this survey is to gain a better understanding of the reasons why migrants from the Maghreb, Turkey, and sub-Saharan Africa make these remittances and for what intended use. It is not meant to study all remittances made from France. We have set a quota of two hundred respondents per nationality so that the survey is representative of remittances made to each receiving country, but not to be representative of all remittances sent from France.
To minimize the observation bias and to get as close as possible to conditions of equal probability sampling, the interviews were held on different days and times of the week. The survey was also spread over three dissimilar months, the month of November 2007 which is a "low" period in terms of the number of remittance operations, December 2007 which is a "peak" time, and January 2008 as an “average” month. These periods were determined through an analysis of the data provided by the by the French Postal Services. The data
4 covered the total daily amounts of remittances over two years (2005 and 2006) broken by destination and by post office throughout the French territory. Remittances sent through formal channels decrease in volume just before the summer and during the month of Ramadan because they are instead made through informal channels during those periods as a percentage of migrants move to their country of origin during the holidays. The period before Christmas is also a peak period (Figure 1).
This information enabled us to ensure geographical diversity by selecting s, the most representative post offices in terms of number of transactions to the countries concerned. In addition, a principal component analysis (PCA) allowed us to remove post offices exhibiting a behavior different from the average (in terms of volume and regularity of remittances) and which would have biased our sample (Appendix 1 and 2).
A bias remains in the survey to the extent that it excludes people who would exclusively use other channels to send their remittances and would not have used post offices3
Fifteen minute
. But we must remember that this bias is limited because respondents are asked to evaluate the total amounts sent through all channels, including informal channels.
face-to- face interviews were conducted4 with individuals chosen randomly were conducted within the post offices selected, and located in the departments most inhabited by the targeted nationalities, in this case, Ile de France, Rhône, Bouches du Rhône, Northern and Upper Garonne.
3 We were able to particularly minimize this bias for the Turkish migrants who were interviewed on their way out of Turkish banks
specialized in money transfers.
4 These interviews were organized by the research investigators in coordination with the polling company BASIC and they were carried out
5
FIGURE 1.Monthly evolution of remittances in all post offices in France in 2005 and 2006
-2.00 -1.50 -1.00 -0.50 0.00 0.50 1.00 1.50 2.00 2.50 Ja n vi e r Fé vr ie r M ar s A vr il M ai Ju in Ju ill e t A o û t Se p te m b re O ct o b re N o ve m b re D é ce m b re TOTAL 2006 TOTAL 2005
Source: La Poste statistics, authors' calculations. Survey 2MB.
The themes addressed in the questionnaire were based on the theoretical literature on the determinants of remittances. Several types of questions are posed:
i) Some have a direct relationship to the objective characteristics of the migrant himself: age, household income in France, family structure, qualifications, and professional activity.
ii) Elements related to the individual’s remittance activity: frequency, amounts, channels used, destination and use of remittances, savings in France and in the country of origin.
iii) The manner in which the migrant arrived in France is also of fundamental importance: financial assistance obtained from family members, help received at the migrants’ arrival in France.... The migrant’s trajectory since his / her arrival in France and the date of arrival is valuable information insofar as we seek to put in perspective duration of stay in the host country and contextualize the decision to emigrate, allowing us to better characterize the subjective factors related to remittance sending behaviors.
6 iv) Finally, subjective variables were directly posed, such as ties with the country of
origin, degree of attachment and intention to return to the country of origin.
1.2. The characteristics of migrants who make transfers
We document here the main features related to the duration of presence of migrants in France, their departure and arrival conditions, their level of education, their age, their professional position and type of activity.
Duration of stay, age and family status of migrants
The sample is composed of a majority of men (60%), particularly for the Turks (73%) and Algerians (64%). This ratio is comparable to census data (54 to 58% of men in the case of immigrants of Turkish origin and countries of the Maghreb5
More than a quarter of the transfers are made by those who arrived over twenty years ago (Table 1), and 28% of transfers are made by people born in France (“second generation”). The percentage is even higher (35 to 40%) in the case of Algerians and Moroccans and to a lesser degree for Tunisians, since the wave of immigration from the countries of Maghreb is older than that of the Turks or migrants from countries of Sub-Saharan Africa. Children of these migrants from the Maghreb countries also send remittances, either to help their parents or for themselves.
). In addition, the questions asked in our survey regarding income and the amounts of the transfers refer to the entire household regardless of marital status of the interviewee.
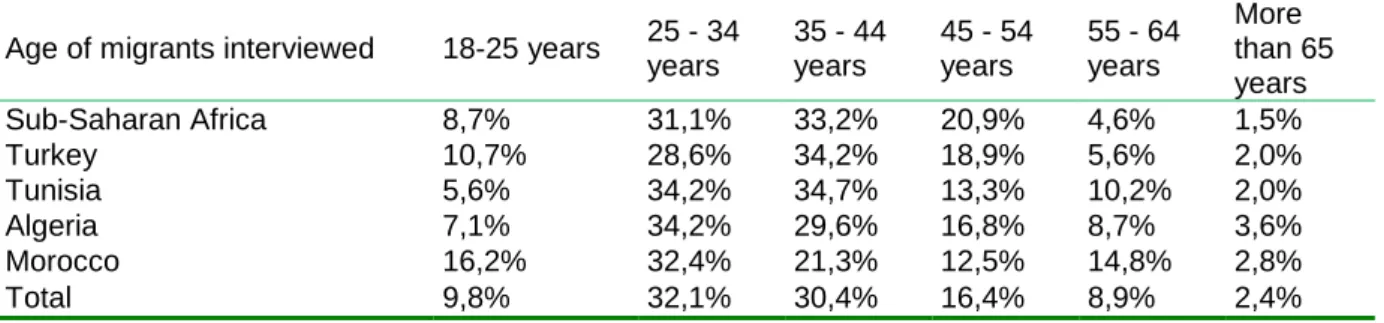
We find differences of structure in age by nationality that we know in the polled population (Table 2). The Turkish and African population is slightly younger than the population of North African descent.
7 Table 1: Duration of presence in France by nationality of migrants
Duration of stay in France / sending of remittances to Between 0 and 5 years Between 5 and 10 years Between 10 and 20 years Over 20 years Born in France Sub-Saharan Africa 10,3% 21,9% 30,6% 20,9% 15,3% Turkey 12,7% 18,4% 27,6% 21,4% 19,9% Tunisia 5,6% 16,8% 21,4% 26,5% 29,6% Algéria 6,1% 9,7% 14,8% 33,7% 35,7% Morocco 3,2% 9,7% 13,4% 34,3% 39,4% Total 7,7% 15,2% 21,4% 27,5% 28,2%
Source: Survey 2MO
Table 2: Age structure and respondents’ nationalities
Age of migrants interviewed 18-25 years 25 - 34 years 35 - 44 years 45 - 54 years 55 - 64 years More than 65 years Sub-Saharan Africa 8,7% 31,1% 33,2% 20,9% 4,6% 1,5% Turkey 10,7% 28,6% 34,2% 18,9% 5,6% 2,0% Tunisia 5,6% 34,2% 34,7% 13,3% 10,2% 2,0% Algeria 7,1% 34,2% 29,6% 16,8% 8,7% 3,6% Morocco 16,2% 32,4% 21,3% 12,5% 14,8% 2,8% Total 9,8% 32,1% 30,4% 16,4% 8,9% 2,4%
Source: Survey 2MO
Table 3: Marital status of migrants according to the country of destination of the remittances
Marital status Single Divorced,
separated Widower In married life Married
Sub-Saharan Africa 23,7% 10,3% 2,1% 5,7% 58,2% Turkey 20,9% 6,1% 1,0% 1,5% 70,4% Tunisia 23,5% 12,2% 0,5% 2,0% 61,7% Algeria 26,8% 5,7% 1,5% 4,1% 61,9% Morocco 25,6% 9,8% 0,5% 3,3% 60,9% Total 24,1% 8,8% 1,1% 3,3% 62,6%
Source: Survey 2MO
Our sample is composed of a majority of cohabiting or married households. We find that one third of migrants surveyed are unmarried, divorced or widowed. Two-thirds of migrants in the sample have at least one child in France or the country of origin. The proportion of people with children is higher among migrants from Sub-Saharan Africa (45% have three or more children, 20% have children in the country of origin). Conversely, nearly 40% of the Moroccan and Algerian migrants have no children.
In conclusion, we therefore have a population of migrants, composed mainly of families with children and who have been France for a long time, especially for those from the Maghreb. It should be noted that children who are second generation immigrants, born in France, are
8 responsible for nearly one third of the total of medium-sized remittances, this figure is even larger for remittances to the Maghreb countries.
Departure conditions and remittances
Let us now consider the conditions of emigration to France, because it is often a factor influencing the amount, nature and duration of transfers to the country of origin. Our survey provides information on the conditions of departure: did they emigrate alone or with family, did they arrive directly on French soil, and were they helped and if yes, by whom?
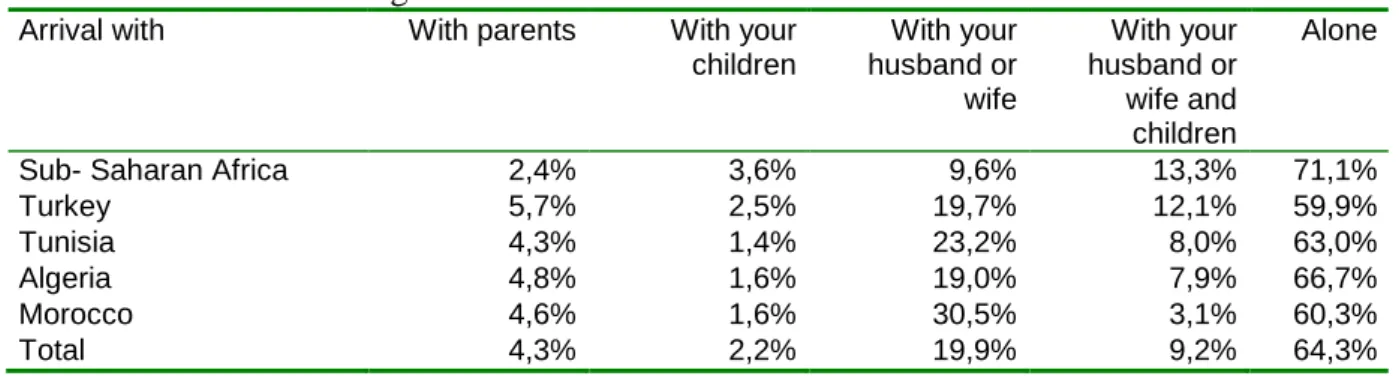
Most of the migrants in our sample arrived in France alone (Table 4). This is especially true for migrants from Sub-Saharan Africa (71% seven points above the average). This does not mean they are unmarried, but that in some cases their wives and families remained in the country of origin. The migrants usually arrive in France directly without having previously passed through another country. Nevertheless, depending on nationality, we observe significant differences. Fifteen to 17% of migrants from Sub-Saharan Africa and Morocco passed through Spain. More than 20% of Turkish migrants passed through Germany, principal host country before coming to France (Table 5).
An important aspect of remittances behavior resides in the financial support initially received by the migrant in order to settle in France. The funding inevitably leads to a repayment of a debt that will partly determine the transfers to families back home. However, the financial aid received by migrants in our sample does not come from families who remained in the country of origin but from relatives already settled in France (Table 6).
Moroccan immigrants were the least helped (27.5% unsupported versus 19% on average). They are also those who were the least assisted by the families who remained in the country of origin (10 to 12 points lower than the average).
9 Table 4: Conditions of migration
Arrival with With parents With your
children With your husband or wife With your husband or wife and children Alone
Sub- Saharan Africa 2,4% 3,6% 9,6% 13,3% 71,1%
Turkey 5,7% 2,5% 19,7% 12,1% 59,9%
Tunisia 4,3% 1,4% 23,2% 8,0% 63,0%
Algeria 4,8% 1,6% 19,0% 7,9% 66,7%
Morocco 4,6% 1,6% 30,5% 3,1% 60,3%
Total 4,3% 2,2% 19,9% 9,2% 64,3%
Source: Survey 2MO
Table 5: Transit through another country before arriving in France
Transit through other countries No Yes
Sub- Saharan Africa 85,5% 14,5% Spain
Turkey 79,6% 20,4% Germany, Greece
Tunisia 89,9% 10,1% Italy, Spain
Algeria 95,2% 4,8%
Morocco 82,4% 17,6% Spain
Total 86,2% 13,8%
Source: Survey 2MO
Table 6: Financial assistance for the path of emigration
Financial assistance Through other
people from your country who were in France
Through relatives, parents who were already in France
Through relatives, parents back home
No one
Sub- Saharan Africa 28,8% 46,6% 30,1% 18,4%
Turkey 35,9% 44,9% 30,1% 18,6%
Tunisia 27,9% 51,5% 36,8% 14,0%
Algeria 25,2% 59,3% 27,6% 18,7%
Morocco 20,6% 56,5% 6,9% 27,5%
Total 28,1% 51,2% 26,7% 19,3%
Source: Survey 2MO
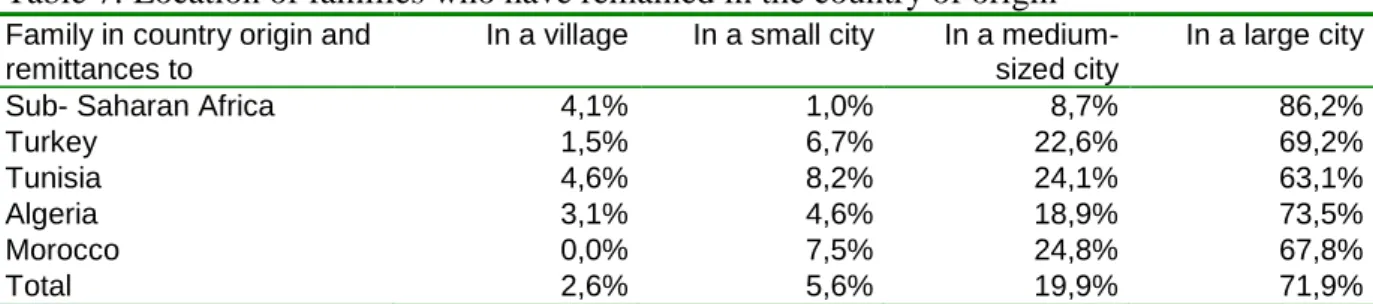
It goes without saying almost all of that the migrants have the family in their country of origin. The majority of migrants’ families live in large cities (Table 7). Internal migration towards cities often precedes international migration. It is in Tunisia that we find the greatest number of migrants’ families of residing in villages or small towns (13% versus 7% on average for other nationalities).
Finally, in general, immigrants return regularly to their countries of origin. Only 8% of migrants in the sample, on average, have never returned (Table 8). This rate is double that for the most recent migrants, that is to say, those originating from Sub-Saharan Africa and Turkey. It is Moroccans and Tunisians who return most often to see their families. Remittances during these trips are more frequent for these nationalities (Table 9).
10 Table 7: Location of families who have remained in the country of origin
Family in country origin and remittances to
In a village In a small city In a medium-sized city
In a large city
Sub- Saharan Africa 4,1% 1,0% 8,7% 86,2%
Turkey 1,5% 6,7% 22,6% 69,2%
Tunisia 4,6% 8,2% 24,1% 63,1%
Algeria 3,1% 4,6% 18,9% 73,5%
Morocco 0,0% 7,5% 24,8% 67,8%
Total 2,6% 5,6% 19,9% 71,9%
Source: Survey 2MO
Table 8: Table 8: Return to the country of origin of the migrants
Migrants having return to country of origin No Yes
Sub- Saharan Africa 15,8% 84,2%
Turkey 15,3% 84,7%
Tunisia 4,1% 95,9%
Algeria 3,6% 96,4%
Morocco 1,4% 98,6%
Total 7,9% 92,1%
Source: Survey 2MO
Table 9: Frequency of trips to the country of origin Frequency of return in
the country of origin
Once every 5 to 10 years Once every 3-4 years Once every 2 years
Once a year Several times a year
Sub- Saharan Africa 14,0% 26,2% 25,6% 28,7% 5,5%
Turkey 4,8% 16,3% 23,5% 39,2% 16,3%
Tunisia 0,5% 2,7% 18,1% 61,2% 17,6%
Algeria 1,1% 7,9% 36,5% 43,4% 11,1%
Morocco 0,9% 7,1% 17,5% 51,9% 22,6%
Total 3,9% 11,4% 24,0% 45,6% 15,0%
Source: Survey 2MO
Thus, migrants from the sample tend to come alone and are usually assisted more by families in the host country than families in the country of origin. However, we must emphasize that migrants from poor countries in Sub-Saharan Africa are more often helped by the families left behind in their country of origin. In result, we may see remittance sending behavior related to the obligation to repay the original debt. Overall, migrants regularly return to their country of origin, except in the case of the poorest countries and those that are the most distant.
Level of education, labor market, living conditions
To better understand the determinants of remittances, we must now turn our focus to migrants’ training, qualifications, and their situation in labor markets and more generally to their living conditions (income, housing) in the country of origin.
11 The level education6
The situation of migrants on the labor market is quite heterogeneous (Table 11). Fifteen percent of them are unemployed, even if the number of those who declare unemployment is relatively low. Moroccans are among those who are affected the most (29%). The Turks and Tunisians are more likely to be self-employed (16% and 14%).
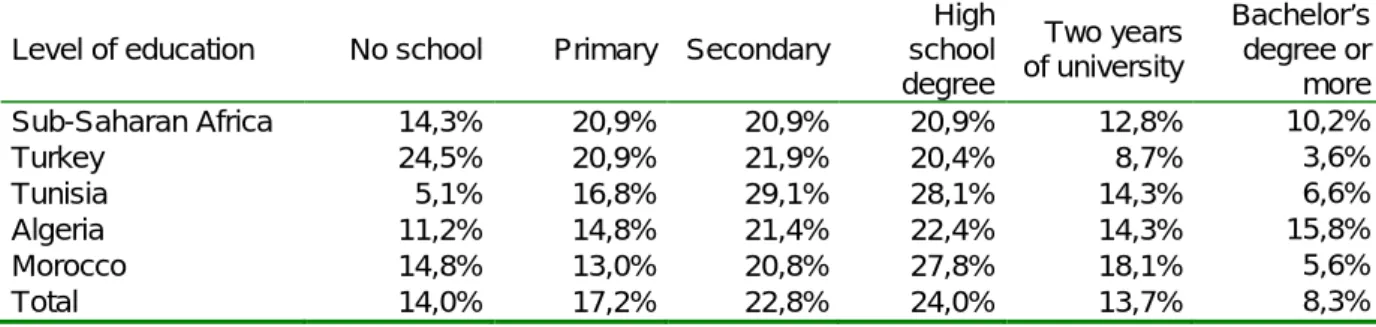
of is higher in the case of the countries of North Africa (Table 10). Près d'un tiers des Algériens et un quart des Marocains ont un niveau universitaire contre seulement 12% pour les Turcs. Nearly one third of Algerians and one fourth of Moroccans have some university education compared to only 12% for Turks. Among those who have a lower education level (at most at the primary level), we find 45% of Turks, 35% of those from Sub-Saharan Africa and 25% of the population originating from the Maghreb countries.
Migrants from Sub-Saharan Africa are overwhelmingly renters (92%) while migrants from North Africa are more often property owners (about 20% of them). This percentage increases to nearly 25% for Tunisian immigrants (Figure 2).
Overall, skilled migrants are more numerous than the rhetoric on migration would lead us to believe, which confirms the results of the recent economic literature on international migration. However, we also find that these migrants are more vulnerable to unemployment. Du point de vue des catégories socioprofessionnelles les employés et ouvriers sont largement dominants. In terms of occupational categories employees and workers are the more dominant categories. However, Turkish migrants are more often artisans, particularly within in the construction industry, and the proportion of executives is higher among Algerians and Tunisians.
6 The educational level is divided into six categories : no school, primary, secondary, high school degree, two years of university and
12 Table 10: Educational level of migrants
Level of education No school Primary Secondary
High school degree Two years of university Bachelor’s degree or more Sub-Saharan Africa 14,3% 20,9% 20,9% 20,9% 12,8% 10,2% Turkey 24,5% 20,9% 21,9% 20,4% 8,7% 3,6% Tunisia 5,1% 16,8% 29,1% 28,1% 14,3% 6,6% Algeria 11,2% 14,8% 21,4% 22,4% 14,3% 15,8% Morocco 14,8% 13,0% 20,8% 27,8% 18,1% 5,6% Total 14,0% 17,2% 22,8% 24,0% 13,7% 8,3%
Source: Survey 2MO
Table 11: Professional Activity of Migrants
Current professional activity You are
an employee
You are self-employed
You do not work
Unemployed Inactive Sub-Saharan Africa 83,5% 5,7% 4,0% 6,8% Turkey 72,3% 16,8% 3,8% 7,1% Tunisia 76,5% 14,2% 3,3% 6,0% Algeria 79,7% 6,2% 6,2% 7,9% Morocco 66,7% 4,4% 9,8% 19,1% Total 75,6% 9,5% 5,4% 9,4%
Source: Survey 2MO
Figure 2: Housing Conditions of Migrants
Source: Survey 2MO
0,0% 20,0% 40,0% 60,0% 80,0% 100,0% Sub-Sah. Africa Turkey Tunisia Algeria Morocco Total
Housing Conditions of Migrants
Other
tenant in a council flat Tenant
collective household type accommodated by relatives filed by employer
13
Revenue savings amounts and remittance sending channels
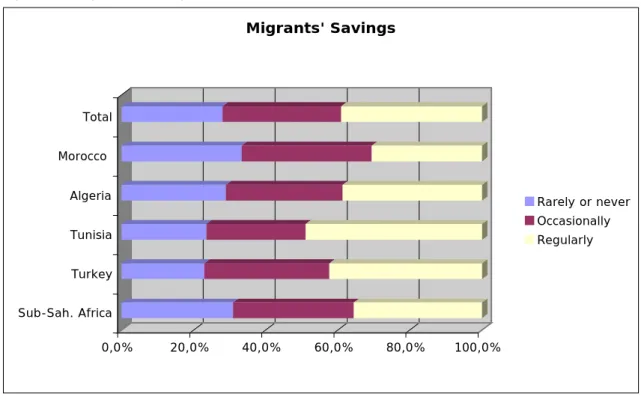
The median income of migrants is around 1,750 euros per month per household. The distribution of household income revealed a high percentage of low income for Moroccans and Sub-Saharan migrants, which is consistent with their higher level of unemployment. Conversely, the level of income for Turkish migrants is concentrated around the median, despite their lower qualifications. The Tunisians and the Turks save more than Moroccans and migrants from Sub-Saharan Africa, which is consistent with their income levels (Figure 3). La plus ou moins grande confiance dans le système bancaire a aussi son impact. The level of confidence (more or less) in the banking system also has an impact. There are only 25 to 30% of Africans and Algerians who are completely confident in their banking system, which is a very low, but understandable, rate (Figure 4).
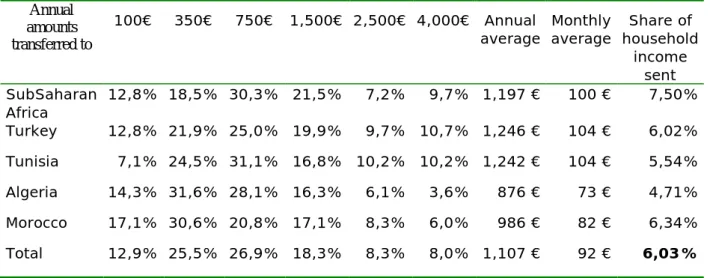
Most annual transfers involve amounts in between 200 and 1,000 Euros. The distribution is rather skewed towards the first median bracket of 200 to 500 € for transfers to Morocco and Algeria. The average amount is € 1,107 per year, which comes out to an average of 92 € per month is a bit higher than the median amount due to the presence of very large amounts of remittances in tail distribution. The average transfer is 1,187 € per year (Table 12). The average transfers to Turkey and Tunisia, as well as to other African countries amount to around € 100, while transfers to Morocco are 82 € and those sent to Algeria are 73 €. These average amounts are relatively close to what is regularly observed in other surveys7
To get an idea of the effort exerted by the migrant, we can compare the annual remittance amount to the annual household income. An annual remittance of 1,500 € does not require the same effort when the annual household income is 13,500 € as when it is 60,000 €. In the first case, the household will send 9.1% of its income, while in the second case the share of income transferred is only 2.5%. In total, the average amount transferred is 6% of household income. If, for example, we only took into account the income of the head of the household, that percentage would obviously be higher. The percentage of income transferred is higher in the case of migrants from Sub-Saharan Africa (7.5%) and Moroccans (6.34%). The percentage for Algerians (4.7%) is one third lower than Moroccans (Table 12). Households with lower incomes seem to transfer a greater share of their income. The median frequency of transfers is between 3 and 6 times per year, such that the average frequency is almost bimonthly.
.
14 Figure 3: Migrants' savings
Source: Survey 2MO
Figure 4: Confidence in the banking system of the country of origin
Source: Survey 2MO
0,0% 20,0% 40,0% 60,0% 80,0% 100,0% Sub-Sah. Africa Turkey Tunisia Algeria Morocco Total Migrants' Savings Rarely or never Occasionally Regularly 0,0% 20,0% 40,0% 60,0% 80,0% 100,0% Sub-Sah. Africa Turkey Tunisia Algeria Morocco Total
Confidence in the banking system of the country of origin
Not at all
Rather not confident DK
Fairly confident Quite confident
15
Table 12: Average annual amounts sent to recipient countries
Annual amounts transferred to
100€ 350€ 750€ 1,500€ 2,500€ 4,000€ Annual
average Monthly average household Share of income sent SubSaharan Africa 12,8% 18,5% 30,3% 21,5% 7,2% 9,7% 1,197 € 100 € 7,50% Turkey 12,8% 21,9% 25,0% 19,9% 9,7% 10,7% 1,246 € 104 € 6,02% Tunisia 7,1% 24,5% 31,1% 16,8% 10,2% 10,2% 1,242 € 104 € 5,54% Algeria 14,3% 31,6% 28,1% 16,3% 6,1% 3,6% 876 € 73 € 4,71% Morocco 17,1% 30,6% 20,8% 17,1% 8,3% 6,0% 986 € 82 € 6,34% Total 12,9% 25,5% 26,9% 18,3% 8,3% 8,0% 1,107 € 92 € 6,03%
Source: 2MB survey, authors' calculation
Channels used
The transfers identified in this survey are those that are mainly made through Western Union, money order, or interbank transfer payment in post offices. In the sample, eight or nine out of ten most frequently use Western Union. Migrants from Sub-Saharan Africa mainly use this type of channel, while 10 to 12% of the other nationalities use the money order. Moreover, nearly 10% of Turks and Moroccans primarily use their banking networks. Morocco and Turkey have actually developed many banking tools aimed at migrants and agencies in France.
Confidence in the banking system plays a role in the choice of channel. While most migrants maintain that they are fairly confident in the banks of their country, especially in the case of Turks, Moroccans and Tunisians, this is not the case for migrants from Sub-Saharan Africa, where one third do not trust them at all (Figure 4). Among the countries of the Maghreb, confidence is the lowest in Algeria (19% do not trust the banks versus 14% for Moroccans and 9% for Tunisians). It is not surprising that it is the Algerians and migrants from Sub-Saharan Africa who use informal channels more often.
Conclusion
The migrant population in the sample is composed mainly of families with children and who had been in France for a long time, especially for those coming from the Maghreb. The second generation immigrants, who are children of immigrants born in France, are responsible for nearly one third of total average transfers and even more for remittances specifically to the
16 Maghreb countries. These migrants tend to arrive alone and are usually more often assisted by family in the host country than families in the country of origin, except for migrants from Sub-Saharan countries who are supported to a greater extent by the families left behind. On the whole, migrants regularly return to their country of origin.
While the number of skilled migrants is relatively large, they still remain more vulnerable to unemployment. Moreover, they are dominantly employees and workers in terms of occupational categories. Migrants transfer on average around 100 Euros per month for a median income of 1,750 Euros per month per household. Migrants from countries with low income transfer a higher percentage of their income (about 8% of household income against 6% on average). Confidence in the banking system plays a role in the choice of channels used to send remittances. Distrust of the banking system in the country of origin remains high, except in the case of the Moroccans, Tunisians and Turks.
It is now appropriate to describe migrants’ remittance behavior and use of remittances using their objective characteristics analyzed above, as well as to use the answers to more subjective issues related to the attachment to the country of origin, the moral obligation to send remittances, the desire to return to the country of origin. This analysis will enable us to propose a typology of migrants that takes into account remittance sending behavior.
2. Different behaviors depending on nationality
2.1. Remittance amounts and the characteristics of migrants
We describe the behavioral differences between individuals of the survey sample 2MO with respect to amounts transferred. Taking into account the selection bias that occurs by only surveying households that transfer, these results cannot be generalized to the overall behavior of migrants. Ce modèle se décline à l'aide de l'équation réduite suivante estimée par les MCO car la variable du montant transféré est quantitative (tableau 13). This model is developed with the following reduced equation estimated by OLS because the variable of the amount transferred is quantitative (Table 13).
1 2 3 4 5
i i i i i i i i i
17 Where the dependent variable T corresponds to the amount of the transfer reported by the household
The objective variables of control are:
R = the reported amounts of household income, N = the nationality of the migrant
A = the age of the migrant
FSF = the size of the migrant’s family in the host country (number of French children) SG = born in France
Edu = the level of education of the migrant Hab = home ownership
ChocF = shock to the family in the country of origin
VS = the vector of variables including the following subjective variables - The intention to return to their country of origin
- The degree of attachment to the country of origin
The variable Edu (education) was added because contrary to what one might think; it is not collinear with the income variable. A disconnect is observed, in testing the relationship of co linearity between educational attainment and income migrants8. This could be explained by the effect of having overqualified individuals in the labor market where information asymmetry allows employers to attribute average pay levels to migrants.. It should be noted that this result is obtained in the case of our sample for the nationalities in our survey. It is likely that income and education level would be collinear in the case of European migrants9 The variable ChocF is explained through a question about the obligation to transfer in case of a shock in the family in the family of origin (accident, illness)
.
10
The subjective variables VS are obtained from two questions: one on the intention to return to the country of origin, and the other on the degree of attachment to the country of origin.
.
We find that the answer to the degree of attachment is positively correlated with the amount of remittances.
8 The correlation coefficient is smaller than 0.10.
9 It is of course not possible to make generalizations based on this equation because of the sample selection bias that needs to be
corrected.
10 The question in the survey is the following: « did you have to send money for an unforeseen family event like a health problem or a
18
TABLE 13:
Notes: 1. Robust standard errors are in brackets. 2. * significant at 10%; ** significant at 5%; *** significant at 1%. OLS to predict the amount of remittances by migrants
Amount remittances (ln) Equation 1 Equation 2 Equation 3 Equation 4 Equation 5
Coef. Coef. Coef. Coef. Coef.
Constant 2.427 *** 2.597 *** 3.228 *** 2.720 *** 2.776 ***
(0.456) (0.464) (0.451) (0.454) (0.440)
Sub-Saharan Africa: reference modality
Turkey -0.054 -0.063 -0.029 -0.045 -0.041 (0.106) (0.108) (0.106) (0.110) (0.109) Tunisia 0.060 0.017 0.094 0.106 0.076 (0.100) (0.103) (0.102) (0.101) (0.101) Morocco -0.141 -0.203 * -0.078 -0.109 -0.188 * (0.101) (0.104) (0.105) (0.103) (0.106) Algeria -0.270 ** -0.320 ** -0.213 ** -0.252 ** -0.268 ** (0.101) (0.102) (0.103) (0.101) (0.101) Revenue (ln) 0.434 *** 0.459 *** 0.438 *** 0.415 *** 0.406 *** (0.062) (0.063) (0.060) (0.062) (0.06) Age 0.133 *** 0.145 *** (0.031) (0.032) Number of children born
in France -0.072 * -0.088 ** (0.037) (0.038) Born in France -0.527 *** (0.072) No schooling 0.232 ** 0.148 * (0.105) (0.105) Primary 0.171 * 0.118 (0.093) (0.094) Secondary 0.054 0.050 (0.087) (0.086)
High School degree Reference modality
Bachelor’s degree 0.274 ** 0.227 * (0.116) (0.117) Obligation 0.289 *** 0.314 *** 0.267 *** 0.314 *** 0.308 *** (0.069) (0.069) (0.069) (0.070) (0.069) Intention of returning 0.265 *** 0.274 *** 0.241 *** (0.044) (0.046) (0.045) Attachment 0.235 *** 0.171 ** (0.069) (0.069) Home ownership 0.304 *** (0.069) Number of observations 986 986 988 988 988 R-squared 0.166 0.144 0.165 0.155 0.173
19 It first appears clear that Algerian and Moroccan migrants tend to send significantly lower amounts of remittances than other migrants in the sample. The obligation to send money, related to an unexpected event (health problem or death) significantly increases the amount of the remittance, independent of the level of income of the respondent. . The existence of a resettlement project in the country increased considerably and significantly the remittance. This result indeed corresponds to that found in recent literature.
Regarding the intrinsic characteristics of migrants, we obtain the following results. The level of education (school, primary, secondary, high school degree, bachelor’s degree and up) goes in the theoretically expected direction: among the survey respondents, those who did not attend school send higher amounts of remittances. However, for those migrants who have obtained a certain level of education (bachelor’s degree and up), the amounts also become very high. Migrants with a medium level of education (secondary schooling and associate’s degrees) are those who tend to send lower amounts of remittances. Their educational level is not correlated with levels of income, which reflects the imperfections of the labor market and the effects of hiring overqualified individuals, a pattern, which particularly affect migrants, as has been noted by sociological studies11
Remittances also increase according to the age of migrants. Of those individuals earning the same amount of income, those over 65 years old tend to transfer twice as much as 25-34 years.
.
Finally, we have introduced a subjective characterization related to the degree of attachment to the country of origin. This variable explains significantly and strongly the higher level of remittances.
Thus, the typical profile of the individual who sends more remittances is the migrant originating mostly from Sub-Saharan Africa, Tunisian or Turkish, with no schooling, poorly educated or, to a lesser degree, very educated (bachelor’s degree and up) forced by a family event, or the rather old migrant from the Maghreb, with a resettlement project (which is more or less certain) to his country of origin and declaring a strong attachment to the country of origin. The profile of the migrant who does not send many remittances is more often Algerian or Moroccan, moderately educated (secondary or just associate’s degree), not having much of a desire to resettle to his country of origin, relatively younger and declaring little attachment to his country of origin.
11 Some sociological surveys show that those most discriminated against or underpaid in the labor market are migrants with either a high
school national diploma or 2 years of university. See for example, Beaud S., Pialoux M. (2003) “Violences Urbaines, violence sociale: Genèse des nouvelles classes dangereuses”, Fayard, Paris.
20
The stated objectives of migrants’ remittances
Remittances for the purpose of consumer spending and health are priorities in the minds of migrants, since over 80% of migrants report sending remittances for the purpose of consumption expenditure and 70% for health. The reason that comes in third place is to finance children's education (26 to 29% of respondents). Financial investments are only made by 6 to 12% of migrants, depending on nationality. This type of motivation is twice as high for Tunisians and migrants from Sub-Saharan Africa (12%) than for Turks and Moroccans (6%). The funding of a local company is of particular interest to Tunisians (4% of remittances to Tunisia). Finally, remittances for the village or neighborhood (collective remittances) correspond to 3 to 4% of migrants' remittances (Table 14).
When an exceptional event occurs in the family of origin, nearly 60% of migrants who send remittances feel obligated to send money (Table 15).
Table 14: Distribution of remittances by objectives, according to nationalities Consumer spending Health expenditure To Finance Education Arrangements in your home Local Business
For your town Financial Investments Sub-Saharan Africa 78,1% 66,3% 27,0% 14,3% 2,0% 3,1% 11,7% Tunisia 84,3% 73,6% 27,4% 13,2% 3,6% 4,1% 11,7% Turkey 86,2% 71,9% 29,1% 8,2% 0,5% 3,1% 6,1% Algeria 83,7% 68,9% 28,1% 10,2% 1,0% 1,5% 8,7% Morocco 80,0% 72,6% 20,9% 11,2% 1,4% 4,2% 6,5% Total 82,4% 70,7% 26,4% 11,4% 1,7% 3,2% 8,9%
Source: Survey 2MO
Table 15: Obligation to send remittances for an exceptional event
Obligation to send for exceptional event No Yes
Sub-Saharan Africa 34,4% 65,6% Turkey 36,2% 63,8% Tunisia 48,5% 51,5% Algeria 39,8% 60,2% Morocco 44,9% 55,1% Total 40,8% 59,2%
21
Fig 5: possession of a dwelling in the country of origin
22
Table16.
Possession of a dwelling in the country of origin (1/0)
Probit to predict the home ownership in the country of origin.
Equation 1 Equation 2 Equation 3 Coef. Coef. Coef.
Constant -1.643 ** -1.308 ** -1.932 ***
(0.612) (0.606) (0.605)
Country of origin:
(Sub-Saharan Africa: reference modality)
Turkey 0.022 0.048 -0.024 (0.138) (0.136) (0.138) Tunisia 0.144 0.150 0.242 * (0.135) (0.135) (0.135) Morocco 0.607 *** 0.583 *** 0.678 *** (0.137) (0.137) (0.134) Algeria 0.117 0.103 0.171 (0.138) (0.139) (0.136) Attachment 0.371 *** 0.372 *** 0.376 *** (0.094) (0.093) (0.093) LN Revenue 0.040 -0.002 0.085 (0.081) (0.08) (0.079) Resettlement 0.235 *** 0.248 *** 0.232 *** (0.06) (0.06) (0.059) Age
(Less than 25 years old: reference modality)
Between 25-34 0.034 (0.161) Between 35-44 0.193 (0.163) Between 45-54 0.645 *** (0.177) Between 55-64 0.891 *** (0.205) More than 65 years 1.346 ***
(0.333)
Duration of presence in France
(Born in France: reference modality)
Less than 5 years -0.002 (0.183) Between 5-10 0.029
(0.138) Between 10-20 0.195
(0.125) More than 20 years 0.689 ***
(0.115)
Level of education
(High School degree: reference modality)
No schooling 0.724 *** (0.133) Primary 0.420 *** (0.12) Secondary 0.003 (0.113) Bachelor’s degree 0.361 ** (0.166) Number of observations 988 988 988 Wald chi² (12) 126.28 121.17 109.88 Prob > chi² 0.000 0.000 0.000 Log pseudolikelihood -601.56 -609.16 -613.16 Pseudo R² 0.1094 0.0981 0.0922
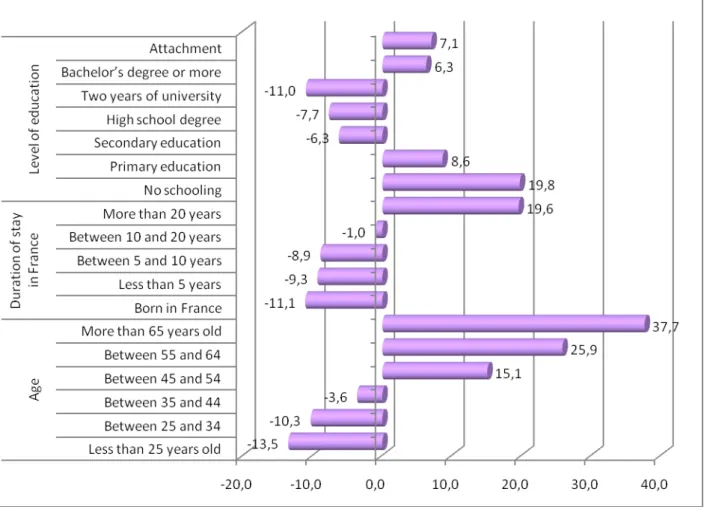
23 The age of migrants does not seem to be important in the pattern of buying real estate because over 60% of the older migrants who send remittances already own a family home in the village or country of origin (Figure 5)12
Non-educated migrants who have been settled in France for some time also have the same behavior in terms of remittances (Figure 5). The level of education in relation to the home ownership also follows a sort of U-shaped curve. The highest rates of home ownership in the country of origin are at two extremes: it is the non- educated present in France for over twenty years that most often own a residence, with, to a lesser degree, the highly educated (bachelor’s degree and up). The opposite is true for those who have attended some high school and high-school graduates.
. Moreover, when we estimate the variable home ownership in the country of origin with the duration of settlement, we obtain a positive and highly significant correlation (Table 16).
2.2.
To complete our results, we must specify the characteristics of our migrants attached to their country of origin, using a multiple correspondence analysis (MCA) done by identifying objective variables (country of origin of migrants, age, length of stay in France and level of education). Each variable was divided into layers and each layer was then treated as a dichotomous variable thus obtaining a typology based on the first five factorial axes treated as new synthetic variables
A typology of migrant behavior.
13
Table 17 shows the correlations between the typological classes and the modalities by which they are built. The Khi² and Monte Carlo tests
. Finally, a correlation analysis allows us to specify the composition of the typology groups and their association with the variable indicating the attachment to country of origin.
14
12 Furthermore, the model was estimated by excluding from ours ample those migrants who already owned a house/apartment in the
country of origin. This can explain why age was not a significant variable in the equation.
conducted on the association between the variable "belonging to a class" and attachment to the country of origin converge towards the acceptance of a significant and positive association for Classes 2 and 3, negative for Class 1 and not significant for Class 4. In addition, we can see correlations between the classes and
13 The number of axes to be retained for the analysis is determined by calculating modified Eigenvalues. In annex 4, one table shows
Eigenvalues for five axes, and a second table resumes the results by classes. The four classes have the same number of individuals.
14 The Monte Carlo allows the calculation of a distribution of the Khi² distance on the basis of simulations constrained by a respect of the
totals of the k groups. We obtain a more reliable critical value through the empirical distribution (assuming that the number of simulations is large enough (5000 in this case) than the one obtained through the theoretical distribution of the Khi² corresponding to the asymptotic case. .
24 the variable of attachment to the country of origin and those that describe the desire to return to the country of origin.
Class 1 might be called the "second generation", mainly composed of people born in France of Moroccan origin, rather young (under 35 years of age) and high-school degree or associate’s degree. This class presents a negative and significant correlation with the variable that reflects the attachment to the country of origin. Equally obviously, this "second generation" is not willing to settle in the country of origin of the family.
The Class 2, that of "Chibanis15
Class 3, which may be called "mandated migrants" (sent by families with the goal of receiving remittances), is composed of migrants from Sub-Saharan Africa, aged between 34 and 54 years old, where their duration of stay in France is between five and 20 years and, and who have a primary and secondary level of education. These migrants who send remittances for reasons of obligation (daily expenses) still remain attached to their country of origin and declare their desire to return.
",
that is to say the old migrants from the Fordist period, is mostly composed of Algerians and Moroccans, older, present in France for over 20 years and very low or no level of schooling at all. This class presents a significant and positive correlation with the variables related to attachment and to “intention to resettle” in their countries of origin.
Class 4, which belong to the "new migration" qualified sometimes by themselves "Harragas16
15 Chibanis, "white hair" in dialectal Arabic, are the old immigrants from the Maghreb. They are arrived in France during the period of
growth, which are sometimes called the “Thirty Glorious”, while the country needed arm. They all experienced a situation leading them of the exile to the implanting in the French society, without giving up their identities, their values in their past. (Sabrina Kassa, Gérard Noiriel, Zabou Carrière, (2006), Nos ancêtres les Chibanis ! Portraits d'Algériens arrivés en France pendant les Trente Glorieuses, Editions Autrement, Paris).
" is rather composed by young Algerians, whose duration of stay in France less than ten years, with a level of education rather high or very high. Individuals belonging to this class does not seem attached to their country of origin. Their departure reflects a greater effect of repulsion towards their country of origin instead of "Chibanis" whose immigration was sponsored by French companies in sectors from Fordism.
16 The word is native of Arabic from Maghreb, which is translated by "whom burn” or “Burners of borders” (papers, in reference to the
25 TABLEAU 17 : CORRELATION MATRIX (PEARSON)
Class-1 Class-2 Class-3 Class-4
" Second generation" "Chibanis" "Mandated migrants" "Harragas" Countries of origin Sub-African countries -0.128 *** -0.119 *** 0.184 *** 0.050 ns Turkey -0.063 ** -0.090 *** 0.157 *** -0.018 ns Tunisia -0.029 ns -0.015 ns 0.008 ns 0.036 ns Morocco 0.216 *** 0.115 *** -0.190 *** -0.131 *** Algeria -0.004 ns 0.105 *** -0.153 *** 0.068 ** Age
Less than 25 years old 0.527 *** -0.186 *** -0.200 *** -0.128 ***
Between 25-34 0.160 *** -0.372 *** -0.365 *** 0.639 ***
Between 35-44 -0.196 *** -0.169 *** 0.587 *** -0.286 ***
Between 45-54 -0.210 *** 0.298 *** 0.090 ** -0.195 ***
Between 55-64 -0.173 *** 0.531 *** -0.200 *** -0.150 ***
More than 65 years old -0.091 ** 0.290 *** -0.110 *** -0.084 **
Duration of the stay in France
Born in France 0.795 *** -0.331 *** -0.349 *** -0.086 **
Less than 5 years -0.144 *** -0.163 *** -0.105 *** 0.442 ***
Between 5 and 10 years -0.224 *** -0.239 *** 0.118 *** 0.351 ***
Between 10 and 20 years -0.234 *** -0.271 *** 0.680 *** -0.244 ***
More than 20 years -0.319 *** 0.871 *** -0.305 *** -0.235 ***
Level of education No schooling -0.219 *** 0.325 *** -0.004 ** -0.108 *** Primary -0.248 *** 0.208 *** 0.162 *** -0.143 *** Secondary -0.203 *** -0.050 ** 0.169 *** 0.072 ** High-school 0.335 *** -0.202 *** -0.065 ** -0.064 ** High-school degree 0.419 *** -0.184 *** -0.187 *** -0.033 **
Bachelor and more -0.117 *** -0.076 ** -0.140 *** 0.362 ***
Project to return -0.210 *** 0.069 ** 0.115 *** 0.016 ns
Attachment -0.195 *** 0.075 ** 0.100 ** 0.011 ns
Note: 1. * significant at 10%; ** significant at 5%; *** significant at 1%. 2. ns = no significant.
General Conclusion
The behaviors of migrants regarding remittances differ depending on the level of poverty in the country of origin and history of waves of immigration. Thus, in France, the factors those lead migrants to send money to different countries according to their countries of origin, for example Sub-Saharan Africa or the Maghreb. According to our survey, the first transfer more than the latter, regardless of their objective characteristics (age, qualifications, income and family size). These remittances are designed almost exclusively for daily expenses (health,
26 education, food). The variable “obligation to transfer” largely determines the remittance behavior of Sub-Saharan migrants. Conversely, this research shows that among migrants from the Maghreb and Turkey, are those belonging to the older generation, with little education, who came in the years 1960-1970, who send the most remittances. Their commitment to the country of origin appears to be the main motivation. New waves of immigration from North Africa, installed in the 1990s, better skilled, and who often feel repulsion towards their country of origin, as illustrated by the phenomenon of "Harragas" Algerian. Except in the case of countries with lower per capita income, where remittances are precisely the reason for emigration, the detailed analysis of the motivations of migrants relativizes the transfers focus on consumption. The emigrants in poor countries have in fact little choice: they are often organized in associations per village and perform group transfers, and usually invest in infrastructure: water, roads and schools ... in addition to individual parcels for families.
As for the host country, three major problems exist: the still exorbitant levies or charges on official transfers, the fact that remittances are not taken into account in policies of co-development. On average, transaction costs by formal channels reached 12% to 15% of remittances or 25% when small amounts. The quasi-monopoly of certain organizations of financial intermediation and the distrust of the banking systems of their countries of origin why migrants accept such "ransom" but also because of the fact that the exchange rates are more favorable within informal channels. The second difficulty is the north side of the impact of selective policies rewarding qualified individuals. These individuals usually settle permanently in the host country, particularly because they can more easily comply with the conditions for family reunification. They are sending less money home. This negatively impacts growth rates, especially direct investment and short-term capital fled countries with low human capital stock. Hence a vicious cycle: less human capital, less FDI, less growth and so therefore there exist more candidates for emigration.
Last obstacle: we rarely address the issue in relation to the so-called policies for co-development which remain relatively vague as their goals and their effects appear contradictory. Promoting the return of migrants and projects to curb the incentive to emigrate ignores the fact that remittances respond to specific needs of families. This social safety net can paradoxically reduce the number of candidates in a desperate economic emigration. In contrast, restrictive policies regarding the unskilled, reducing the volume of remittances, contributing to deteriorating economic conditions in sending countries, and thus exacerbates emigration.
27
Bibliography
Beaud S., Pialoux M. (2003) Violences Urbaines, violence sociale. Genève des nouvelles classes dangereuses, Fayard,
CARIM (2005), "Mediterranean Migration, 2005 Report", edited by P. Fargues, Euro-Mediterranean Consortium for Applied Research on International Migration, (CARIM).
FEMIP (2006), Study on improving the efficiency of workers’ remittances in Mediterranean countries, European Investment Bank, Rotterdam, February.
Miotti L., Mouhoud E.M., Oudinet J., (2009), " Migration and determinants of Remittances to Southern Medeterranean countries: When history matters!, ", paper presented at 57th Congrès Annuel de lAFSE, Paris, and 29th annual meetings of the MIDDLE EAST ECONOMIC ASSOCIATION (MEEA) in conjunction with annual meetings of the ALLIED SOCIAL SCIENCE ASSOCIATIONS (ASSA), January 3-5, 2009, San Fransisco, CA, and Second International Conference on MIGRATION AND DEVELOPMENT, WORLD BANK, Washington DC, september 10-11, 2009, and WP CEPN n°2009-17.
Mouhoud E.M., Oudinet J., Unan E. (2007) Macroeconomic Determinants of Migrants’ Remittances in the Southern and Eastern Mediterranean Countries, 6th International Conference of the MIDDLE EAST ECONOMIC ASSOCIATION (MEEA), Dubai 14-16 March 2007 and WP. CEPN.
OECD, (2006, 2008) , "International Migration Outlook", OECD Publishing
Rapoport, H. & Docquier, F. (2006) The Economics of migrants’ remittances, In J. Mercier-Ythier et S.C. Kolm (eds), Handbook on the economics of giving, altruism and reciprocity, Handbook series edited by Kenneth Arrow and Michael Intriligator, Elsevier-North Holland, chapter 17.
28 ANNEX 1. Selection of post offices for the survey
To avoid bias measure, post offices have been eliminated from the field as these offices had different statistical behavior of the majority of other post offices. Whatever the reason, these specific offices, which transfers take place at different times than the majority, must be rejected.
Sources: Data Post, authors' calculations
Pa ris Clignancourt Marse ille 01
Pa ris Ga re du Nord
Tota l
29 We performed a PCA analysis to eliminate offices atypical
ANNEX 2. Choice of post offices for the survey
Sources: Data Post, authors' calculations
TOULOUSE CAPITOLE
NICE R P PARIS GARE DU NORD EVRY R P
MANTES LA JOLIE PRINCIPAL
LYON RP PARIS MARX DORMOY
CAYENNE R P MARSEILLE 01
LES MUREAUX PARIS SAINT LAURENT
ROUBAIX PRINCIPAL
CERGY SAINT CHRISTOPHE AUBERVILLIERS PRINCIPAL PARIS CLIGNANCOURT MARSEILLE CANEBIERE CLICHY PARIS LOUVRE MAMOUDZOU
CERGY GRAND CENTRE
AIX EN PROVENCE PRINCIPAL PARIS SAINT LAZARE PARIS 18 MONTMARTRE
PARIS PORTE DE LA CHAPELLE
ORLEANS PLACE DE GAULLE
MELUN RP MULHOUSE BOULEVARD DE LEUROPE
PARIS CHAMPS ELYSEES
NOISY LE GRAND ARCADES
BORDEAUX VICTOIRE ST ETIENNE GRAND' POSTE
POINTE A PITRE PRINCIPAL BOBIGNY RECETTE PRINCIPALE
ASNIERES PRINCIPAL
GENNEVILLIERS PRINCIPAL MONTE CARLO
PUTEAUX PRINCIPAL ARGENTEUIL CENTRE VILLE
EVRY HOTEL DE VILLE NANTES R P
SAINT QUENTIN EN YVELINES KOUROU
POISSY L OCTROI MARSEILLE RUE DE ROME
TRAPPES VILLENEUVE ST GEORGES PRINCIPAL
MONTREUIL PRINCIPAL
MASSY OPERA BP STRASBOURG PL GARE BP
PARIS GUY MOQUET CAYENNE CEPEROU
RENNES REPUBLIQUE BRON
VAULX EN VELIN PRINCIPAL CHOISY LE ROI
AVIGNON REPUBLIQUE COLOMBES ARAGON ANNECY R P
PARIS BROCHANT
PARIS VICTOR HUGO CREIL GAMBETTA
VITRY SUR SEINE PRINCIPAL
LYON GUILLOTIERE MONTPELLIER COMEDIE
AUBERVILLIERS MONTFORT PARIS ORGUES DE FLANDRE
CORBEIL ESSONNES PRINCIPAL
TOULON LIBERTE
SEVRAN BEAUDOTTES PARIS PHILIPPE DE GIRARD
LE MANS REPUBLIQUE RP MONTPELLIER RONDELET
TOURS RP EPINAY SUR SEINE PRINCIPAL
SAINT DENIS REPUBLIQUE
LES ULIS PANTIN PRINCIPAL PARIS BICHAT PARIS OURCQ PARIS MAGENTA COLOMBES LILLE RP DIJON GRANGIER ANNEMASSE PRINCIPAL ORLEANS UNIVERSITE LYON BEAUVISAGE VILLEURBANNE GRANDCLEMENT TOULOUSE BELLEFONTAINE NANTERRE PABLO PICASSO
TOULOUSE ROQUELAINE PERPIGNAN ARAGO RP EVREUX LA MADELEINE MAMOUDZOU KAWENI MEAUX PRINCIPAL LE PORT
PARIS PORTE D'ORLEANS Var1
Tot
(
)
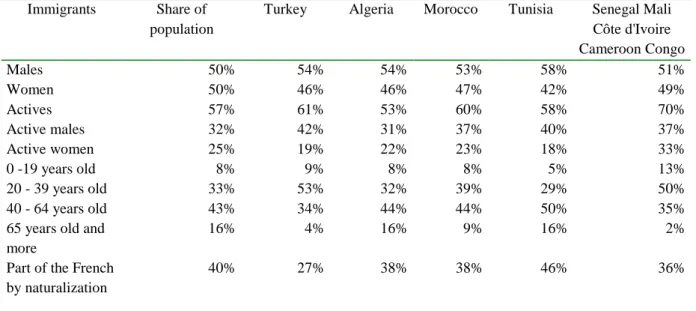
30 ANNEX 3 : Characteristics of immigrants in France in 2004-2006
Immigrants Share of
population
Turkey Algeria Morocco Tunisia Senegal Mali
Côte d'Ivoire Cameroon Congo Males 50% 54% 54% 53% 58% 51% Women 50% 46% 46% 47% 42% 49% Actives 57% 61% 53% 60% 58% 70% Active males 32% 42% 31% 37% 40% 37% Active women 25% 19% 22% 23% 18% 33% 0 -19 years old 8% 9% 8% 8% 5% 13% 20 - 39 years old 33% 53% 32% 39% 29% 50% 40 - 64 years old 43% 34% 44% 44% 50% 35%
65 years old and more
16% 4% 16% 9% 16% 2%
Part of the French by naturalization
40% 27% 38% 38% 46% 36%
Source: INSEE, Annual census surveys 2004 - 2006
ANNEX 4: MULTIPLE CORRESPONDENCE ANALYSIS
TABLE A4-1: EIGEN VALUE AND INERTIA
F1 F2 F3 F4 F5 Eigenvalue 0.126 0.093 0.075 0.067 0.063 Inertia (%) 12.573 9.301 7.533 6.673 6.251 Cumulative% 12.573 21.873 29.406 36.079 42.330 Inertia adjusted 0.007 0.002 0.001 0.000 0.000 Inertia adjusted (%) 32.445 11.385 4.494 2.278 1.464 Cumulative% 32.445 43.831 48.324 50.603 52.067 Classe
TABLE A4-2: RESULTS BY CLASSES
Classe 1 Classe 2 Classe 3 Classe 4
Number of observations 238 241 312 209
Intra-class variance 0.177 0.229 0.217 0.208
Minimum distance to the barycenter 0.240 0.127 0.201 0.075
Mean distance from centroid 0.410 0.459 0.447 0.435