1
Competition and Investment:
What do we know from the literature?
Jérôme Mathis
Wilfried Sand-Zantman
March 2014
Acknowledgements
We thank Orange for its intellectual and financial support, but emphasize that all the views expressed in this paper are the responsibility of the authors alone and do not reflect the positions of Orange or their representatives.
2
EXECUTIVE SUMMARY
The link between competition and investment is one of the most important relationships examined in economics. For more than two centuries economists have held conflicting views of which market structures create the most favorable environment for economic growth, while acknowledging that it benefits from investment in both infrastructure and innovation.
According to Adam Smith’s fundamental lessons, competition guarantees that consumers’ needs are best satisfied, minimizing the rents left to the firms. Economists of the Austrian school have criticized this view and instead emphasized that even more important than the competition structure is the competitive process. An even more skeptical view was offered by Schumpeter who argued that concentrated market structures are optimal and monopoly rents are a driving force that promotes economic growth.
A parallel can be drawn between innovation and investment which then gives rise to two conflicting effects of competition on investment. First, strong product market competition decreases profits and then lowers incentives to innovate. Second, competition may provide firms with incentives to innovate to escape from competition in the product market. This “escape competition” effect dominates when the ex-post market power is relatively high while the opposite holds when the market is more competitive. The two effects are embedded in the inverse U-shaped curve between competition and innovation developed by Aghion et al. (2005) so the optimal degree of competition is intermediate.
A look at the investment in infrastructure also offers a contrasted view on the benefits of competition. Alesina et al. (2005) studied the role that overall regulation, barriers to entry and public ownership play in investment for many nonmanufacturing industries (energy, transports, communication). They showed that competition-enhancing policies do promote investment. But studies more focused on the (fixed-line) telecommunications sector have highlighted a possible negative impact on network investment when market entry is promoted through local loop unbundling. Additionally, the impact of unbundling -- which can be seen as a competition-enhancing policy – on penetration rate is still under debate but seems to be at best negligible.
Therefore, the impact of competition on investment depends both on precise competition enhancing measures and the type of investment at stake.
3
Introduction
I)
The link between competition and investment is one of the most important relationships to examine in economics. For more than two centuries, economists have had a conflicting view of which market structures create the most favorable environment for economic growth, acknowledging that it benefits from investment in both infrastructure and innovation. In particular, the question of whether the presence of large firms capable of extensive investment should be promoted or discouraged to protect small firms and preserve the competitive process, has been a central point of assessment.
The problem is multi-dimensional but one should consider first and foremost what creates the optimal market structure. The answer may depend on the goal one pursues, such as protecting jobs, increasing consumer’s welfare, or increasing domestic firms’ profit. Assuming that there is consensual welfare function which the central planner can maximize, would not totally simplify the problem. Indeed, for a given technology, there is a presumption that un-concentrated market structure is optimal, since this may encourage greater competition and deter collusion between firms. However, increasing returns to scale or the need to provide incentives for investment over the long-term may dissent from the initial belief.
Part of the problem depends on people’s beliefs relating to the merits of competition for creating the right conditions to foster productive activities. A first theory, put forth by Adam Smith, praises the virtues of competition as a way to ensure both allocative efficiency and productive efficiency. Competition guarantees, more than other market structures, where the consumers’ needs are best satisfied and minimizes the rents left to the firms, providing consumers with the entire surplus created by trade. According to this first approach, the State (or the competition authorities when they exist) should both help small firms to survive and prevent the development of dominant firms, in order to promote the greatest number of firms on the market. This vision was developed at the school of Harvard and is known as the S.C.P. (structure-conduct-performance) paradigm (see Bain (1956)). It supports the presence of competitive markets and favors public intervention to keep the structure competitive.
A critical view of competitive structure can be found in the ideas developed by the economists of the Austrian school. Following Hayek, these economists claim that the competitive process
4
is the most important aspect of competition. It means that the number of firms per se is irrelevant, only the possibility for a new and more efficient firm to succeed matters. According to this approach, the presence of large firms is not the sign of ill-functioning markets. It can originate from the fact that those large firms are more efficient than others, and therefore more successful. It can also be the consequence of cost structure displaying increasing returns.
An even more skeptical view on competition is offered by Schumpeter. According to the author (see Schumpeter (1939), there are many situations where concentrated market structures – in particular the monopolistic structure - are optimal. There are two main reasons for this. First, as developed above, the presence of scale economies may lead to markets with a small number of firms. Second, and more importantly, the objective of obtaining a future monopoly position provides firms with strong incentives to improve their production process. This dynamic motive is at the core of the Schumpeterian argument. As firms expect to be monopolists in the future, they will invest/innovate today, for their own benefit which in turns benefits to the society. Monopoly rents – hence monopolistic structures – promote economic growth.
From these various traditions and from the studies that have been done since, one can look at this issue from different perspectives. The most natural one amounts simply to search for the market structure most likely to foster investment. In spite of this apparent simplicity, this assumes that investment can easily be defined, and that all types of investment can be compared. This also assumes that the market structure is not affected by investment, while it will be necessary to distinguish between ante market structure (before investment) and ex-post market structure (after the investment). One of our goals will then be to discuss how investment is affected by both present and future market structures. This question will be linked to the nature of the investment.
How market structure impacts investment has also to be tackled with respect to financial constraints. One of the Schumpeter arguments in defense of monopoly was that investment requires cash-in-advance spending and that only monopoly had access to large financial reserve. A counter argument would be to claim that, if the product market is profitable, any firm could go on the financial market and borrow the necessary amount. In fact, it is here necessary to specify both the potential financial imperfections and the impact of the market
5
structure on these imperfections. If a less concentrated market structure increases financial imperfection, a monopoly may be the firm the most able to invest.
An additional perspective concerns the impact of regulation on the investment decision. The government may determine the numbers of firms on the market (for instance, by awarding licenses), but it may also affect many elements that matter in the investment decisions of the firms. For instance, by setting the rule of access for the infrastructure, the regulatory authorities have an impact on the returns firms can expect from investment. More globally, regulation affects the economic, legal and therefore financial environment. Public decisions are therefore keys in understanding investment, market structure, and the link between these two elements.
To examine those various questions, we will present some literature on the link between investment and competition. This literature is quite restricted when taken in a strict sense, but rather large when investment includes innovating investment. This is the view that we will take in the report.
In the first part, we will discuss the link between market structure and investment in innovation. Whereas innovation is only a limited part of investment, it is a useful setting to discuss the impact of competition. Indeed, as long as one abstract from property rights, there is no real difference between investment in innovation and the other types of investment. We will therefore consider this literature first by taking a pure theoretical point of view and looking at the comparative incentive to invest for firms in various market structures. Then we thoroughly discuss the famous inverse U-shaped curve approach developed by Aghion et al. (2005) mixing theoretical and empirical arguments. One major lessons of this study is that the investment incentives are driven by the comparison between ex-ante and ex-post rents, and empirically that competition should exist but should not be too strong.
The second part of the report will focus on the investment in infrastructure. Using a more macro-founded framework, we will follow Alesina et al. (2005) and discuss the impact of various form of deregulation that promotes competition on the incentives to invest in capital. This theoretical study will be complemented with the empirical study of Alesina et al. that shows that competition enhancing policies promote investment. In the specific context of telecommunications, evidence from the papers of Grajek and Roller (2012), Nardotto et al. (2013), and Crandall et al. (2013) suggest that when competition enhancing policies take the particular form of regulated new entrants’ access to the incumbent fixed-line infrastructure at
6
the wholesale level the network investment may decrease. Such a decrease could be desirable if it obviates the need for potentially inefficient investments in duplicative infrastructures. But evidence from Nardotto et al. (2013) and Crandall et al. (2013) suggest that this network investment shift reduces the broadband penetration which is interpreted as a loss in term of consumers’ welfare. 1To sum up, two major points should be kept from the analysis. First, from a theoretical point of view, competition can be beneficial or detrimental for investment as the decision to invest depends on the incentives to modify the market structure. The incentives to invest are high if competition takes place at the pre-investment stage, while they are low if competition takes place at the post-investment stage. Second, at a rather aggregate level, the empirical analysis tends to promote the idea that competition is good for investment. But evidence from the telecommunications sector when competition is encouraged by ensuring new entrants’ access to the incumbent infrastructure, offer a much more contrasted view with a potential negative impact of competition on investment.
Competition and Investment in Innovation
II)
In the first part of this report, we discuss the link between the degree of competition on a market and the choice of innovating. This question is raised at a micro-level by focusing on the firm’s incentives.
1. Replacement effect vs. Efficiency effect
The way this question has been raised in the early literature amounts to compare the incentives of firms in various competitive contexts, mostly contrasting a monopoly situation and a duopoly situation. Two opposing views have been presented on this debate. First, Arrow (1962) showed that a monopoly is less likely to invest than a duopoly. Then, in a context of race for innovation, Gilbert and Newbery (1982) showed instead that monopolies were more likely to invest than their potential competitors. To understand this apparent contradiction, we present now the two contributions
a. Arrow Replacement Effect
1
7
Arrow focuses on the pure gains from innovating assuming that this innovation gives an exclusive right of unlimited duration. In this specific context, there is no formal difference between an innovation and an investment who grants the firm an ex-post monopoly position. Moreover, Arrow models innovation as a cost-reducing method, which is very close to many forms of investment that decrease the cost of providing a good. Formally, in a model where firms produce at constant marginal cost, the innovation allows to decrease the marginal cost of production from cH to cL (with cH >cL >0). Arrow compares three situations.
First, suppose that the decision to invest in this cost-reducing technique is chosen by a central planner whose goal is to maximize social surplus. If such a planner was in place, he would set the price at marginal cost, i.e. cH before innovation and cL after the innovation. The gains from the innovation are equal to the increase in demand induced by the fall in price. They can be computed as the additional demand when price falls from cH to cL. In this first benchmark case, investment will take place if the investment cost is smaller than the benefit of this increase in demand.
The second situation is one where the market is run by a monopolist and the decision to invest is taken by this monopolist to maximize its own profit. In contrast with a hypothetical social planner, the monopolist will set the price above marginal cost. When the marginal cost decreases following investment, the monopolist will set a lower price but his gains will only be a share of the welfare gains as some of these gains are going to consumers. In contrast with a benevolent social planner, the monopoly only considers its own gain in the decision to invest. Therefore the monopolist’s incentives to invest will be smaller than the social incentives to do so.
The most important situation, and the one to compare the monopoly case with, is when we assume that we start from a competitive situation. More precisely, we consider a market where a large number of firms produce a homogenous good. Prior to innovating, these firms compete in price so the equilibrium price is cH and there is no residual profit. By investing, a firm can get a monopoly position on the technology (but not on the good itself).2
Two different cases must be considered. Suppose first that the monopoly price with the new cost, cL, is below the initial price, cH. It is then as if, by investing, the firm had escaped any form of competition. This case is called drastic or major innovation. Suppose instead that the monopoly price with the new cost, cL, is above the initial price, cH. This means that, in spite of
2
8
his competitive advantage, the firm cannot freely choose its pricing policy and therefore will set his price at cH. From the innovating firm’s point of view, the situation is better than initially as he earns a mark-up for each sale but he does not totally escape from competition. This case is referred to as non-drastic or minor innovation.
In the case of drastic innovation, the incentives of the competitive firm are greater than the incentives of the monopoly as the profit post-innovation is the same while the profit pre-innovation is smaller in the competitive case. Therefore, the differential profit (hence the incentives to innovate) is greater in the competitive case than in the monopoly case. In the case of non-drastic innovation, the result is the same. Indeed, the difference in prices (and in demand) in the ex-ante monopoly case will be small whereas in the ex-ante competitive case, the final profit will fully reflect the cost differential while the pre-innovation profit is still zero.
Arrow’s main point is the fact that the monopoly has less to gain in improving his position because he replaced himself when innovating. The replacement effect explains the smaller incentives of the monopoly – who rests on his “laurels” - compared to firms in a competitive situation3.
b. The Efficiency Effect
In the preceding approach, it was assumed that either the monopoly or the competing firms could acquire the innovation (or makes the investment). We suppose now that that the innovation can be performed by both firms. More precisely, we follow here Gilbert and Newberry (1982) and consider an initial situation with an incumbent and a potential entrant. They assume that either an incumbent firm or an entrant can invest to get a new technology. This investment can either be either direct - each firm performing some R&D which yields to race for innovating - or indirect - an innovation has been discovered by a third firm and an auction is set up to allocate this innovation.
When choosing how much resource to devote to the investment, each firm considers not only the gains in case of success but also the loss in case of failure. In such a context, the failure by one firm is equivalent to the success of its competitor. This situation is akin to one where both
3 Note that, in the case of drastic innovation, the innovation of a firm initially in a competition situation has an
9
the incumbent and the entrant devote some money to increase the speed at which they can secure a position on a market. For the incumbent, a success is equivalent to keeping the initial monopoly position with a more efficient technology. For the potential entrant, success allows to enter the market with a technological advantage on the incumbent (the former monopoly), with a new market structure characterized by an asymmetric duopoly. Looking at the differential profits, the gains from innovation by the entrant are simply the profit of the efficient firm in a duopoly with differentiated cost, denoted as ПD(cL). As for the monopoly, its gains are the difference between the efficient monopoly profit, ПM(cL), and the profits of an inefficient duopolist, ПD
(cH).
To compare the monopoly’s and the entrant’s incentives to invest, one must simply compare two expressions, ПD(cL) and ПM(cL) - ПD(cH). It turns out that the latter expression is always greater than the former. Indeed, the above comparison amounts to say that the monopoly is willing to invest more than the entrant if and only if ПM(cL)>ПD(cL)+ ПD(cH). This condition states that the profits of an efficient monopolist are higher than the profit of two duopolists choosing their strategy in an uncoordinated way. It is a very natural property, called the
efficiency effect, which must be verified in any competitive model (see Tirole (1988)).
Therefore, in a pure race for innovation, the monopolist’s incentives to keep his monopoly position are greater than the incentives an entrant has to become a duopolist.4
From these two major contributions, it is difficult to draw clear-cut conclusions on the link between market structure and incentives to invest. On one side, there is the classical argument that competition fosters innovation and investment because this market structure gives the highest incentives to escape competition. On the other side, we find the Schumpeterian idea that the presence of ex-post rents is crucial to incentivize firms and, in this respect, monopoly rents maximize the incentives to innovate.
Elaborating on these ideas, if the investment is very productive, i.e. very likely to generate a genuine new product (as in the drastic case), the efficiency effect is low as the efficient duopoly profit is close to the monopoly profit. One can therefore believe that the entrant will invest a lot. On the contrary, when the innovation is non-drastic, the monopoly is more likely
4 Vickers (1985) notes that this may not be true when more than one firm is initially operating on the market. In
the case of initially Cournot competition, an entrant has more to gain from a non-radical innovation than one of the incumbent firms.
10
to invest than the entrant as the future gains of this latter firm may not be enough to justify the cost to be incurred.5
Even if it seems natural to compare pre-investment market structures and profit with post-investment market structures and profit, many innovations or post-investment do not fundamentally change the degree of competition. It is therefore useful first to find a model flexible enough to study the innovation incentives and second to be able to look at real data and settle the debate as much as possible. To this end, we will turn to more data oriented research, discussing in particular the contribution by Aghion et al. (2005).
2. The Inverse U-Shape curve of innovation.
a. Presentation of the earlier empirical literature
As the theory seems inconclusive, many economists have tried to perform empirical studies to unveil the possible relationship between innovation and competition (see Gilbert (1986) for a comprehensive view). As a preliminary remark, one must observe that this relationship can be looked at from different perspective. For example, one can look at the link between R&D and on market concentration, even if it represents a highly imperfect measure of competition. Other studies focus on the relationship between R&D and firm size.
The early articles, as Scherer (1965, 1967) or Mansfield et al. (1977) showed some tendency for R&D activity to be larger in moderately concentrated industries. Note that these studies were inspired by the SCP paradigm discussed in the introduction of this report and therefore quite favorable ex-ante to competitive structures.
A second wave of studies, mostly in the 1980, improved the econometric methods and tried to control for effects specific to firms and industries. Scott (1984) showed that neither firm size nor market concentration was correlated with R&D intensity. Even if some researchers found slightly more significant results, the quest for positive or negative relationships between competition and R&D investment was largely unsuccessful. According to Baldwin and Scott (1987) “The most common feature of the few R&D analyses that have sought to control for
5 An interpretation in terms of investment would be that competition is good to generate new goods while
11
the underlying technological environment is a dramatic reduction in the observed impact of the Schumpeterian size and market power variable”.6
More recently, a third wave of article took advantage of more extensive data and better methods to control for the simultaneity of market structure and R&D. For example Blundell, Griffith and Van Reenen (1999) found that more concentrated industries produce fewer innovations, but larger firms (within industries) were responsible for more innovations. Nickell (1996) showed that an increase in market share was associated with reduced productivity (at firm-level) while greater competition (measured by the number of competitors) was linked to higher productivity growth.
The use of natural experiments – the occurrence of an external event that causes changes in the industry - may be an interesting way to investigate the link between innovation and market structure. As an illustration, Carlin, Shaffer, and Seabright (2004) looked at the impact on performance and innovation of the privatization of State-owned firms in transition countries. Their results suggested that the presence of new rivals fostered innovation while the presence of too many competitors was detrimental to innovative activities. Although interesting, it is difficult to draw general lessons from these results as only some firms were privatized and this may lead to strong endogeneity biases. Moreover, management practices under public and private ownership sharply differ and may also be a source of difference in the outcome. MacDonald (1994) made also use of an exogenous policy event – a change in the US import policies - to assess the role of competition on the development of innovative products. His results suggest that a sudden increase in competition had significant positive impacts on technological progress for highly concentrated markets. Unfortunately, it is again hard to dismiss the endogeneity problems as imports respond to some factors that are endogenous to innovation.
As it appears from the above studies, it has been very difficult to find a clear linear relationship between competition (taken with different forms) and innovation. Moreover, these empirical works also failed to delivered theoretical models in line with their results. The article by Aghion et al (2005) tries both to provide a global inquiry – with theoretical and empirical results – and to go beyond the usual linear relationship.
6 Even if competition policy could reasonably be adjusted to the technological environment, the quest for
correlation or causality between competition and innovation in unregulated environment should abstract from this element.
12
b. The Model by Aghion et al. (2005)
The model by Aghion et al. (2005) is grounded into the Schumpeterian tradition revitalized by the endogenous growth literature (Romer (1990), Aghion-Howitt (1992) and Grossman-Helpman (1991)). This literature links higher product market competition to lower post-entry rents and lower incentives to innovate. But on top of this well-known idea, the model adds the escape-competition effect whereby a firm in a competitive market wants to innovate to differentiate from its competitors.7 The combination of those two effects will lead to the inverse U-shape curve.
To obtain this curve, the authors model a situation where two firms operate on a market.8 The firms are characterized by their production functions which depend on the technological level. The authors consider two possible technological situations. In the first one, both firms are at technological par with one another. There is no leader or follower and this situation is referred to as leveled or neck-and-neck. In the second situation, called unleveled, one firm (the leader) lies ahead of its competitor (the follower). The technological situation is not set once for all. Indeed, at each period, firms can devote some resource to innovation, and may thereby increase their productivity. A first important assumption of the model is that the gap between the two firms never exceeds one technological level. Therefore, if a leading firm innovates, the follower will automatically get access to the (now) old technology of the leader.
One of the common difficulties of the articles that study the relationship between competition and innovation is to choose how to model competition. As the number of firms is fixed in Aghion et al. (2005), the degree of competition in an industry is not measured by a standard Herfindahl–Hirschman index (HHI). It is modeled instead by the actual behavior of the firms, and their ability to maintain high prices. More precisely, consider first the situation where there is a technological leader. In this case, competition is soft but only the leader can make some profit. The most interesting case lies when the industry is leveled. Then, the degree of product market competition is inversely related to the degree to which the two firms are able to collude. If there is no collusion (or more generally any limit to competition, such as informational problems or switching costs), then Bertrand competition with identical products
7 Notice that the escape-competition effect is reduced if the firm anticipates that regulatory authorities will
promote competition in the new firm’s environment. This commitment problem associated to authorities’ future behavior is not specific to the situation investigated in this report but may exist as soon as the relationships are repeated.
8 In the model, there are in fact many goods each using two intermediate goods produced in a duopoly industry.
13
drives the industry profit to zero. On the contrary, if the collusion is perfect, the firms will share equally the monopoly profit. The competition is therefore parameterized by the fraction of a hypothetical leader’s profit that a level firm can reach through collusion.
This model allows combining the Schumpeterian Effect – more competition meaning less rent and thus less incentives to innovate – and the “Escape Competition” Effect – more competition decreases the current profit and increases the incentive to innovate to gain a technological advantage.
More precisely, consider an initial situation where competition is soft, meaning that collusion is high on the market. When the firms have the same technology (the neck-and-neck situation), the marginal gain from innovation is small and the pace of investment is quite limited. If competition were increased, the pre-innovation rents would decrease, increasing the incentives to innovate and as a consequence the resource devoted to this. If the firms have different technologies, the follower has more incentive to innovate in this situation than in the case where tough competition prevails.
Consider instead the case where there is no collusion in the product market, i.e. the case of tough competition. When the firms have the same technology, the current profits on the market are small (equal to zero if there is no collusion at all) so the incentives to innovate to escape competition are high. In contrast, if the situation is unleveled with one leader and one follower, the latter firm has no incentives to spend some money for innovation as the returns will be low.
Let us summarize the main patterns of this theoretical model. Increasing competition can foster innovation where firms are neck-and-neck, i.e. when the production function is the same across firms. But when firms are technologically heterogeneous, it is better to decrease competition in order to foster innovation from the laggard firm.
c. The empirical U-shaped curve.
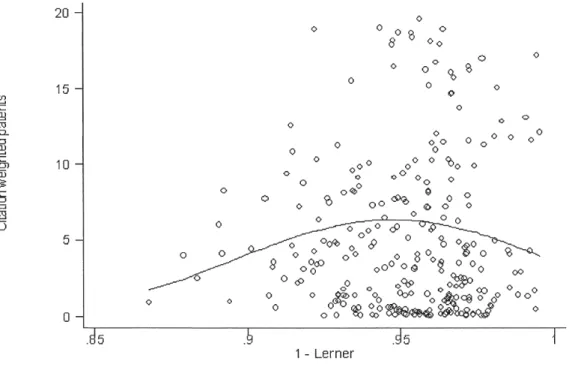
Aghion et al. (2005) tries next to assess the empirical relevance of their theory. They use a panel of more than 300 British firms over the period 1973-1994. Two important elements of the theoretical model, the measure of innovation and the degree of competition, should be carefully designed for the empirical test. First, to measure innovation intensity, the authors use the average number of patents taken out by firms in an industry and each patent is
14
weighted by the number of times it has been cited by another patent. Even if this measure does not give a precise information on the innovative input (both human and financial), it seems a good surrogate index. Second, it is important to clarify the nature of product market competition. In many articles, competition is measured by indicators such as market share and concentration index (as the HHI). To be in line with their theoretical model, Aghion et al. (2005) measures the degree of competition using a Lerner type of index. To construct the index, they compute the ratio between operational profits net of financial cost9 divided by sales and then take the average of this index across firms in the industry. Using 1-Lerner as the precise measure of competition, a value of 1 indicates perfect competition while values below 1 indicate some market power. Allowing for a non-linear specification of the relationship between innovation (the Y-axis) and competition (the X-axis), leads to Figure 1.
Figure 1: The figure plots a measure of competition one the x-axis against citation-weighted patents on the y-axis. Each point represents an industry-year.
Source: Aghion et al. (2005).
9
15
In spite of the usual dispersion, one can see (and check more formally from the estimations) that the relation between competition and innovation is first increasing and then decreasing. One use to say that the relation is an inverse U-shape.
In the competition/innovation debate, the possible endogeneity is a recurrent issue. Indeed, one could argue that innovation allows a decrease in competition so that the negative relationship (if any) should not be interpreted as a causal one in the usual sense. Aghion et al. (2005) used exogenous change in the intensity of competition (privatizations, EU single market programs, Monopoly and Merger Commission investigations that influenced the market) and show that competition/innovation curve still displayed the same inverse U-shaped pattern.
The data also give an interesting prediction on the technological spread in an industry. Indeed, it appears that the average technology gap between leaders and followers is an increasing function of the overall level of competition. To explain this fact, one can use again the insights from the theoretical model. A high degree of competition means that the profit will be low if both firms have the same level of technology. It implies that investment will be high in this case (the escape-competition effect). At the opposite, when the industry is unleveled, the follower is discouraged to invest because the returns will be low. A high degree of competition goes therefore hand-in-hand with a large technological gap within the industry.
This part has focused on innovation investment. The link between investment and the amount of innovation is not straightforward because innovation is subject to a random process. Another major form of investment, namely infrastructure investment, offers the possibility to discuss the link between investment and several forms of regulation or deregulation that each promotes competition.
Competition and infrastructure investment
III)
Infrastructure investment determines the level of firms’ physical capital. A particular company’s choice of infrastructure level depends on the structure of the market it belongs to. A monopoly accumulates physical capital to an extent that may differ from the one that would have been chosen by a firm that only covers a small part of a highly competitive market.
16
Regulatory authorities (the government for short) can influence competition and therefore the level of infrastructure investment in several ways. For instance, the regulator can erect barriers to entry by determining administratively the number of firms through a grant of licenses. It can also establish a system of standards, administrative procedures, red tape and other forms of regulatory burdens that increase firms’ input costs and/or firms’ costs of adjusting the capital stock. Such a regulation can in addition hamper firms’ capacity to react to changes in fundamentals. The regulator can also impose a ceiling on the rate of return on capital by setting an upper bound on the ratio profit/capital that firms are allowed to earn. Government intervention can be even more intense when it owns all or part of the company's capital. In all these examples the implemented regulation reduces competition. There is also some specific regulation that promotes competition as for instance when the new entrants are provided access to incumbent infrastructure.
Over the past two decades many OECD countries experienced governmental measures (mostly deregulation) in industries that require heavy infrastructure investments, as for the sector of aerospace, railways, postal, telecommunications, electricity, and gas. A natural question is: what is the effect of such measures on infrastructure investment?
One can expect that deregulation (respectively, regulation) does not produce the same effect whenever it consists in suppressing barriers to entry, reducing the cost of capital adjustment, removing the ceiling on the rate of return that can be earned on capital, or reducing the State shareholding in the company (respectively, providing new entrants with access to incumbents’ infrastructure).
In what follows, we first present a theoretical analysis of the effect of deregulation on infrastructure investment depending on what deregulation consists in through the papers of Alesina et al. (2005). Second, we present an empirical treatment of this issue. We start with the paper of Alesina et al. (2005) that studies data from 1975 to 1998 for several nonmanufacturing industries in 21 OECD countries. Then we focus on three empirical studies in the telecommunication sector. Grajek and Roller (2012) examines the effect of access regulation on infrastructure investment in 20 European countries from 1997 to 2006. Nardotto et al. (2013) explores the impact of local loop unbundling on both broadband penetration and the quality of service by using data from 2005 to 2009 in UK. Crandall et al. (2013) examines the effects of copper-loop unbundling on household broadband penetration rate in OECD countries from 2001 to 2010.
17
1. Theoretical analysis
The article by Alesina et al. (2005) offers a model in the spirit of endogenous growth literature. In their approach, there are several monopolistic competitive firms10, each producing a differentiated product by choosing capital and labor to maximize present discounted value of future profits. This model assumes that the elasticity of demand increases with the number of firms. The underlying idea is that a higher number of producers extends the range of products available to consumers. This variety increases the elasticity of substitution between products - the consumer has access to more substitutes - and thus the elasticity of demand that each firm faces increases. It is also assumed that tougher regulation increases the cost of capital adjustment. This seems natural when the regulation takes the form of standards that the company’s capital must satisfy. Finally, it is assumed that marginal productivity of capital is decreasing. This implies that as an additional unit of capital is added to a fixed labor supply, the gain in output is positive but less than the extra output generated by the addition of the previous unit of capital.
In this context, the authors study how infrastructure is impacted by different types of deregulation.
a. Reducing barriers to entry and/or the cost of capital adjustment
Regulatory reforms that result in reduction in (administrative) barriers to entry tend to stimulate capital accumulation and then infrastructure investment. Indeed, lowering barriers to entry increases the number of firms. The initial capital of a new entrant reproduces somehow a capital already used by incumbents. In addition, capital accumulation by entrants more than offsets the potential decline of incumbents’ capital as the marginal productivity of capital is assumed to be decreasing. Thus, at the aggregate level, both the capital stock and the level of infrastructure investment increase.
A lower cost of capital adjustment produces the same effects on the capital stock and the level of infrastructure investment. Because any reduction of the adjustment cost decreases firms’ cost of investment so the firms choose, in fine, a higher level of investment.
10 Monopolistic competition is a particular form of imperfect competition that limits the strategic interaction
between the firms. It applies well to the cases where products are differentiated and the cost structure exhibits important fixed costs.
18
b. Capital market imperfections
We just concluded that a deregulation opening markets to competition stimulates investment. This might be surprising because we could have imagined that tougher competition - by reducing profits - would rather compel firms’ ability to invest and thus have a negative effect on investment. But this is not the case in the absence of capital market imperfections. Provided it is sufficiently profitable, any project can be financed through external funds. Firm’s ability to invest is then no hampered by current low markups of prices over marginal costs. However, in a context of capital market imperfections the cost of external source of finance (the interest rate of the loan) cannot exceed the cost of internal source of finance (the opportunity cost of equity financing). This difference between the costs of external and internal sources of finance originates from information asymmetries. Having no access to the information privately observed by the party who implements the project, the investors ask for a risk premium. From the firm’s point of view, this risk premium adds to the opportunity cost of internal financing. Thus, a reduction in barriers to entry that increases the elasticity of demand and generates a reduction of the profits, decreases the internal sources of financing which, in a context of market imperfections, increases the cost of capital and undermines the infrastructure investment.
Note that the smaller and younger the firm, the stronger the imperfect substitutability between internal and external sources of finance. Indeed, a large firm has more collateralizable assets which reduce the risk premium. Further, a large firm is less severely affected by informational asymmetries because its activity is subject to greater media coverage and financial analysts monitoring. Accordingly, the interest rates paid on a loan by a large company tend to be close to its cost of internal financing. Hence, even if higher competition reduces the actual markup of prices over cost it does not impede future investment for the large firms.
c. Ceiling on the rate of return on capital
A deregulation that consists in relaxing the constraint on the rate of return on capital reduces investment. The idea is that if such a constraint binds, the choice of factor proportion may be altered in favor of more capital intensive techniques relative to labor intensive ones in order to increase the profit that the firm is allowed to earn up to an extent that lets the ratio profit/capital unchanged. Said differently, by investing in additional capital the firm may
19
increase the base to which the ceiling on the rate of return is applied, resulting in a greater total remuneration for capital. There is then an excessive amount of investment. This well-known argument is due originally to Averch and Johnson (1962). So reducing the rate of return on capital below the profit maximizing level (resulting from the imposition of a binding ceiling) leads to an increase in the capital stock. The higher the allowed rate of return, the smaller the capital stock employed by the firm. Removing the binding constraint would, instead, reduce the desired capital stock and therefore would reduce the investment.
d. Privatization of public enterprises
Product market regulatory reforms that took place in the last decades have often been accompanied by privatization. A deregulation that changes the ownership structure of the firm can affect investment in an ambiguous way.
On the one side, public enterprises may have stronger incentives (and ability) to foreclose entry to competitors than private enterprises.11 A disappearing or reduced importance of a dominant stated-owned player, when facing a soft budget constraint may lead to a decrease in entry barriers for new privately owned firms.
On the other side, public enterprises may have stronger incentives to invest than private firms because of a political mandate imposed on them. For instance, as part of the conduct of a Keynesian policy, the government may ask public companies to invest in major works to reduce unemployment. Public firms may also be heavy investors because of their managers' incentives. Those managers often behave as empire builders, because their reward in terms of power, monetary compensation, and perks may be related to the size of the organization. They alternatively may set prices below the profit maximizing to strengthen political support.12 Therefore, one may have overexpansion and overinvestment in public enterprises so that reducing the public shareholding in these companies depresses the total investment.
Overall, from a theoretical perspective, whether total investment increases after a policy change that implies both privatization and a lowering the administrative barriers to entry is not clear. In order to disentangle the multifaceted effects of privatization, Alesina et al. (2005)
11 See Sappington and Sidak (2003). 12
20
offers an empirical study that allows to measure whether the increase of private investment more than compensates the possible fall of investment in privatized enterprises.
2. Empirical analysis
In what follows, we present four papers that provide an empirical treatment of the effect of higher competition through entry barriers reduction, privatization on infrastructure investment, and entrant’s access to incumbent’s infrastructure. First, we start with the paper of Alesina et al. (2005) that covers the period 1975-1998 for several nonmanufacturing industries in 21 OECD countries. Second, we focus on the paper of Grajek and Roller (2012) that covers the period 1997-2006 in the telecommunication sector in 20 European countries. Two important indicators of a telecommunications market’s degree of development are the broadband penetration (measured as the ratio of the number of actual subscribers to the number of potential subscribers) and the quality of internet service (measured by the download speed of the connection). We then present the paper of Nardotto et al. (2013) that examines the impact of local loop unbundling on both broadband penetration and the quality of service by using data from 2005 to 2009 in UK where unbundling took place in traditional telephony network but not in cable. Finally, we discuss the work of Crandall et al. (2013) that examines the effects of copper-loop unbundling on household broadband penetration rate in OECD countries from 2001 to 2010.
a. The global effect of entry barriers reduction and privatization on infrastructure investment.
In their empirical assessment of the effects of product market regulation, Alesina et al. (2005) use time varying measures of regulation for several nonmanufacturing industries in OECD countries for which investment, capital, and value-added data are available.
In order to capture the intensity of regulation, Alesina et al. (2005) uses data collected by Nicoletti et al. (2001), who extended the cross-sectional data contained in the OECD
International Regulation Database. This is described in detail by Nicoletti and Scarpetta
(2003). These data are used to construct time-series indicators of overall regulation, barriers to entry and public ownership from 1975 to 1998 in 21 OECD countries for seven nonmanufacturing industries: electricity and gas supply, road freight, air passenger transport, rail transport, post and telecommunications (fixed and mobile).
21
i. Reducing entry barriers
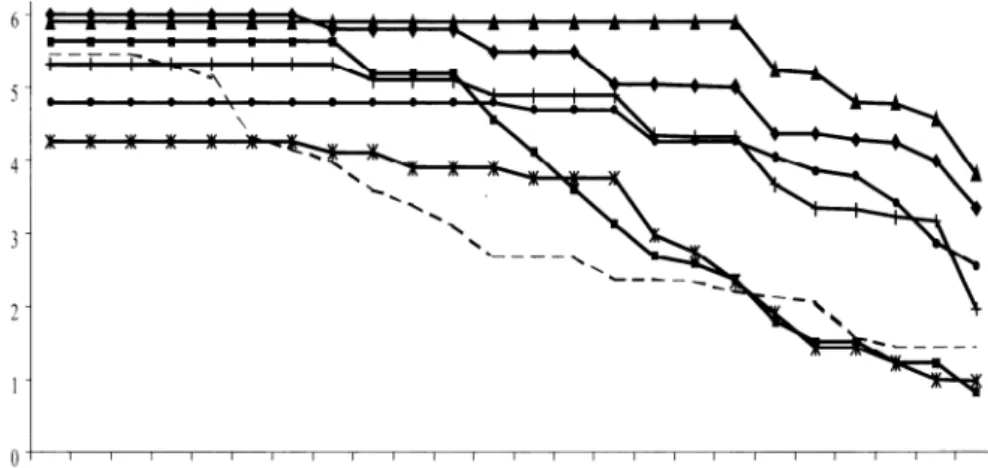
Barriers to entry cover legal limitations on the number of companies in potentially competitive markets and rules on vertical integration of network industries. Alesina et al. (2005) constructs an index which measures the barriers to entry (comprising legal restrictions and vertical integration), called BEVI, that takes a value of 0 when entry is free (i.e., a situation with three or more competitors and with complete ownership separation between natural monopoly and competitive segments of the industry) and a value of 6 when entry is severely restricted (i.e., situations with legal monopoly and full vertical integration in network industries or restrictive licensing in other industries). Intermediate values represent partial liberalization of entry (e.g., legal duopoly, mere accounting separation of natural monopoly and competitive segments).
Figure 2 plots the average across all seven nonmanufacturing industries of the index BEVI for the following representative countries: the United States, the United Kingdom, New Zealand, Germany, France, Spain, and Italy. While the first three countries reduced entry barriers starting from the late 1970s/early 1980s, in Italy and Spain the process did not begin till the 1990s, and in France and Germany the changes that occurred during the 1980s were minor.
Figure 2. Entry barriers in selected countries, 1975-1998. Notes: Countries: Germany (DEU), Spain (ESP), France (FRA), United Kingdom (UK), Italy (ITA), United States (USA), and New Zealand (NZL).
22
Using a systematic econometric investigation, the authors find that their results are consistent with the theoretical result that a reduction in barriers to entry is likely to have a positive effect on investment. The reason is that a reduction in barriers to entry leads to a decrease of the markup and, possibly, of the cost associated with capital expansion. The penalty of expanding production, in terms of lost monopoly profits, is then lower. This results in greater investment.
ii. Privatization of public enterprises
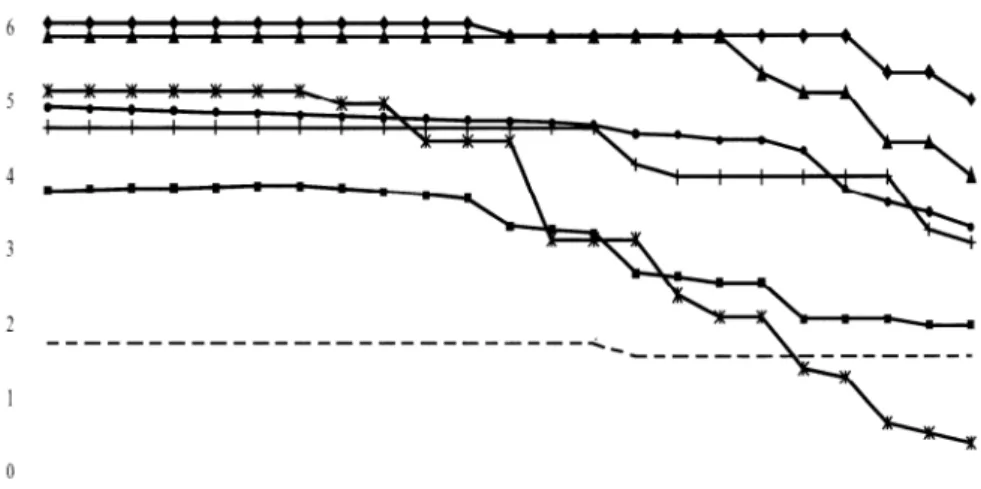
Alesina et al. (2005) constructs a second index, which measures the extent of public ownership, called REGPO, for the same representative countries of the index BEVI.
Figure 3 plots the average across all seven nonmanufacturing industries of the index REGPO. This index points to a generalized trend toward privatization. Over the considered period (1975-1998), the process has been rather timid in Italy and France and much more decisive in New Zealand and the United Kingdom. United States is the only country that does not show a tendency to reduce public enterprises. However, the United States had the smallest beginning of period level of public ownership, much below the level of continental Europe.
Figure 3. Public ownership in selected countries, 1975-1998. Notes: Countries: Germany (DEU), Spain (ESP), France (FRA), United Kingdom (UK), Italy (ITA), United States (USA), and New Zealand (NZL).
Index of public ownership measured by the indicator REGPO. Source: Alesina et al. (2005).
According to the theory developed in the previous section, when it comes to public ownership, contrasting forces are at work. While a reduction in public ownership can be seen
23
as lowering the shadow cost of entry, agency problems and political mandates affecting the behavior of public managers may lead to over-accumulation of capital. The empirical analysis conducted by the authors suggests that the reduction in the shadow cost of entry is the dominant factor.
b. The effect of access regulation on infrastructure investment in the telecommunication.
The article of Grajek and Roller (2012) analyzes the relationship between access regulation and infrastructure investment in the telecommunication sector using data covering more than 70 fixed-line telecom operators in 20 EU member states European countries from 1997 to 2006.13
i. Access to incumbents’ infrastructure: short term vs. long term efficiency
Providing entrants with an access to incumbents’ infrastructure introduces competition that in turn reduces the market power of incumbents and leads to lower prices and higher surplus for customers. The efficiency is then enhanced in the short term. However, by reducing the markups of prices over marginal costs the access regulation may reduce post-investment rents which may hamper investments in telecommunications. This would have a detrimental impact on long term efficiency. Regulatory practices depend on what the policy makers consider to be the right balance between short term and long term efficiency. For instance unbundling - which consists of ensuring new entrants’ access to the incumbent fixed-line infrastructure at the wholesale level - has been the leading regulatory solution both in Europe and the U.S. in the late 1990’s but is now phased out in the U.S. while still dominant in Europe.14
ii. Competition: facilities-based vs. service-based
Parts of the infrastructure of telecommunications industries have natural monopoly properties that can severely hamper the potential efficiency gains from competition. For instance, the duplication of the copper wires constituting the local loops (which connect individual
13
The following countries (EU 15) are in their dataset: Austria, Belgium, Denmark, France, Germany, Greece, Ireland, Italy, Portugal, Sweden, and the United Kingdom. The dataset also includes the following EU 12 countries (new member states after the 2004 and 2007 accession): Bulgaria, Estonia, Hungary, Latvia, Lithuania, Malta, Poland, Romania, and Slovenia.
14
While unbundling requirements were mandated in US by the Telecommunications Act of 1996, these were first eliminated from the emerging broadband markets in 2003, and further drastically curtailed in 2004 also in narrowband markets. In the US, the incumbents’ platforms are therefore considered to be inaccessible to entrants, as opposed to the open-access approach endorsed by the EU. See, Renda, A. (2007) and Nardotto et al. (2013).
24
households to the local switch) is prohibitively expensive, at least for the purpose of an alternative supply of traditional telecommunication service.15 Mandated access prices offer the entrant an opportunity to compete with the incumbent in the retail market by leasing the local loop at some regulated price. The competition is then service-based. This is different from facilities-based competition, in which both the incumbent and the entrant own the essential infrastructure and no leasing arrangements are required. Most of the commentators are persuaded of the advantages of the facilities-based competition in terms of variety, keen prices and innovation, whereas the service-based competition seems to provide no other benefits than keen prices through the regulator-promoted.16
iii. Access to incumbents’ infrastructure in European telecom sectors
The regulatory index used by the authors for the fixed-line segment is based on the number of existing legal measures that facilitate one-way access to incumbents’ networks. This index reflects access at different levels of infrastructure (e.g., local loop unbundling, line sharing, and bitstream access), and is well suited to the context of international comparisons, being independent of country-specific costs of building infrastructure. Moreover, this index is based exclusively on regulatory measures and not entry or market shares, so it allows distinguishing regulation from competition, contrary to the OECD index used in Alesina et al. (2005) which is in part based on the number of entrants.
Access regulation may have a quite different impact on the investment decisions of incumbents and entrants. The authors’ results suggest that regulation discourages investment by incumbents and that entrants’ total investment increases. However, they find that the impact of regulation on individual entrant’s investment is negative suggesting that investment by individual entrant declines with regulation that eases access even as entrants’ total investment increases. Therefore the increase in total entrants’ infrastructure investment is due to greater numbers of entrants but not to larger investments by individual entrants.
iv. Regulators’ response to incumbents’ and entrants’ infrastructure investments. The regulatory changes are a gradual process rather than a one shot affair. The regulators might be then subject to a commitment problem: when the level of incumbents’ infrastructure stock is high, national regulators could tend to grant easier access, which would be
15 Both in Europe and the U.S. a typical solution to this infrastructure bottleneck was the introduction of a
mandated access to the incumbent telephone network by means of unbundling and sharing of the local loop.
16
25
disincentive for incumbents to invest in the first place. Interestingly, the authors find some evidence that supports this phenomenon. Moreover, the data suggest that regulatory intensity is not affected by entrants’ infrastructure stock, so regulators seem to respond quite differently to incumbents’ and entrants’ infrastructure investments.
v. Simulated impact of access regulation on industry investment in Europe telecom sector
Facilities-based entry is likely to require substantial firm-level investment. The authors’ estimate suggests that increasing regulatory intensity by roughly the average change in the regulatory regime in EU 15 between 1997 and 2002 reduces incumbents’ infrastructure stock by approximately 49 percent, and long-term by as much as 72 percent. The same change in regulation increases entrants’ total infrastructure stock by approximately 60 percent, and long-term by as much as 73 percent.
They also find that the impact of entrants’ on incumbents’ infrastructure investments is positive, indicating that the respective investments are strategic complements. In other words, when entrants invest more, so do incumbents.17 This strategic effect reduces the negative impact of regulation on investment incentives. However they find that the negative impact of regulation on incumbent’s investment incentives is only partially compensated by strategic complementarity.
In terms of magnitude, they estimate the overall effect of access regulation on total industry investment in Europe to be a loss of some €16.4 billion, which corresponds to almost 23 percent of the infrastructure stock, over the past 10 years.
c. The impact of local loop unbundling on broadband penetration and the quality of Internet services.
Nardotto et al. (2013) propose an analysis of the unbundling experience that took place in traditional telephony network in the UK, based on two datasets, one concerning broadband penetration from 2005 to 2009, and one regarding broadband speed tests carried out by individuals in 2009.
With local loop unbundling, entrants are able to upgrade their individual lines and offer Internet services directly to customers by putting their equipment inside the incumbent’s
17
26
exchanges over the “last mile”. They can then install their own particular style of broadband, with differing speeds and download limits to those offered by the incumbent.
i. Broadband penetration
By using a dataset that consists of quarterly figures for all broadband lines subscribed to locally by end-users in the UK, between December 2005 and December 2009, the authors find that during the period in which entrants progressively unbundled local loops, broadband penetration more than doubled in the UK. However, apart from this upward trend, the local exchanges that experienced intra-platform competition through local loop unbundling did not seem to obtain higher penetration levels than those without. On the other hand, inter-platform competition from cable has increased local broadband penetration to a greater degree. Indeed, competition on cable took place for bit-stream access (i.e., when the connection is still managed by the incumbent) only (not local loop unbundling). Entrant with bit-stream access had then to focus on price competition. As a result the penetration improved. Accordingly, unbundling seems to have no positive effect on broadband penetration.
ii. Quality of Internet services
By combining a dataset that contains information on broadband speed tests carried out by individuals in 2009 with a dataset on the demographic characteristics by local exchange, the authors examine the impact of local exchanges inter-platform competition and local loop unbundling over the quality of Internet services measured as the broadband speed.
They find that the local exchanges that are characterized by inter-platform competition are the ones boasting the highest average speed. Moreover they find that the local exchanges that have experienced local loop unbundling entry have a higher average broadband speed than those that have not experienced it. Accordingly, it seems that the local loop unbundling entrants mainly competed by offering comparatively better conditions for their fastest connections.
iii. Conclusion
By competing over quality rather than over price, local loop unbundling did not expand the market penetration but rather increased the average broadband speed and consequently took some market shares from the incumbent (who did not increase its quality) and from the cable operators (whose still provide the highest quality). This is so because with local loop
27
unbundling the entrant has to install and maintain its own equipment over the “last mile”. So the entrants did compete in quality rather than in price as it would have been the case under bit-stream access.
d. The long-run effect of copper-loop unbundling on broadband penetration.
Crandall et al. (2013) examine the effects of copper-loop unbundling on household broadband penetration rate in 28 OECD countries from 2001 to 2010.
Their results indicate that unbundling has had little or no effect on broadband penetration in the short run, but has reduced penetration in the long run. According to the authors, it may be the case that unbundling reduced incentives for competitors to invent and deploy competing platforms and failed to enable entrants to climb the ladder of investment that facilitates the ability to duplicate incumbents’ network facilities and thus expand the realm of infrastructure-based competition. They also suggest that regulators have been unable systematically to correctly identify and price the network elements necessary for entry and then adjust prices over time to reflect the (presumably) diminishing need for unbundling as entrants become increasingly capable of building their own infrastructures. In many cases the regulators have gone further than just requiring the incumbent to make available the last-mile local loop. For instance, in some countries the regulators have forced the incumbent to provide other elements than voice service thought to be necessary for entrants to compete. It also seems that prices have been set at rates that have resulted in insufficient investment, meaning that they generally do not fully reflect costs.
Conclusion
IV)
There are two main confronting views on the link between competition and investment. On the one hand, conventional arguments extol the virtues of competition in ensuring both allocative and productive efficiencies (Smithian view) and also providing firms with the incentives to invest in innovation to escape from competition (pre-innovation incentives). On the other hand, the tradition stemming from Schumpeter puts monopoly rents at the heart of the innovation process (post-innovation incentives). Recent research indicates that the coexistence of these escape effect and Schumpeterian effect (pre- and post-innovation incentives), can be characterized by an inverted U-relationship.
28
Focusing on the impact of deregulation on heavy infrastructure investments, the OECD countries past decade experience display mixed results which depend on what the deregulation is about. This deregulation can concern a lowering of entry barriers, relaxing the constrained rate of return on capital, or a change in the ownership structure of the firm (privatization policy). Overall, this deregulation has led to higher investment. But studies more focused on the (fixed-line) telecommunications sector highlighted that promoting market entry through local loop unbundling may have a negative impact on network investment.
A remaining question is whether the new types of investment (for example the fiber roll-out in the telecommunication sector) have the same feature as the old ones and so if the lessons learnt from the past are still valid now. More empirical work on this issue using data from the NGA investment would certainly help in answering this debate which can only be settled on a case-by-case basis.
29
REFERENCES
Aghion, P., N. Bloom, R. Blundell, R. Griffith, and P. Howitt. (2005). “Competition and Innovation: An Inverted-U Relationship,” Quarterly Journal of Economics, 120, 701-728. Aghion-Howitt (1992). “A Model of Growth Through Creative Destruction”, Econometrica, 60, 323-351.
Alesina, A., Ardagna, S., Nicoletti, G., & Schiantarelli, F. (2005). Regulation and investment. Journal of the European Economic Association, 3(4), 791–825.
Arrow, K. (1962). “Economic Welfare and the Allocation of Resources for Innovations,” R. Nelson ed. The Rate and Direction of Inventive Activity, Princeton University Press.
Averch, H. and L. Johnson (1962). "Behavior of the Firm Under Regulatory Constraint."
American Economic Review, 52, 1053-1069.
Bain J. (1956). Barriers to New Competition, MA: Harvard University Press.
Baldwin, W. and J. Scott (1987). Market Structure and Technological Change, in Lesourne and Sonnenschein (eds.), Fundamentals of Pure and Applied Economics. Chur, Switzerland, and London: Harwood Academic Publishers.
Blundell, R. , Griffith, R., and J., Van Reenen (1999). “Market Share, Market Value and Innovation in a Panel of British Manufacturing Firms,” Review of Economic Studies, 66, 529-554.
Carlin, W., Schaffer M., and P., Seabright (2004). "A Minimum of Rivalry: Evidence from Transition Economies on the Importance of Competition for Innovation and Growth," The
B.E. Journal of Economic Analysis & Policy, De Gruyter, vol. 3(1), pages 1-45, September.
Cave, M. (2004). Making the Ladder of Investment Operational. Unpublished manuscript. Crandall, R., J. Eisenach, and A. Ingraham (2013), “The long-run effects of copper-loop unbundling and the implications for fiber”, Telecommunications Policy 37, pp 262-281
Grajek, M., & Roller, L. (2012). “Regulation and investment in network industries: Evidence from European telecoms,” Journal of Law and Economics 55(1): 189–216
30
Gilbert, R. and Newbery, D. (1982). “Preemptive Patenting and the Persistence of Monopoly,” American Economic Review, 72: 514-526
Grossman-Helpman (1991). “Quality Ladders in the Theory of Growth.” Review of Economic
Studies, 58, 43-61.
Ivaldi, M., D. Coublucq and G. McCullough (2012). “The Static-Dynamic Efficiency Trade-off in the US Rail Freight Industry: Assessment of an Open Access Policy”, IDEI Working Paper.
MacDonald J. (1994). “Does Import Competition Force Efficient Production?”, review of
Economics and Statistics, 76(4):721-727.
Mansfield, E., Rapoport J., Romeo, A., Villani, E., Wagner, S. M., and F. Husic (1977). The
Production and Application of New Industrial Technologies. New York: W.W.
Norton&Company.
Nicoletti, Giuseppe, Andrea Bassanini, Ekkehard Ernst, Sebastian Jean, Paul Santiago, and Paul Swaim (2001). “Product and Labor Markets Interactions in OECD Countries.” Working Paper, No. 312, OECD, Paris.
Nicoletti, Giuseppe and Stefano Scarpetta (2003). “Regulation, Productivity, and Growth: OECD Evidence.” Economic Policy, 18(36), 11-72.
Nickell, S. (1996). “Competition and Corporate Performance.” Journal of Political Economy, 104, 724-746.
Nardotto, M, T. Valetti, and F. Verboven (2013). “Unbundling the incumbent: Evidence from UK broadband”, wp.
Peltzman, S. (1971). "Pricing in Public and Private Enterprises, Electric Utilities in the United States." Journal of Law and Economics, 14, 109-147.
Renda, A. (2007). Transatlantic Telecom Services: The Pros and the Cons of Convergence. Center for European Policy Studies.
31
Sappington, D. and G. Sidak (2003). "Incentives for Anticompetitive Behaviour by Public Enterprises." Review of Industrial Organization, 22, 183-206.
Scherer, F. M. (1965). “Firm Size, Market Structure, Opportunity, and the Output of Patented Inventions.” American Economic Review, vol. 55, 1097-1125.
Scherer, F.M. (1967). “Market Structure and the Employement of Scientists and Engineers” American Economic Review, vol. 57, 524-531.
Schumpeter J. (1939). Business Cycles. A Theoretical, Historical and Statistical Analysis
of the Capitalist Process, New York, McGraw-Hill Book Co. Inc.
Scott, J. (1984). “Firm versus Industry Vraiability in R&D Intensity”, in Z. Griliches (Ed.),
R&D, Patents, and Productivity. Chicago: University of Chicago Press, 233-40.
Tirole (1988). The Theory of Industrial Organization, MIT Press.
Vickers, J. (1985). “Preemptive Patenting, Joint Ventures, and the Persistence of Oligopoly”, International Journal of Industrial Organization, vol. 3, 261-273.
Waverman, L., Meschi, M., Reillier, B. and Dasgupta, K. (2007). Access Regulation and Infrastructure Investment in the Telecommunications Sector: An Empirical Investigation, LECG Ltd. Unpublished manuscript.