1
CEEM Working Paper 2014-7
THE IMPACT OF INTERMITTENT RENEWABLE PRODUCTION AND MARKET COUPLING ON THE CONVERGENCE OF FRENCH AND GERMAN
ELECTRICITY PRICES
2
The Impact of Intermittent Renewable Production and Market Coupling on the Convergence of French and German Electricity Prices
Jan Horst KEPPLER, Sébastien PHAN, Yannick LE PEN, Charlotte BOUREAU1 Octobre 2014
Chaire European Electricity Markets (CEEM), Université Paris-Dauphine
1. INTRODUCTION
Interconnecting two adjacent areas of electricity production generates benefits in combined consumer surplus and welfare by allowing electricity to flow from the low cost area to the high cost area. It will lower prices in the high cost area, raise them in the low cost area and will thus have prices in the two areas converge. With unconstrained interconnection capacity, price convergence is, of course, complete and the two areas are merged into a single area. With constrained interconnection capacity, the challenge for transport system operators (TSOs) and market operators is using the available capacity in an optimal manner. This was the logic behind the “market coupling” mechanism installed by European power market operators in November 2009 in the Central Western Europe (CWE) electricity market, of which France and Germany constitute by far the two largest members. Market coupling aims at optimising welfare by ensuring that buyers and sellers exchange electricity at the best possible price taking into account the combined order books all power exchanges involved as well as the available transfer capacities between different bidding zones. By doing so, interconnection capacity is allocated to those who value it most.2
As predicted by theory and common sense, electricity prices in France and Germany converged substantially in 2010 and 2011 in the wake of market coupling (see below for more detailed descriptive statistics) with substantive increases of consumer surplus. These benefits accrued in both areas. In first approximation, France exports base-load power, while Germany exports peak-load
1 Jan Horst Keppler and Yannick Le Pen are full professor and associate professor of economics at Université Paris-Dauphine. Sébastien Phan (Compass Lexecon) and Charlotte Boureau (Master EDDE, Université Paris-X) are junior researchers at the Chaire European Electricity Markets (CEEM). The authors would like to thank Audrey Mahuet, Philippe Vassilopoulos and Aymen Salah Abou El-Enien (all EPEX Spot) as well as Dominique Finon (CNRS and CEEM) for their helpful comments. This paper has benefited from the support of the Chaire European Electricity Markets of the Paris-Dauphine Foundation, supported by RTE, EDF, EPEX Spot and the UFE. The views and opinions expressed in this Working Paper are those of the authors and do not necessarily reflect those of the partners of the CEEM.
2 Currently markets are coupled on the basis of available transfers capacity (ATC), i.e. commercially available transmission capacity once otherwise reserved capacities such as network safety margins or capacities already reserved through long-term contracts have been deducted from physically available total transfer capacity (TTC). In the future, European electricity markets operated by EPEX Spot will be coupled through so-called flow-based market coupling. The latter will go beyond the simple optimisation of available interconnection capacities but will also integrate and optimise “loop flows”, the passage of bilateral electricity flows through third countries, independent of the latter’s own prices. This will allow for even finer optimisation of overall available interconnection capacity but can in certain cases lead to counter-intuitive flows such as exports from a high-price country to a low-price country.
3
power, thus exporting and importing at different times of the day. However since 2012, electricity prices between France and Germany diverged, a process that accelerated during 2013. The hypothesis this paper is exploring is that this divergence is due to the significant production of variable renewables (wind and solar PV) in Germany, which tends to cluster during certain hours. Typically, solar production around noontime constitutes such an event. However, also wind production is highly auto-correlated and tends to have a significant impact during a limited number of hours during the year. When the production of variable renewables with low variable costs is high, German exports tend to saturate interconnections thus causing price convergence to cease and French-German electricity prices to diverge.
The primary objective of this article is to assess the impact of electricity production from variable renewables on the differential of French and German day-ahead electricity prices on the basis of five years of hourly price data in the EPEX Spot day-ahead market as well as hourly data of nuclear, wind and solar production. In addition, this article explores also the continuing impact of market coupling by confronting this empirical assessment of the Franco-German day-ahead market in the presence of the existing market coupling with a counter-factual scenario that assesses the evolution of the spread between French and German electricity prices with the observed levels of renewable production but under the assumption of the absence of market-coupling. By determining the difference in consumer surplus between the observed and the counter-factual scenario we measure in fact the benefit of market coupling and are able to show that market coupling mechanism mitigated the negative impact of the massive build-up on renewable capacity in Germany on price spreads and consumer surplus since 2011. This article thus assesses both the impact of both, electricity production by variable renewable energies and of market coupling on price spreads, consumer surplus and welfare.
Two limits of this analysis must be mentioned. First, a complete analysis of the evolution of the spread on all borders of France and Germany, rather than just the bilateral border, would have been much preferable. However, four and a half years of hourly price data were available only for France and Germany. Future research might be able to provide an even fuller picture. Second, during the four and a half year of analysis, European carbon prices declined to exceptionally low levels. In addition, coal prices declined for independent reasons. The two factors taken together meant that coal-fired power generation substantially substituted for gas-fired power generation in the European merit order. To some extent this might have increased German exports to France beyond the impact of the production from the variable renewables, wind and solar, for which this analysis is testing. Again, data questions (coal and CO2 prices are only provided on a daily basis) have prevented easy inclusion of these issues.
Despite these limitations, this remains to our knowledge the first article that empirically analyses the effect of solar and wind generation on price convergence. So far work in a similar vein such as the articles by Pellini (2012) for Italy and by Denny et al. (2010) for Ireland-Great Britain was based on simulations. The structure of the article is as follow. Section 2 provides some general background and a review of the literature. Section 3 presents a number of descriptive statistics about the evolution of the French-German price spread before and after market coupling. Section 4 presents the available data and introduces the ELIX concept. Section 5 specifies the econometric methodology employed to test for the impact of variable renewables on the French-German price spread. Section 6 presents the results of the econometric test. Section 7 provides an estimate of French consumers from market coupling and section 8 concludes.
4 2. BACKGROUND AND LITERATURE REVIEW
In December 2008, the European Commission in its 2nd Climate and energy package decided to
promote renewable production in the European energy mix. The target was to reach 20% of renewable energy in the total energy consumption in the EU by 2020. However at the current state of technology, the most cost-efficient forms of renewable energy generation, other than hydro power which is in limited supply in most European countries, are wind and solar PV which are characterized by both intermittent production and low marginal costs and thus create pecuniary externalities. These consist mainly of lower average prices and reduced load factors for existing producers of dispatchable thermal power. For instance, Woo et al. (2011) in an empirical study of the Texas electricity market found that higher wind production leads both to lower average prices and higher price volatility. MacCormack et al. (2010) found that wind integration tends to increase average costs of production as the generator capacity factor was declining. Indeed, since solar and wind generation have a very low marginal cost they always have priority in the merit order and thus decrease the number of production hours for incumbent generators.
Due to the low average load factors of solar PV and wind, large amounts of capacity are needed to arrive at meaningful contributions to electricity supply. This means that when the wind is blowing and the sun is shining, very sizeable amounts of electricity are produced at certain hours. Germany now has more than 70 GW of combined solar PV and wind capacity, which corresponds to roughly two thirds of peak demand and far larger than demand at certain low demand hours (e.g., week-ends), all the while producing less than 15% of annual demand. This means that at certain hours renewable production is larger than the German electricity system is able to absorb either due to limited demand or limited internal interconnections. In principle, more renewables energy requires strengthening internal networks and external interconnections. Schaber et al. (2012) computed a model based on historical data in order to assess the effect of grid extensions for the market, with an increasing share of wind capacities until 2020. They found that grid extension helped to reduce the externalities of wind integration. In a similar spirit, Spiecker et al. (2013) developed a model covering 30 European countries which simultaneously optimized generation investments as well as the utilization of transmission lines. Their model confirms that wind integration requires the development of additional interconnection capacities (see also Lynch, Tol, and O'Malley (2012)). At current levels of transport capacity, interconnection congestion remains a frequent by-product of wind and solar generation. The consequence is, of course, price divergence between the two sides of the border. From a social welfare point of view, this price divergence is detrimental to consumers. With unconstrained interconnections, consumers in the higher price zone would gain more in terms of consumer surplus than what other consumers in the lower price zone would lose. Based on a simulation model Doorman and Frøystad (2013), for instance found that developing an HVDC interconnection between Norway and Great Britain would strictly generate an increase in welfare. Physical interconnection extension is also part of the roadmap proposed by Creti et al. (2010) for the Italian market.
According to the current trend of European network investments, one should not expect a substantial increase in interconnections anytime soon. This is not the only constraint. In a study of European electricity prices from 2002 to 2006, Zachmann (2008) found that market integration failure was only partially due to the lack of physical interconnection capacities. At the time, the lack of cross-border congestion management was also an important factor of market integration. It is here that market coupling plays its role as an intermediate solution towards market convergence and the efficient integration of intermittent renewable energy in the European electricity system. By
5
aggregating all offers and requests, market coupling should optimize the allocation process of cross-border capacities. In a first study, Hobbs et al. (2005) estimated that the welfare impact of market coupling between Belgian and the Netherlands delivered an increase in social surplus only under certain conditions concerning the pricing behaviour of producers. In a more recent study, Ehrenmann and Neuhoff (2009) found through a numerical simulation for the North-western European network that implicit auction (market coupling) performs better than explicit auction when generators acting strategically. Market coupling is therefore a simple and effective way to integrate market and lower the negative effects of intermittent wind and solar generation.
3. DATA
All data used in this study are hourly data, which allow to account for intraday variation in the production of intermittent wind and solar PV as all as for annual, weekly and daily seasonality during peak and off-peak hours. The price data, hourly day-ahead prices for the French and German electricity markets, were provided by EPEX Spot, the market operator for day-ahead and intraday markets in Germany, France, Austria and Switzerland since 2008. Each day is thus represented by 24 different prices submitted the previous day at 11 am measured in Euros per MWh. Our sample reaches from November 2009 until June 2013 and covers 32 112 hours.
Consumption and nuclear generation data in France were provided by RTE, the French transmissions system operator. The results presented in Section 6 show that both have highly significant relations with the French-German electricity price spread. French consumption is positively related to the price spread by a simple demand-price relation: the higher French demand, the greater the likelihood to find interconnections congested due to increased imports. Conversely, nuclear generation as the base of the French load curve is negatively linked to the price spread. Even if nuclear generation is quite stable during the day, its variations all along the year are significant. For instance, when several nuclear plants are in maintenance, the French market is more dependent on German production. Like the price data, the data on French demand and French nuclear production were provided at the hourly level for the period from November 2009 to June 2013.
Data on production from German variable renewable energy (VaREN) source, that is solar PV and wind, were provided by the European Energy Exchange (EEX). Due to the intermittency of wind and sunshine, the use of hourly data is essential. Variations are huge. Wind capacity can vary from 0.1 to 24 GW, whereas solar capacity can vary from 0 to 23 GW. This volatility of production generates issues for cross-border transport. Unlike power from thermal plants, power from renewable energy is not used to answer to a specific demand but is fed in the system as soon as there is wind or sunshine to produce electricity regardless of the demand and supply balance. This results in a general price decline as well as strong variations in residual demand. During periods of strong VaREN production, France tends to import from Germany until interconnections are blocked. Even if EPEX Spot through market coupling allocates interconnection capacities optimally, prices diverge when VaREN production is high.
Price divergence is, of course, also a function of available interconnection capacity. The theoretical common price in the absence of network constraints (unlimited interconnection capacity) thus provides an important normative benchmark for assessing losses of consumer surplus and welfare. EPEX SPOT and EEX provide this benchmark by publishing since October 2010 the European Electricity Index (ELIX). The ELIX is calculated on the basis of the actual aggregated bid and offer curves of France, Germany and Switzerland without taking into account physical congestions
6
between these markets. In addition, it does not take into account the existing interconnections with other European markets. In other words, the ELIX approximates the price that would occur if unlimited interconnection capacities between the three countries existed. We used this index at hourly-level between November 2010 and June 2013 in order to estimate the potential positive impact of an increase in interconnection capacities, comparing the ELIX with real prices during the same period.
4. DESCRIPTIVE STATISTICS
The data show a significant improvement in price convergence after the market coupling the 10th November 2010. Convergence is defined by convention as the percentage of hours during which absolute price differences are below € 0.1 per MWh. In 2009 and before market coupling, German and French price converged only 1% of the time. After the introduction of market coupling, prices converged 67% of the time in 2011. However, the trend has been downward in recent years. While in 2012 the convergence rate was still 64% and it was only 41% for the first semester of 2013.
Table 1 shows in detail the percentage of convergence for each month since 2011. We see that winter and summer months, sometimes for different reasons, suffer particularly from congestions. During winter, events are driven by the high thermo-sensibility in France, when peak consumption for electric heating rises up to 2.3 GW for every degree less due to low temperatures. In response French imports increase strongly as electricity from Germany, of which a substantial but variable part is produced by wind and solar, is the most cost-effective option. This means that interconnections are saturated more frequently than during other times of the year and prices diverge.
The effect is noticeable, for instance, during the extremely cold month of February 2012 when price converged only 20% of the time (see column 2 in the table below). Demand was so high that on 9th
February 2012 at 10 am French prices reached € 1938 per MWh whereas in Germany prices were around only € 100 per MWh due to congestion. In summer, air conditioning consumes one third of peak electricity production, which also induces added exchanges between France and Germany.
Table 1. Price convergence between France and Germany
Month 2011 2012 2013 Jan 77% 63% 38% Feb 76% 20% 26% Mar 72% 52% 12% Apr 73% 73% 48% May 64% 72% 66% Jun 44% 74% 57% Jul 48% 85% N.A Aug 53% 82% N.A Sep 72% 75% N.A Oct 82% 51% N.A Nov 82% 69% N.A Dec 63% 50% N.A Average 67% 64% 41%
7
Table 2 and figure 1 are focusing on the month of March 2013, where the convergence rate was 12% according to Table 1. We report in column 1 the average convergence rate for each hour. The rate is noticeably low during the night and at noon. For instance, during the whole month prices at 2 am and 12 pm never converged. Similarly, from 8 am to 3 pm, the convergence rate has not exceeded 10%. This can be explained by the combination of two effects, on the one side consumption at those hours is low, all the while production coming from solar and wind power is not limited and is potentially high. We further see in column 2 that German solar panels and wind turbines generated on average respectively 11 and 6 GWh at 12 am, which means that French distributors massively imported this cheap electricity with the result that interconnections were congested during these hours.
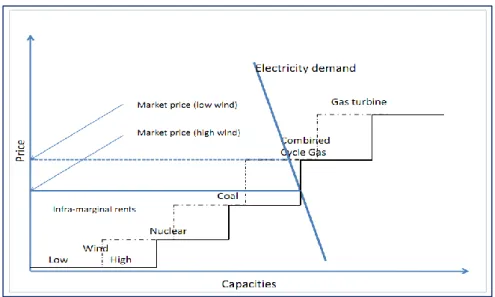
Figure 1. Shifting of the merit order curve to the right due to low variable cost renewables
Of course that does not mean that France directly imported electricity from wind and solar producers. Once uploaded, one electron is indistinguishable from another. What happens is that the influx of variable renewables with zero short-run marginal costs pushes the merit order curve to the right (see Figure 1 below). This means that prices will fall in the country concerned and traders in neighbouring countries will begin to import arbitraging between domestic production costs and prices and now less expensive imports.
8
Table 2. Price convergence and renewable generation for march 2013
Hour Price
convergence Solar wind total RES
0 6% 0 6180 6180 1 0% 0 6047 6047 2 6% 0 5977 5977 3 12% 0 5957 5957 4 19% 0 5888 5888 5 19% 0 5881 5881 6 16% 72 5840 5912 7 16% 933 5779 6713 8 9% 3240 5693 8934 9 3% 6268 5793 12062 10 3% 8920 6082 15002 11 3% 10639 6266 16906 12 3% 11271 6327 17599 13 3% 10763 6410 17174 14 6% 9249 6499 15749 15 9% 6977 6681 13658 16 19% 4081 6714 10796 17 32% 1441 6649 8091 18 45% 172 6668 6841 19 29% 10 6840 6850 20 9% 0 6943 6943 21 16% 0 6849 6849 22 3% 0 6515 6515 23 0% 0 6276 6276
Figure 2. Average hourly price and solar production in Germany in March 2013
0% 5% 10% 15% 20% 25% 30% 35% 40% 45% 50% 0 2000 4000 6000 8000 10000 12000 0 5 10 15 20 Average convergence rate MW/h Hours
9
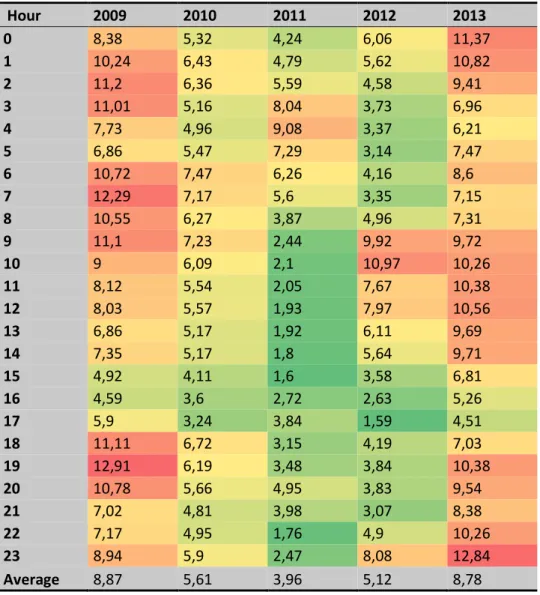
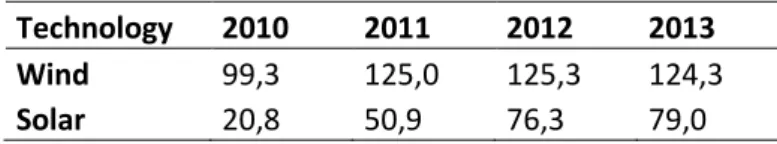
Beyond the convergence rate, we investigated by how much prices diverged when interconnections were congested. In other words, we wanted to assess how much the electricity price spread between France and Germany was influenced by solar and wind generation. Table 3 shows absolute price differences at hourly levels from 2009 to 2013. Two phases can be distinguished in this Table. First, the absolute spread between German and French electricity prices decreased between 2009 and 2011 most likely due to the market coupling introduced in late 2010 (see results below). Second, the absolute spread doubled during 2012 and 2013 reaching on average the same level as in 2009. As will be shown by the regressions below, this is heavily influenced by the massive build-up of new solar and wind capacity in Germany during these years. Table 3 also reports intraday changes: contrary to the first period, in 2012 and 2013 there were high spreads during the night and between 10 am and 2 pm due to wind and solar respectively. Since 2010, it should be noticed that average daily solar and wind production increased by 380 and 25 per cent respectively (Table 4).
Table 3. Absolute price difference in average
Hour 2009 2010 2011 2012 2013 0 8,38 5,32 4,24 6,06 11,37 1 10,24 6,43 4,79 5,62 10,82 2 11,2 6,36 5,59 4,58 9,41 3 11,01 5,16 8,04 3,73 6,96 4 7,73 4,96 9,08 3,37 6,21 5 6,86 5,47 7,29 3,14 7,47 6 10,72 7,47 6,26 4,16 8,6 7 12,29 7,17 5,6 3,35 7,15 8 10,55 6,27 3,87 4,96 7,31 9 11,1 7,23 2,44 9,92 9,72 10 9 6,09 2,1 10,97 10,26 11 8,12 5,54 2,05 7,67 10,38 12 8,03 5,57 1,93 7,97 10,56 13 6,86 5,17 1,92 6,11 9,69 14 7,35 5,17 1,8 5,64 9,71 15 4,92 4,11 1,6 3,58 6,81 16 4,59 3,6 2,72 2,63 5,26 17 5,9 3,24 3,84 1,59 4,51 18 11,11 6,72 3,15 4,19 7,03 19 12,91 6,19 3,48 3,84 10,38 20 10,78 5,66 4,95 3,83 9,54 21 7,02 4,81 3,98 3,07 8,38 22 7,17 4,95 1,76 4,9 10,26 23 8,94 5,9 2,47 8,08 12,84 Average 8,87 5,61 3,96 5,12 8,78
10
Table 4. Average daily production of German solar and wind (GWh)
5. METHODOLOGY
The principal objective of this article is to estimate the impact of electricity produced by wind power and solar PV in Germany on the differential between French and German electricity prices from November 2009 to June 2013. As in any time series estimation, this requires the assumption that variables other than the dependent variable (the spread of French-German electricity prices) and the explanatory variables (wind production, solar PV production, French consumption and nuclear production) either have no significant impact on the dependent variable or remain stable. This is a strong assumption for the period under consideration. Other than the rapid increase in renewables production and the advent of market coupling, for whose impacts we have tested, European electricity markets have been affected during the past five years inter alia by the phase-out of one third of Germany’s nuclear production (8% of total German electricity production), the collapse of the EU ETS market for CO2 emission certificates, the US shale gas revolution causing a steep decline in coal prices as well as several years of below trend growth in electricity demand due to the combined effects of the continuing economic crisis and big improvements in industrial energy efficiency.
The question is, of course, whether these structural shifts affect the differential between French and German electricity prices to an extent that their omission would draw into doubt the significance of the positive correlation renewables production and the French-German price spread established in the following sections. The very good test statistics of the econometric equations suggest otherwise. A Chow test for a structural break on 14 March 2011, the day when 8 German nuclear reactors were taken off the grid following the accident at Fukushima Dai-ichi, also proved inconclusive. It is thus unlikely that the initiation of Germany’s nuclear phase-out had a major impact on spreads.
However, the R2 of 0.73 (after market coupling) suggests that other factors than German renewable
production, French demand and nuclear production may play a role in explaining the recent increase in price spreads and corresponding decreasing the gains from trade. Future research will undoubtedly shed more light also on factors other than renewable production, however given the results below it can be safely said that any satisfactory explanation will need to include the latter. Electricity produced by VaREN is not the only but according to these tests the decisive factor in explaining the recent increase in the differential between French and German electricity prices. One additional explanation that is not captured in this analysis is of course the impact of exports and imports from countries other than France and Germany. France is also connected to Belgium, Switzerland, Italy and the United Kingdom, while Germany is also connected to the Netherland, Switzerland, Austria, Czech Republic, Poland, Denmark and Sweden. However, one should not overestimate this aspect; Germany and France clearly remain the most important trading partner for each other in the electricity market.
Technology 2010 2011 2012 2013 Wind 99,3 125,0 125,3 124,3
11
An additional explanatory variable could be constituted by variations in the available transfer capacity (ATC) on the French-German interconnection that is at least partly correlated with cross-border flows and variable renewable production in Germany and hence price spreads. In principle, one would assume that ATC does not display much short-term volatility, is unaffected by VaREN production and thus of little explanatory power to explain either congestion or the differential between French and German electricity prices. A recent paper (unpublished) by Salah Abou El-Enien (2014) at EPEX Spot, however suggests that ATC may well be negatively correlated with variable renewable production. There is anecdotal as well as statistical evidence that transport system operators (TSOs) increase the safety margin of the total transfer capacity in the face of increased forecasts of wind and solar production in order to be able to respond flexibly to the inherent unpredictability of VaREN production. This, of course, decreases ATC and further increases the impact of VaREN production on spreads. However, due to the independent and to some extent arbitrary action of TSO’s, this effect might not be entirely captured by VaREN production alone and ATC figures might thus contain added information about the Franco-German price spread. In our test however, the explanatory power was not enhanced by adding ATC as an additional explanatory variable.3
We will now assess if the development of VaREN production has tended to minimize the positive effect of market coupling. As we wanted to catch the effect of renewable energy production on prices spread, we used intraday data at the hourly level. Because of the structure of price formation on the EPEX Spot day-ahead market where 24 hourly prices are provided at the same time at 12h30 the day preceding production and delivery a simple time series model cannot be used. The price for each one of the 24 hours of the following day is provided together with all the others and cannot be considered a different time period containing added information. The price at 2 am does not take into account more information than the price at 1 am. Therefore, we chose to analyse them as panel data with each hour of the day as one distinct individual series. (For further information on this methodology see Huisman, Huurman and Mahieu (2007). Karakatsani and Bunn (2008) also successfully employed the panel data method for electricity price forecasting.) Our panel was then composed of 24 distinct time series over 1 338 periods, from 1 November 2009 to 30 June 2013. More than on the convergence rate, we focused on the magnitude of the price spread. The dependent variable was thus computed as the difference between French and German prices (𝑆𝑝𝑟𝑒𝑎𝑑ℎ,𝑡). We used linear regression with fixed effects for estimating the equation below:
𝑆𝑝𝑟𝑒𝑎𝑑ℎ,𝑡= 𝛽0+ 𝛽1∗ 𝐶𝑜𝑛𝑠𝐷𝑖𝑓𝑓ℎ,𝑡+ 𝛽2∗ 𝑁𝑢𝑐𝑙𝑒𝑎𝑟ℎ,𝑡+ 𝛽3∗ 𝑆𝑜𝑙𝑎𝑟ℎ,𝑡+ 𝛽4∗ 𝑊𝑖𝑛𝑑ℎ,𝑡+ 𝛽5
∗ 𝑆𝑝𝑟𝑒𝑎𝑑ℎ,𝑡−1+ 𝛽6∗ 𝑆𝑝𝑟𝑒𝑎𝑑(ℎ,𝑡−2) Where:
𝐶𝑜𝑛𝑠𝐷𝑖𝑓𝑓 is the difference between consumption in France and consumption in Germany for the individual (hour) h and time (day) t
𝑁𝑢𝑐𝑙𝑒𝑎𝑟ℎ,𝑡 is the production of nuclear plant in France for the individual h and time t
𝑆𝑜𝑙𝑎𝑟ℎ,𝑡 is electricity generation coming from German photovoltaic for the individual h and time t 𝑊𝑖𝑛𝑑ℎ,𝑡 is electricity generation coming from German wind turbines for the individual h and time t
12
The results in Table 5 permit a number of observations. The spread between German and French electricity prices is directly linked to French consumption through electricity imports, which means that when consumption is high in France interconnections tend to be congested. In the opposite sense, French nuclear production, which is high when Germany imports, would be expected to be negatively correlation with the French-German price spread. Concerning solar and wind generation, we expect them to have a positive impact on the spread between French and German electricity prices. Solar PV and wind power operate with a short-run marginal cost close to zero and thus lower the German electricity price, encouraging French distributors to import massively. The high variability of solar PV and wind generation and the high level of ramp costs (which impeded dispatchable plants to exit the market for short periods of time), supply can occasionally exceed demand and lead to very low or even negative prices.
In order to assess the market coupling effect, we split our sample in two sub-samples before and after the initiation of market coupling. The key question is how market coupling changed the impact of solar PV and wind production built between 2011 and the first semester of 2013 on the Franco-German price differential. While the results show that massively increased renewable capacity continued to increase the spread also once market coupling was instituted, the results also show that market coupling strongly mitigated this impact. The coefficients for renewable production before market coupling are unequivocally higher than the coefficients subsequent to market coupling. In other words, without market coupling the massive increase in German renewable production would have generated even larger spreads between French and German electricity prices than what actually was the case.
This allows assessing the welfare impacts of market coupling to French consumers. This was done by comparing a hypothetical prices scenario that combines the observed renewables production during 2011 and 2012 with the coefficients derived from the estimation before market coupling. These prices were then compared to the actually observed prices. Finally, on the basis of this price spread and the observed consumption we computed the gain in consumer surplus.
We also used the European electricity index (ELIX) to assess how much French consumers would have gain if we had unlimited interconnection capacities. We are aware that this is only a gross surplus and is therefore a bit biased. Reaching the ELIX price would induce massive investments in interconnection capacities and thus increase the price paid by consumers through higher transportation tariffs and limit their welfare gains. Only detailed cost-benefit analysis benefitting from extensive information on grid investment costs could establish the optimal trade-off between infrastructure investment and trading gains.4
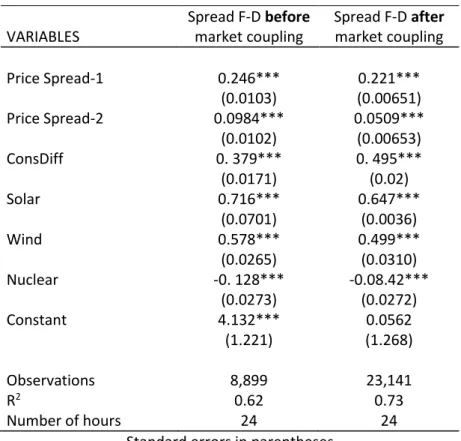
6. RESULTS: IDENTIFYING THE PRINCIPAL DRIVERS OF THE FRENCH-GERMAN PRICE SPREAD Table 5 shows the regressions of equation (1) on the two sub samples before and after market coupling. The R2 with 0.62 (before market coupling) and 0.73 (after market coupling) is satisfactory,
in particular given the omission of variables from third countries. The significance of all the explanatory variables is very high and all the coefficients have the expected sign. They both show an important inertia (related to the structure of industrial and household consumption and persistence
4 See Janssen (2014). This recent doctoral thesis provides elements for a conceptual framework for assessing investment in transport infrastructure. While stopping short of developing an easily implementable model, it discusses the principal considerations that would need to go into the development of such a model and offers a number of leads for the interested reader.
13
of weather patterns) and price spreads at date t are partially defined by the spreads at t-1 and t-2. As expected, consumption has a positive impact on the price difference. This can be explained by congestion at interconnections when there is high demand in France.
The impact of nuclear power generation on the French-German price spread has also the expected sign, is highly significant but is overall not very strong. The higher the electricity output from nuclear plants, the less German and French prices diverge. Nuclear production can here be taken as a proxy for French production in general, of which it currently constitutes 80%. Other things equal, the more electricity is being produced by French nuclear plants, the less France needs to rely on imports, which tend to lead to congestion and price divergence. Thus with high nuclear output, interconnections remain available and prices converge. Table 5 thus logically shows a negative coefficient for the impact of nuclear power generation on the price spread.
As one might expect, also the coefficient related to the difference between French and German consumption (ConsDiff) is significant and positive. This means that the price spread as defined here (the difference between the French and the German price) increases either when French consumption is high or German consumption is low. In both cases, France is importing more from Germany, which lead to interconnection congestion and then to price divergence. Including this variable significantly raises the R2and shows that export and import flows are the result of
consumption patterns in addition to production patterns.
Finally, the results in Table 5 also confirm the key assumption of this article, namely that electricity production by German VaREN is positively related to the difference between French and German electricity prices. Both solar PV and wind generation have positive and significant coefficients and thus increase the price spread.
Table 5. Results of OLS model
VARIABLES Spread F-D before market coupling Spread F-D after market coupling Price Spread-1 0.246*** 0.221*** (0.0103) (0.00651) Price Spread-2 0.0984*** 0.0509*** (0.0102) (0.00653) ConsDiff 0. 379*** 0. 495*** (0.0171) (0.02) Solar 0.716*** 0.647*** (0.0701) (0.0036) Wind 0.578*** 0.499*** (0.0265) (0.0310) Nuclear -0. 128*** -0.08.42*** (0.0273) (0.0272) Constant 4.132*** 0.0562 (1.221) (1.268) Observations 8,899 23,141 R2 0.62 0.73 Number of hours 24 24
Standard errors in parentheses *** p<0.01, ** p<0.05, * p<0.1
14
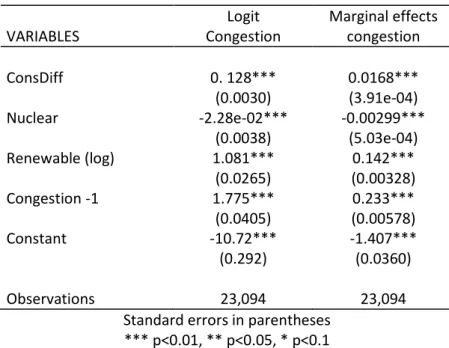
In order to check for robustness, we report in Table 6 a Logit regression where the dependent variable is a dummy equal to 1 if the interconnections are congested. These results confirm the congestion effect of renewable. Column (1) shows the positive effect of solar PV and wind generation on the likelihood of interconnection congestion, while column (2) reports the marginal effects. These results show renewable energy generation needs to be taken into account in any assessment of European electricity market integration.
Table 6. Test for marginal effects on congestion Logit Marginal effects
VARIABLES Congestion congestion
ConsDiff 0. 128*** 0.0168*** (0.0030) (3.91e-04) Nuclear -2.28e-02*** -0.00299*** (0.0038) (5.03e-04) Renewable (log) 1.081*** 0.142*** (0.0265) (0.00328) Congestion -1 1.775*** 0.233*** (0.0405) (0.00578) Constant -10.72*** -1.407*** (0.292) (0.0360) Observations 23,094 23,094
Standard errors in parentheses *** p<0.01, ** p<0.05, * p<0.1
Comparing the two regressions in Table 5 shows a significant change in the constant term impact. Once market coupling had been introduced in November 2010, price differences were structurally reduced regardless the hour or the day. However, it is difficult to compare only the coefficients between the two samples knowing that solar PV and wind capacities have significantly increased since then.
7. The impact of market coupling on French consumer surplus
In order to assess what would have happened if the market coupling was not introduced, we made projections based on the pre-market coupling model with the realized value of solar and wind productions. In other words, we used the coefficients of the first column of Table 5 for simulating the trend that would follow the price spread without the market coupling. Econometric estimations of a scenario in which current levels of production of wind and solar were over-laid with the parameters of the situation before market coupling showed that average daily price during 2012 of € 46.93 per MWh would have been € 3.10 per MWh higher, a 6.6% increase on the average 2012 price. Assuming a locally linear long-term elasticity of French electricity demand of -1 (see Bourbonnais and Keppler,
15
2013), this would implied an equivalent decrease in consumption from 490 TWh to 458 TWh with a concomitant decrease in consumer surplus of € 1.47 billion during 2012.5
Conversely, with “unlimited” capacity of all European interconnections such that consumers never experienced import constraints, and the European market was completely homogenised, the price would by definition always correspond to the ELIX reference price. In this case, daily average prices during 2012 would have been on average € 4.15 per MWh lower to reach the average level of the ELIX price of € 42.78 per MWh. Assuming the same demand elasticity of -1 such a 9.1% decrease in prices would have implied an increase in demand to 533 TWh and an increase in consumer surplus of € 2.1 billion. Even given the unavoidable approximations of such an exercise, the results allow two important conclusions. First, market coupling in the CWE market has provided French electricity consumers with a substantial gain in consumer surplus. Second, further improving interconnections would significantly increase this gain.
This analysis has been undertaken to show the orders of magnitude at stake. Several “health warnings” apply. First, increases in the surplus of French consumers are not equivalent to increases in total net welfare. Due to the exports of cheap renewable energy, German consumers have experienced higher prices than they otherwise would have. German and French producers also respectively received higher and lower profits respectively. A more complete analysis would have to take into account all four effects and net them out. In addition, what applies to the econometric analysis necessarily also applies to the analysis the welfare analysis. A market with higher CO2 and coal prices might have seen somewhat lower imports and thus a somewhat lower welfare gain for French consumers from market coupling or unlimited interconnections. However, under the observed prices during 2009-2013, market coupling reduced the electricity portion of the bill of French consumers (or their suppliers) by about 7% below the level it would have been otherwise.6 .
Including producers and German consumers will thus not do away with the highly stylised nature of these estimations. First, not all electricity is sold at day-ahead prices, although the day-ahead price constitutes the reference for future prices as well as for a large number of bilateral over-the-counter deals. Second, Germany is by far the largest but not the only country with which France entertains electric interconnections. Absence of market coupling or increasing interconnection capacity would thus trigger some trilateral price effects which could be captured by much more complex computations. Despite these limitations the orders of magnitude estimated nevertheless provide a compelling indication for the benefits of market coupling and further increases in electric interconnection capacity between the two countries.
5 This approach follows that of Creti et al. (2010) for the Italian Power Exchange (GME) where the losses due to interconnections constraints at the French-Italian border were estimated at € 160 million in 2007.
6 Of course, lower wholesale electricity prices are not an unequivocal public good per se. Otherwise Europe would not worry about current gas plant closures leading to security of supply challenges and think about capacity mechanisms to provide added remuneration to wholes market prices. The above sketch of welfare analysis thus aims exclusively at showing the existence and order of magnitude of the efficiency gains due to market coupling.
16 8. CONCLUSIONS
This article, based on hourly data between 2009 and 2013 from the French and German EPEX Spot electricity market, provides evidence for the negative impact of solar PV and wind generation on price convergence. This effect occurs since interconnections congest as massive production by solar PV and wind can no longer be absorbed by national demand in Germany and is exported in great quantities to neighbouring countries, and particularly France. We also found that market coupling significantly mitigated the negative effect of intermittent renewables on price convergence but not by enough to actually cancel it.
Price convergence between markets is, of course, desirable as it maximises the combined consumer surplus between two countries. We have thus shown that in the presence of massive renewable flows market coupling increased during 2012 the annual consumer surplus of French electricity consumers by almost 1.5 billion Euros. These gains could be higher still, if unconstrained interconnections where available at all times. Net effects, taking into account the loss in consumer surplus by German producers as well as gains and losses by producers on both sides of the border, would of course be smaller and will be assessed in future work. Nevertheless, the results of this article show that the significant increase in the production of variable renewables that Europe has witnessed in recent years requires a new look at European power market integration. It poses, in particularly the question of what constitutes success in terms of market harmonization and what is the socially optimal level of physical infrastructure provision of both at the national and the European level.
References
Bourbonnais, Régis and Jan Horst Keppler (2013). “Estimation de l’élasticité prix de la demande électrique en France.” CEEM Working Paper 6,
http://www.ceem-dauphine.org/assets/wp/pdf/CEEM_Working_Paper_Keppler_et_Bourbonnais4.pdf
Creti, Anna, Eileen Fumagalli and Elena Fumagalli (2010). “Integration of Electricity Markets in Europe: Relevant Issues for Italy. Energy Policy 38(11): 6966-6976.
Denny, Eleanor, A. Tuohy, P. Meibom, A. Keane, D. Flynn, A. Mullane and M. O'Malley (2010). “The Impact of Increased Interconnection on Electricity Systems with Large Penetrations of Wind Generation: A Case Study of Ireland and Great Britain.” Energy Policy 38(11): 6946-6954.
Doorman, Gerard L. and Dag Martin Frøystad (2013). “The Economic Impacts of a Submarine HVDC Interconnection between Norway and Great Britain.” Energy Policy, 60: 334-344.
Ehrenmann, Andreas and Karsten Neuhoff (2009). “A Comparison of Electricity Market Designs in Networks.” Operations Research 57(2): 274-286.
Hobbs, Benjamin F., Fieke A.M. Rijkers and Maroeska G. Boots (2005). “The more Cooperation, the more Competition? A Cournot Analysis of the Benefits of Electric Market Coupling.” Energy Journal, 26(4): 69-98.
Huisman, Ronald, Christian Huurman and Ronald Mahieu (2007). “Hourly Electricity Prices in Day-Ahead Markets.” Energy Economics, 29(2):240-248.
17
Janssen, Tanguy (2014). “Economic Analysis of the Cross-Border Coordination of Operation in the European Power System.” Doctoral thesis at the RITM research Center, Université Paris-Sud, Paris. Karakatsani, Nektaria V. and Derek W. Bunn (2008). “Forecasting Electricity Prices: The Impact of Fundamentals and Time-Varying Coefficients.” International Journal of Forecasting 24(4): 764–785. Le Pen, Yannick and Benoît Sévi (2010). “Volatility Transmission and Volatility Impulse Response Functions in European Electricity Forward Markets.” Energy Economics 32(4): 758-770.
Muireann Lynch, Richard S. Tol and Mark J O'Malley (2012). “Optimal Interconnection and Renewable Targets for North-West Europe.” Energy Policy 51: 605-617.
MacCormack, John, Aidan Hollis, Hamidreza Zareipour and William Rose Hart (2010). “The Large-Scale Integration of Wind Generation: Impacts on Price, Reliability and Dispatchable Conventional Suppliers.” Energy Policy, 38(7): 3837-3846.
Pellini, Elisabetta (2012). “Measuring the Impact of Market Coupling on the Italian Electricity Market.” Energy Policy 48: 322-333.
Salah Abou El-Enien, Aymen (2014). “The Compromise between Market Coupling and Increasing Intermittent Renewable Energy Sources (RES) Installed Capacity.” Unpublished Working Paper, Paris: EPEX Spot.
Schaber, Katrin, Florian Steinke and Thomas Hamacher (2012). “Transmission Grid Extensions for the Integration of Variable Renewable Energies in Europe: Who Benefits Where?” Energy Policy 43: 123-135
Spiecker, Stephan, Philip Vogel, and Christoph Weber (2013). “Evaluating Interconnector Investments in the North European Electricity System Considering Fluctuating Wind Power Penetration.” Energy Economics 37: 114-127.
Woo, Chi-Keung, I. Horowitz, J. Moore and A. Pacheco (2011). “The Impact of Wind Generation on the Electricity Spot-Market Price Level and Variance: The Texas Experience.” Energy Policy 39(7): 3939-3944.
Zachmann, Georg. “Electricity Wholesale Market Prices in Europe: Convergence?” Energy Economics, 30: 1659 1671