DIAL • 4, rue d’Enghien • 75010 Paris • Téléphone (33) 01 53 24 14 50 • Fax (33) 01 53 24 14 51 E-mail : [email protected] • Site : www.dial.prd.fr
D
OCUMENT DE
T
RAVAIL
DT/2006-11
Inequalities and equity in Africa
Denis COGNEAU
Thomas BOSSUROY
Philippe De VREYER
Charlotte GUENARD
Victor HILLER
Philippe LEITE
Sandrine MESPLE-SOMPS
Laure PASQUIER-DOUMER
Constance TORELLI
INEQUALITIES AND EQUITY IN AFRICA
1 Denis CogneauIRD, DIAL, Paris [email protected]
Thomas Bossuroy EHESS, DIAL, Paris [email protected] Philippe De Vreyer Université Lille-II, DIAL, Paris [email protected] Charlotte Guénard Université Paris-I, IEDES,
DIAL, Paris [email protected] Victor Hiller Université Paris-I [email protected] Phillippe Leite EHESS, DIAL, Paris [email protected] Sandrine Mesplé-Somps
IRD, DIAL, Paris [email protected]
Laure Pasquier-Doumer IEP, DIAL, Paris [email protected] Constance Torelli
INSEE, DIAL, Paris [email protected] Document de travail DIAL
Juillet 2006
ABSTRACT
A new analysis of large-sample surveys in five comparable Sub-Saharan African countries allows measuring for the first time inequality of opportunity in Africa, aside inequality of resources and of living standards. We confirm the prevalence of high levels of inequality among the region’s countries. Yet we also find considerable differences in the structures of this inequality. Furthermore, intergenerational educational and occupational mobility and the equality of opportunity for income between social origins are quite definitely greater in countries where income inequality is lower, such as Ghana and Uganda, than in higher-inequality countries such as Côte d’Ivoire, Guinea and Madagascar.
Key Words: Income inequality, equality of opportunity, intergenerational mobility, Africa.
RESUME
Une exploitation nouvelle d’enquêtes à large échantillon concernant cinq pays d’Afrique subsaharienne permet pour la première fois de mesurer l’inégalité des chances en Afrique, à côté des inégalités de ressources et de conditions de vie. Nous confirmons l’existence d’inégalités prononcées au sein des pays de cette région, mais nous révélons aussi de fortes différences dans les structures de ces inégalités. L’essentiel de ces différences provient des écarts de revenu entre l’agriculture et les autres secteurs, et de l’échelle des rémunérations non agricoles. Au Ghana ou en Ouganda, la mobilité intergénérationnelle scolaire et professionnelle et l’égalité des chances devant le revenu entre les différentes origines sociales sont nettement plus fortes que dans les pays plus inégalitaires que sont la Côte d’Ivoire, la Guinée et Madagascar.
Mots-clefs : Inégalités de revenu, Égalité des chances, Mobilité intergénérationnelle, Afrique. JEL Code : D31, D63, J62, O15.
1 This research received funding from the Agence Française de Développement (AFD) Research Department. We would like to thank
Contents
INTRODUCTION ... 5
1. The level of resource inequalities ... 7
1.1.Income inequalities ... 7
1.2.Land inequalities... 10
1.3.Inequalities in education ... 10
2. Income inequalities among social groups ... 12
2.1.Income dualism between agriculture and other sectors ... 12
2.2.Inequalities between agricultural households ... 14
2.3.Inequalities between non-agricultural households ... 16
3. Inequality of intergenerational opportunity ... 19
3.1.Educational and occupational mobility between generations... 19
3.2.Inequality of opportunity for income... 21
3.3.Inequalities in primary schooling between children of school age ... 24
3.4.Inequality of nutrition among preschool-age children ... 26
CONCLUSIONS... 28
REFERENCES ... 30
APPENDICES ... 32
Appendix 1 : Description of the surveys used ... 32
Appendix 2 : Sensitivity of inequality levels to the equivalence scale ... 33
Appendix 3 : Sensitivity of inequality levels to regional price differentials ... 33
Appendix 4 : Matrices of intergenerational educational mobility... 34
Appendix 5 : Matrices of intergenerational occupational mobility... 35
Appendix 6 : A simple decomposition of cross-sectional and longitudinal income inequalities ... 36
List of tables
Table 1 : Income inequalities worldwide ... 7Table 2 : Consumption and income inequalities in five countries around 1990 ... 8
Table 3 : Income inequalities: sampling and measurement errors ... 9
Table 4 : Inequalities in land distribution... 10
Table 5 : Land inequalities in five countries around 1990 ... 10
Table 6 : Inequalities in years of schooling worldwide ... 11
Table 7 : Inequalities in years of schooling in five African countries around 1990 and 2000 ... 11
Table 8 : Per capita income inequalities between agricultural and other households ... 13
Table 9 : Decomposition of the Gini index by sources of income (per capita household income)... 14
Table 11 : Decomposition of non-agricultural income inequalities (per capita) by head of household’s
occupation ... 17
Table 12 : Wage inequalities and returns to education ... 18
Table 13 : Decomposition of income inequalities by head of household’s occupation... 18
Table 14 : Intergenerational odds ratios ... 20
Table 15 : Decomposition of per capita income inequalities between men aged 22 and over: the role of educational mobility and occupational mobility... 22
Table 16 : Decomposition of per capita income inequalities between men aged 22 and over: access to detailed social groups... 22
Table 17 : Decomposition of per capita income inequalities between men aged 22 and over: the role of geographic mobility ... 23
Table 18 : Adult per capita income inequalities by cohort ... 24
Table 19 : Probability of school attendance before nine years old by gender, parental resources and place of residence ... 25
Table 20 : Per capita consumption inequalities among young children ... 26
Table 21 : Malnutrition indicators in five African countries around the 1990s... 27
Table A2 1 : Gini index of household income per equivalent adult... 33
Table A2 2 : Indices of inequalities of income deflated by a regional price level index ... 33
List of figures
Figure 1 : Differences between the Lorenz curves of per capita income ... 9Figure 2 : Répartition de la population par niveau d’éducation ... 12
Figure 3 : Density of probability of schooling as predicted by the origin variables... 26
Figure 4 : Pen’s parade of standardised height... 28
INTRODUCTION
The first compilation of international income inequality statistics covering a significant number of Sub-Saharan African countries was published ten years ago. It showed this subcontinent to be essentially as inegalitarian as Latin America, a region long known to have a high level of inequality (Deininger and Squire, 1996). However, misgivings about household survey quality mean that the idea of a high-inequality Africa is still subject to caution, aside from in the specific cases of South Africa and Zimbabwe (former Southern Rhodesia) where apartheid has long made for a glaring level of inequality. The historical models used to understand the formation of inequalities in Latin America and the Caribbean can, to a certain extent, be transposed to these two countries. Yet in the rest of Africa where European settlement was less extensive – with the exception of the intermediate cases of Angola and Kenya – there is still little understanding of why inequality should be greater than in South Asia and South-East Asia where European colonisation often lasted at least as long and bore the same features, especially in terms of extracting natural resources and tax revenues. The fact that there is no immediate explanatory model also makes it fairly hard to accept the idea of a high-inequality Africa. Another widely held belief is that African societies tend towards informal solidarity within large groups, which can fill the gap in the absence of State redistribution.
The paper sets out to make a detailed analysis of five of these societies, focusing on inequalities of income and other resources required for economic activity such as land, education and health. The aim of this essentially descriptive exercise is to make a certain number of observations regarding the level and structures of the inequalities. It is innovative in that it makes the first ever comparative and controlled measurement of the extent of the intergenerational transmission of resources and its contribution to the observed inequalities. This was made possible by having large-sample surveys covering a wide range of variables providing information on the social origins of the individuals interviewed: parents’ education and occupation and place of birth. This angle on inequalities dictated the countries and surveys chosen since, to our knowledge, very few representative national surveys contain this type of information. Furthermore, these data are old in that they respect the format of the “integrated” surveys, to use the terminology of the World Bank statisticians who designed the Living Standard Measurement Surveys system. Surveys with smaller questionnaires have since been preferred for reasons of cost and feasibility. We hence decided to use five surveys covering a period ranging from the mid-1980s (1985-1988 for the four Côte d’Ivoire surveys) to the mid-1990s (1994 for the most recent survey on Guinea). There is nothing wrong with analysing these fairly old surveys in that we are considering here the long-term structures of inequality rather than their short-term determinants, placing the emphasis on factors of intergenerational persistence in particular. Moreover, all five countries selected following our data search present interesting properties from the point of view of this work. The countries in question are Côte d’Ivoire from 1985 to 1988, Ghana in 1987, Guinea in 1994, Madagascar in 1993 and Uganda in 1992. These countries have certain characteristics in common: they are of average size2, do not have large mining resources and make most of their income from agricultural exports. However, the main features of the five countries’ colonial and post-colonial histories are quite different. Three were colonised by the French and two by the British in the late 19th century. However, the three former French colonies took different roads following independence. Côte d’Ivoire remained in the bosom of the franc zone and established itself as the main partner of the former colonial power in Africa. Guinea, on the other hand, chose to break with the past and introduce a form of socialist government. Madagascar, also outside the franc zone and its macroeconomic constraints, displayed a combination of the two ways of doing things: with initially close ties with the former coloniser followed by a break and a socialist-based government from 1975 through to the early 1990s. Ghana and Uganda had turbulent histories with political conflicts and severe macroeconomic crises through to the mid-1980s. Yet they share with Madagascar the fact that they are built on the foundations of the pre-colonial kingdoms (Ashanti, Buganda and Imerina).
The outline and main findings of this paper are as follow.
2 In 1985-1988, Côte d’Ivoire had approximately 10 million inhabitants, Ghana had 14 million in 1987-1988, Guinea 6 million in 1994, Madagascar 12 million in 1993 and Uganda 18 million in 1992. The countries’ surface areas are respectively 325, 239, 246, 587 and 241 thousand km².
The first section takes a snapshot of the level of inequalities in the five countries and compares this with international statistics on inequality taken from the World Bank’s 2006 report on equity (World Bank, 2005). The variables we use for the five countries are all meticulously reconstructed from the raw survey data using a uniform methodology for ease of comparison. They show that the main stylised facts established by the international statistics for Africa as a whole are consistent with the findings obtained for the five countries studied here. Africa has a high level of income inequality comparable with that of the Latin American countries. However, the level of land inequality is low and similar to that found in the low-inequality Asian countries. Lastly, Africa’s educational inequalities are the highest in the world, even though they are only slightly higher than in South Asia. The many robustness tests conducted show that, of the five countries studied, Ghana has by far the lowest income inequality while Guinea has the highest inequality. Uganda comes in second place in the ranking of the five countries. The two former British colonies therefore appear to have lower levels of inequality than the three former French colonies, for the periods studied.
The second section confirms and rounds out these findings with a study of cross-sectional inequalities between the main social groups defined by economic activity. This study reveals the crucial role played by income dualism between agriculture and the other sectors. However, in keeping with the land inequality finding, there is barely any difference between the countries when it comes to inequalities within the agricultural sector. Lastly, in the non-agricultural sector, earnings differentials between occupational categories and returns to education in wage-earning activities are higher in the former French colonies. Hence the dualism of income between agriculture and the other sectors and the spread of the non-agricultural wage scale would seem to suffice to explain the main differences between the five countries analysed. Ghana stands out for a particularly small spread of wages across all activities while its neighbour, Côte d’Ivoire, has the largest spread.
The third section looks at longitudinal inequalities between adults and children. For the adults, it presents measurements of the extent of educational and occupational mobility from generation to generation and indicators of the inequality of opportunity for income for the five countries. It shows that the countries with the lowest cross-sectional income inequalities, Ghana and Uganda, have the most fluid intergenerational mobility and the lowest income inequalities between individuals of different social origins. Inequality of economic opportunity is much more significant in the former French colonies, especially among the generations born after independence. Madagascar displays the highest level of persistent positions with the longest-standing social rigidity from this point of view. Turning to the children, we analyse educational inequalities before the age of nine based on the child’s gender, parental resources and place of residence. Madagascar and especially Guinea stand out from the other three countries for their huge disparities in educational opportunities. Last but not least, malnutrition inequalities are identified as being particularly high in Madagascar.
1. THE LEVEL OF RESOURCE INEQUALITIES
This section presents the level of income, land and educational inequalities in the five African countries studied by placing them in the broader context of international inequality statistics.
1.1. Income inequalities
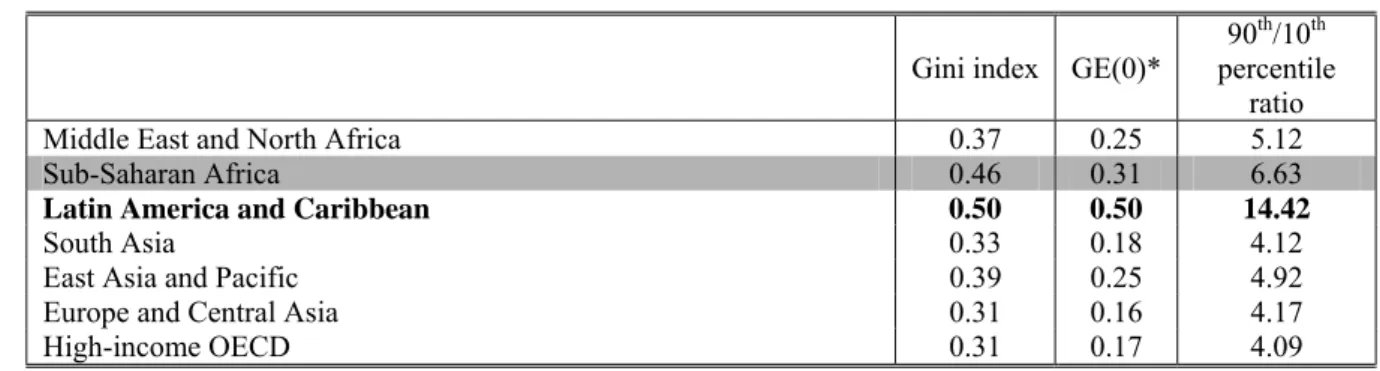
The international statistics show Sub-Saharan Africa to be the subcontinent with the highest income inequalities, behind Latin America and the Caribbean (Table 1)3.
Table 1 : Income inequalities worldwide
Gini index GE(0)*
90th/10th percentile
ratio
Middle East and North Africa 0.37 0.25 5.12
Sub-Saharan Africa 0.46 0.31 6.63
Latin America and Caribbean 0.50 0.50 14.42
South Asia 0.33 0.18 4.12
East Asia and Pacific 0.39 0.25 4.92
Europe and Central Asia 0.31 0.16 4.17
High-income OECD 0.31 0.17 4.09
Source : World Bank, 2005.
Note : Samples vary by country depending on the column; per capita income or consumption inequality. Méthode: Regional means unweighted by the countries’ population.
* : Mean log deviation.
We focus here on five Sub-Saharan African countries for which we have representative national surveys with large household samples covering dates around 1990 (see the introduction and Appendix 1). A common variable construction methodology is used to make more controlled comparisons than those using the international databases4.
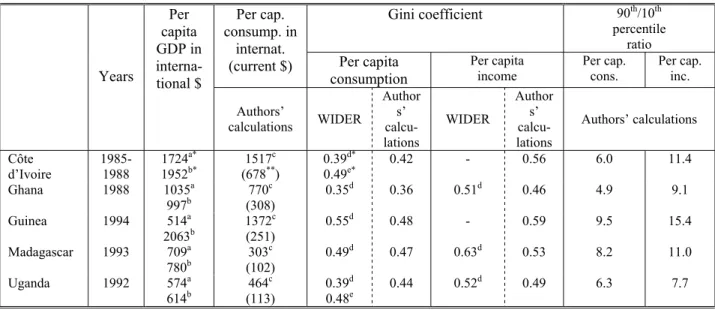
Table 2 compares the results of our calculations with the Gini consumption and income inequality coefficients given in the United Nations WIDER database for the same surveys.5. This comparison
highlights just how sensitive the findings are to the methodologies used to construct the variables. In the WIDER database, two different sources can give two extremely different levels of inequality even though they use the same concepts and the same basic data.6. It is reassuring to see that our
calculations fall consistently between the WIDER estimates. The main instance of marked divergence between the WIDER data and our calculations concerns income inequalities in Madagascar, where 0.10 Gini coefficient points separate the two estimates.
3 International statistics base most of the estimates for Africa on per capita consumption while most of the estimates for Latin America are
based on per capita income. Table 1 does not take this difference into account and therefore overestimates the deviation between the two subcontinents.
4 Appendices not included in this short version of the paper explain the choices made to construct the consumption and income variables.
They are available from the authors.
5 Table 2 shows first of all that the per capita consumption aggregates derived from our analysis of the surveys rank the five countries in
the same order as the average of the estimates available for per capita GDP, regardless of whether these aggregates are converted into current dollars for the year in question or into international dollars. Côte d’Ivoire shows up as the richest country from 1985 to 1988, followed by Ghana, Guinea, Uganda and Madagascar. The available estimates of per capita GDP in international dollars are the most uncertain for Guinea due mainly to the uncertainty of price collection. Note that the purchasing power parity exchange rate for 1994 is very low in the Penn World Tables 6.1, where it is valued at just 18% of the official exchange rate.
Table 2 : Consumption and income inequalities in five countries around 1990 Gini coefficient 90th/10th percentile ratio Per cap. consump. in internat.
(current $) Per capita consumption
Per capita
income Per cap. cons. Per cap. inc.
Years Per capita GDP in interna-tional $ Authors’ calculations WIDER Author s’ calcu-lations WIDER Author s’ calcu-lations Authors’ calculations Côte d’Ivoire 1985-1988 1724 a* 1952b* 1517 c (678**) 0.39 d* 0.49e* 0.42 - 0.56 6.0 11.4 Ghana 1988 1035a 997b 770 c (308) 0.35 d 0.36 0.51d 0.46 4.9 9.1 Guinea 1994 514a 2063b 1372c (251) 0.55d 0.48 - 0.59 9.5 15.4 Madagascar 1993 709a 780b 303 c (102) 0.49d 0.47 0.63d 0.53 8.2 11.0 Uganda 1992 574a 614b 464 c (113) 0.39d 0.48e 0.44 0.52 d 0.49 6.3 7.7
Sources: a: source Maddison, OECD 2003. b: source Penn World Tables 6.1.
c: source Penn World Tables 6.1: PPP level of consumption for the reference year. d: source WIDER/UN (quality rating 1 or 2) & Deininger & Squire, World Bank 2004. e: source WIDER/UN (quality rating 1 or 2) & World Bank Poverty Monitoring Database 2002. For the authors’ calculations: large-sample surveys as described in Appendix 1.
*: Four-year average (Côte d’Ivoire)
**: 1988 official exchange rate (the other years are expressed in 1988 CFA francs)
Method: Per capita consumption or income inequalities between individuals (between households weighted by household size). Our consumption aggregate excludes durables and health expenditure. Our income aggregate excludes income from the sale of livestock, durables and real estate.
In any case, the estimates obtained for the five countries confirm the high level of consumption and income inequalities in the Sub-Saharan African countries, even outside the highest-inequality countries such as South Africa and Zimbabwe. The per capita income inequality estimates, which are more comparable with the Latin American data, place Ghana at the average level for Sub-Saharan Africa and the four other countries above this average. Assuming that the measurement error biases are not much greater, the consumption and income inequalities in these five countries come out as being among the highest in the world.7
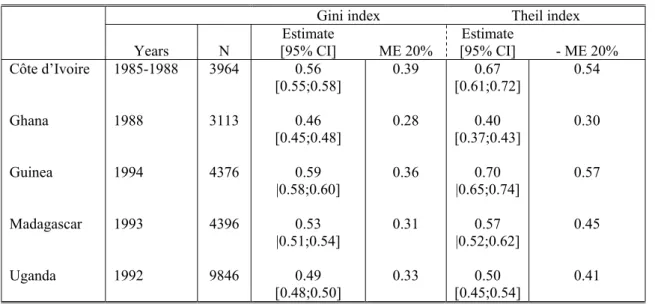
Ghana nevertheless has the lowest income inequalities, followed by Uganda, Madagascar and lastly Côte d’Ivoire and Guinea.8 This ranking is borne out by the Lorenz curves9 and is robust to the
measurement errors (Table 3). Consideration of the demographic structure of the households (equivalence scales, Appendix 2) tends to reveal convergence between the respective positions of Uganda and Madagascar. Lastly, Côte d’Ivoire’s position is fairly sensitive to deviations in regional price levels, and it is ranked closer to Madagascar when this factor is taken into consideration (Appendix 3).
The most robust ranking of the five countries therefore appears to be that which classes Ghana as the lowest-inequality country and Guinea as the highest, with the respective ranks of the other three countries being less robust. The WIDER databases also place Ghana and Guinea at opposite ends of the scale. Between these two extremes, Uganda is found to have the lowest inequality, with a position
7 The microeconomic income and expenditure data are affected by large measurement errors. When these errors are distributed like white
noise, they exaggerate the level of inequality measured. However, other equally valid arguments can explain an underestimation: failing to declare high incomes at their full value, sampling biases at the top and bottom of the distribution, absence of expatriates, etc. See S. Mesplé-Somps and C. Guénard (2004) for a detailed study of the cases of Côte d’Ivoire and Madagascar.
8 A similar ranking is found for consumption inequalities, excepting Côte d’Ivoire, which comes out as more egalitarian from this point of
view. Being the richest country of the five studied, especially during these relatively buoyant years (1985-1988), it is understandable that its savings rate should be both higher and rise in keeping with income. Moreover, our definition of consumption is limited to the satisfaction of current needs (excluding spending on health and durables).
closer to Ghana, while Madagascar is closer to Guinea. Côte d’Ivoire is the most ambiguous case, with consumption inequalities nearing those of Ghana and income inequalities similar to Guinea.
Figure 1 : Differences between the Lorenz curves of per capita income
-. 1 5 -. 1 -. 0 5 0 C u mu la ti ve i n co me d if fe re n ce (% ) 0 .2 .4 .6 .8 1
Population ranked by per capita income
Côte d'Ivoire - Ghana Guinea - Ghana
Madagascar - Ghana Uganda - Ghana
Note : The Lorenz curve for Ghana is taken as the reference
Table 3 : Income inequalities: sampling and measurement errors
Gini index Theil index
Years N [95% CI] Estimate ME 20% [95% CI] Estimate - ME 20%
Côte d’Ivoire 1985-1988 3964 0.56 [0.55;0.58] 0.39 0.67 [0.61;0.72] 0.54 Ghana 1988 3113 0.46 [0.45;0.48] 0.28 0.40 [0.37;0.43] 0.30 Guinea 1994 4376 0.59 |0.58;0.60] 0.36 0.70 |0.65;0.74] 0.57 Madagascar 1993 4396 0.53 |0.51;0.54] 0.31 0.57 |0.52;0.62] 0.45 Uganda 1992 9846 0.49 [0.48;0.50] 0.33 0.50 [0.45;0.54] 0.41 In square brackets: 95% confidence intervals obtained with 100 bootstrap replications.
ME 20%: Index corrected by the influence of white noise measurement errors representing 20% of the total variance, approximations by Chesher and Schluter (2002).
1.2. Land inequalities
A great deal has been written about the structures of inequality in Latin America10. One of the basic
characteristics brought up in this regard is the extent of the inequality of land distribution (Table 4). This characteristic is also found in the highest-inequality countries of Africa: South Africa, Zimbabwe and even Kenya. The international data show that, aside from in these three countries, land distribution inequality is no greater in Africa than in Asia.
Table 4 : Inequalities in land distribution
Gini coefficient of land distribution
Middle East and North Africa 0.67
Sub-Saharan Africa 0.56
Latin America and Caribbean 0.78
South Asia 0.58
East Asia and Pacific 0.51
Europe and Central Asia 0.74
High-income OECD 0.57
Method: national means unweighted by the population.
Source: World Bank 2005 supplemented by Deininger & Olinto 2000.
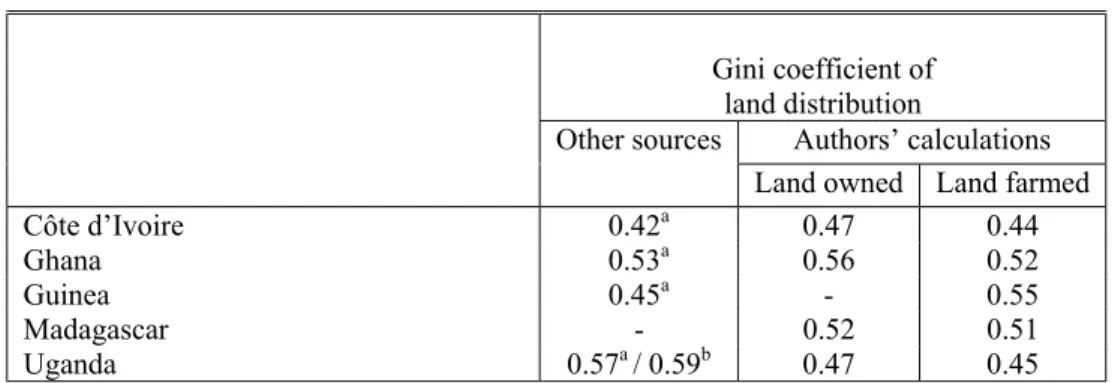
Our own calculations confirm the relatively low level of land distribution inequalities (Table 5). We feel that the quality of the data on land plot surface areas is inadequate for a detailed ranking of land distribution inequalities between the countries.
Table 5 : Land inequalities in five countries around 1990
Gini coefficient of land distribution
Other sources Authors’ calculations
Land owned Land farmed
Côte d’Ivoire 0.42a 0.47 0.44
Ghana 0.53a 0.56 0.52
Guinea 0.45a - 0.55
Madagascar - 0.52 0.51
Uganda 0.57a / 0.59b 0.47 0.45
a: source Deininger & Olinto (2000): Côte d’Ivoire 1974, Madagascar 1960, Uganda 1963 b: source World Bank 2005, for 1991
c: source Frankema (2005), various years
1.3. Inequalities in education
However, Sub-Saharan Africa does emerge as the subcontinent with the highest quantitative inequalities in education, alongside South Asia (Table 6). We know this characteristic to be more or less directly related to average educational development, illustrated here by the mean years of schooling received by the working-age population.
Table 6 : Inequalities in years of schooling worldwide
Mean years
of schooling coefficient Gini
Middle East and North Africa 5.9 0.55
Sub-Saharan Africa 4.3 0.59
Latin America and Caribbean 7.8 0.34
South Asia 4.8 0.57
East Asia and Pacific 6.2 0.41
Europe and Central Asia 10.5 0.19
High-income OECD 11.5 0.17
Coverage: “Population that probably completed their schooling” Method: National means unweighted by the population Source: 2006 World Development Report
Here again, our calculations for the five countries confirm this diagnosis (Table 7).11 At the same time,
they find a great deal of diversity across the five countries. Guinea in 1994 was the least advanced in terms of schooling, but also had the most uneven distribution of years of schooling. Côte d’Ivoire in the late 1980s is just behind Guinea from these two points of view. Ghana in 1988, Madagascar in 1993 and Uganda in 1992 are closer to the continental mean. Schooling in these countries is both broader based and better distributed.
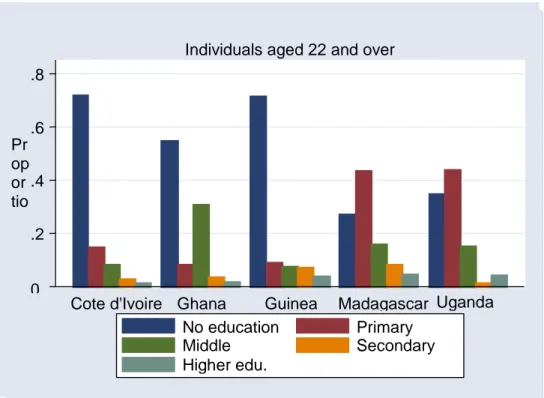
Figure 2 shows the breakdown of the population aged 22 and over by level of education in the five countries covered by the study. Each level corresponds to the school level attained in terms of the last year of schooling successfully completed. The countries divide clearly into two groups: Côte d’Ivoire and Guinea have an extremely high proportion (over 70%) of uneducated individuals. At the other end of the scale, Madagascar and Uganda have much higher levels of education. The same trend can be observed from the breakdown by gender and by area of residence.
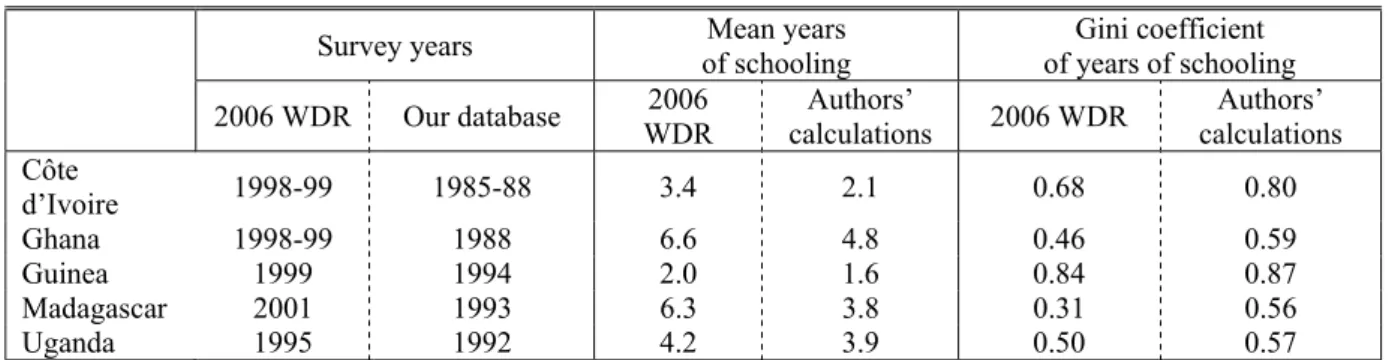
Table 7 : Inequalities in years of schooling in five African countries around 1990 and 2000
Survey years of schooling Mean years of years of schooling Gini coefficient 2006 WDR Our database WDR 2006 calculations Authors’ 2006 WDR calculations Authors’ Côte d’Ivoire 1998-99 1985-88 3.4 2.1 0.68 0.80 Ghana 1998-99 1988 6.6 4.8 0.46 0.59 Guinea 1999 1994 2.0 1.6 0.84 0.87 Madagascar 2001 1993 6.3 3.8 0.31 0.56 Uganda 1995 1992 4.2 3.9 0.50 0.57 Coverage: Population that probably completed their schooling (2006 WDR), population aged 22 and over (authors’ calculations).
11 However, it is hard to compare the 2006 WDR data with our calculations for different years. This comparison appears to suggest that
Ghana and Madagascar made considerable progress with education in the 1990s. Care should be taken with the Madagascan data: see D. Cogneau et al., 2003. The developments observed in Ghana from 1988 to 1992 are not really compatible with the high level found in 1999.
Figure 2 : Breakdown of the population by levels of education 0 .2 .4 .6 .8
Cote d'Ivoire Ghana Guinea Madagascar Uganda Pr
op or tio
Individuals aged 22 and over
No education Primary
Middle Secondary
Higher edu.
Ghana is in an intermediate position. Compared with Madagascar and Uganda, it has a higher proportion (approximately 55%) of individuals who never attended primary school. However, most of those with schooling did reach middle school level, which is more like an upper primary level in this case. In fact, for the generations concerned, the Ghanaian education system offered much longer schooling than elsewhere based on the “6-4-5-2” format: six years in primary school, four in middle school, five years in secondary school and two pre-university years (lower sixth and upper sixth). Individuals could pass an exam to go directly from primary to secondary school, cutting out middle school. However, since primary school had no system of repeating a failed year, half of the individuals (those who had at least reached middle school) had at least completed these six years of schooling. Most of the other half had never attended school, with only a small minority having left school at primary level. This system was reformed in 1987 and changed to the “6-3-3” format. In Madagascar and Uganda, however, two-thirds of individuals aged 22 and over had successfully completed one year of primary education, but very few had completed all five (Madagascar, “5-4-3”) or seven (Uganda, “7-4-2”) years of this level.
Obviously, these differences in the spread and breakdown of the number of years of schooling say nothing about the quality of the education received.
2. INCOME INEQUALITIES AMONG SOCIAL GROUPS
This section studies cross-sectional income inequalities within and between major social groups: between farmers and non-farmers, within the agricultural category, and between non-agricultural groups. It uses the classic decomposition of Theil’s index into between-group and within-group components. It also uses the breakdown of the Gini index by income sources introduced by Pyatt et al. (1980).
2.1. Income dualism between agriculture and other sectors
Agriculture accounts for over half of all employment in Sub-Saharan Africa. As regards our five countries, 56% of the population in Côte d’Ivoire live in a household whose head is a farmer, 59% in Ghana, 62% in Guinea and over 70% in Madagascar and Uganda (Table 8). Per capita income differentials between agricultural and non-agricultural households, as defined by the head of
household’s main occupation, are particular disparate. They constitute a strong explanatory factor for the level of total inequalities, in keeping with the finding put forward by Bourguignon and Morrisson (1998) based on international data. The countries fall into the same ranking by both level of income inequalities and level of dualism: Ghana, Uganda, Madagascar, Côte d’Ivoire and Guinea.
Income dualism is virtually nonexistent in Ghana: per capita income in non-agricultural households is just 11% higher than in agricultural households. At the other end of the scale, the average per capita income of non-agricultural households in Guinea is 3.6 times higher than the average income of agricultural households. For Guinea, this average income deviation alone explains 28% of the Theil index of income inequality. In Côte d’Ivoire, the income ratio is 2.4 and 15% of the Theil index of income inequality is due to between-group inequality. Madagascar and Uganda present similar figures. Table 8 :
Per capita income inequalities between agricultural and other households
Main occupation of head of household
Côte
d'Ivoire Ghana Guinea
Madagas
car Uganda Proportion of the population (%)
Agricultural 57 59 62 75 70
Non agricultural* 43 41 38 25 30
Av. income/Av. agri. income (%)
Agricultural 100 100 100 100 100
Non agricultural* 244 111 360 209 166
S
Gini income coefficient 0.56 0.46 0.59 0.53 0.49
Agricultural 0.41 0.45 0.48 0.49 0.46
Non agricultural* 0.59 0.48 0.53 0.52 0.50
Decomposition of the Theil index of
income 0.67 0.40 0.70 0.57 0.50
Theil agri./non agri. (%) 15 3 28 11 6
Coverage: The entire household population
*: Including households whose head is out of the labour force
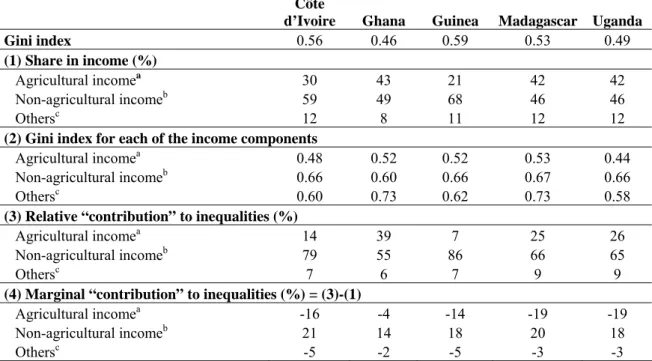
Another way of addressing income dualism is to break down income inequalities by source, differentiating for each household the income from agricultural activities, the income from non-agricultural activities and other unearned income (Table 9). This type of breakdown avoids the assumption that households have just one activity, which is implicit when individuals are ranked by the head of household’s main occupation.
Agricultural income represents the largest proportion of all income (43%) in Ghana. Conversely, it accounts for the smallest share of total income (21%) in Guinea. In Madagascar and Uganda, which both have the same high proportion of farmers in the total population, agricultural income makes up approximately 40% of disposable income. Lastly, agricultural income in Côte d’Ivoire accounts for just one-third of all income (part (1) of Table 9).
In general, agricultural income inequalities are smaller than non-agricultural income inequalities, as can be seen in part (2) of Table 9. Non-agricultural earnings are particularly diverse: they comprise the profits of small and medium-sized enterprises, individual earnings from small informal-sector activities conducted as the main or secondary occupation, and wages earned at various skills levels. This diversity and the correlation with the total income scale give these types of earnings the property of dispersing the income scale while the other sources tend to concentrate it. The marginal contribution presented in part (4) of the table expresses this property: it corresponds to the relative
effect of a marginal increase in income from each source on the Gini index.12 A 1% increase in agricultural income would reduce the Gini index by –0.4% to –0.19% while a 1% increase in non-agricultural income would have an inegalitarian effect of between 0.14% and 0.21%. The differences between the marginal contributions of each source of income are obviously the smallest in Ghana, where dualism is less significant.
Table 9 :
Decomposition of the Gini index by sources of income (per capita household
income)
Côte
d’Ivoire Ghana Guinea Madagascar Uganda
Gini index 0.56 0.46 0.59 0.53 0.49
(1) Share in income (%)
Agricultural incomea 30 43 21 42 42
Non-agricultural incomeb 59 49 68 46 46
Othersc 12 8 11 12 12
(2) Gini index for each of the income components
Agricultural incomea 0.48 0.52 0.52 0.53 0.44
Non-agricultural incomeb 0.66 0.60 0.66 0.67 0.66
Othersc 0.60 0.73 0.62 0.73 0.58
(3) Relative “contribution” to inequalities (%)
Agricultural incomea 14 39 7 25 26
Non-agricultural incomeb 79 55 86 66 65
Othersc 7 6 7 9 9
(4) Marginal “contribution” to inequalities (%) = (3)-(1)
Agricultural incomea -16 -4 -14 -19 -19
Non-agricultural incomeb 21 14 18 20 18
Othersc -5 -2 -5 -3 -3
Coverage: Households.
a: Including for own consumption of agricultural produce (excluding livestock).
b: Earnings of wage-earners, self-employed professionals, home helps, independent workers and entrepreneurs whether as main or secondary activities.
c: The “others” row is made up of private and public transfers (including educational grants) and imputed rents ascribed to housing owners.
A good part of the difference between Ghana and the other countries is therefore due to the low level of dualism between farmers and non-farmers observed in the country in 1987-1988.
The rest of this section looks at inequalities between agricultural households and within non-agricultural households in an attempt to find other explanatory factors for the differences in inequality levels found so far.
2.2. Inequalities between agricultural households
In all the countries, income inequalities between agricultural households are lower than the inequalities found between the other households. Moreover, the differences between the five countries are relatively minor from this point of view (Table 8). Madagascar and Guinea appear to have the highest inequalities within the agricultural sector (Gini coefficient of 0.49).
12 Insofar as this increase is small enough not to give rise to a re-ranking of the households and therefore a change of correlation coefficient
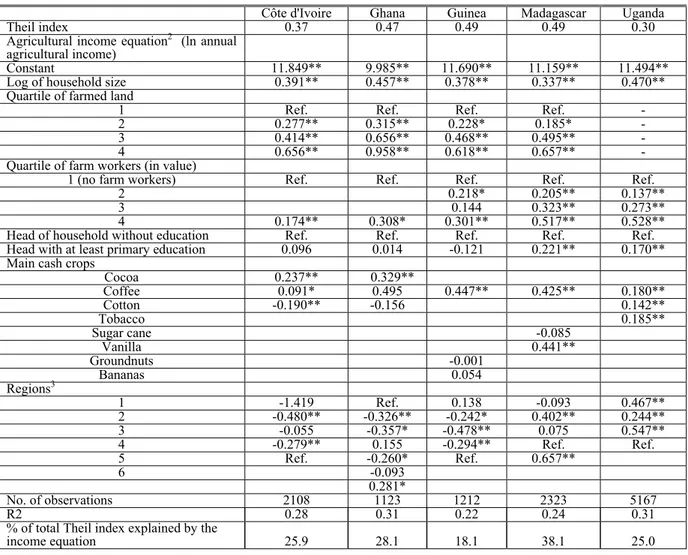
A simple equation is estimated to endeavour to explain the agricultural income logarithm by available manpower, area of land farmed, working capital, the head of household’s level of education, specialisation in certain export crops, and a series of regional dummy variables (Table 10).
Table 10 :
Agricultural income inequalities by household
Côte d'Ivoire Ghana Guinea Madagascar Uganda
Theil index 0.37 0.47 0.49 0.49 0.30
Agricultural income equation2 (ln annual agricultural income)
Constant 11.849** 9.985** 11.690** 11.159** 11.494**
Log of household size 0.391** 0.457** 0.378** 0.337** 0.470**
Quartile of farmed land
1 Ref. Ref. Ref. Ref. -
2 0.277** 0.315** 0.228* 0.185* -
3 0.414** 0.656** 0.468** 0.495** -
4 0.656** 0.958** 0.618** 0.657** -
Quartile of farm workers (in value)
1 (no farm workers) Ref. Ref. Ref. Ref. Ref.
2 0.218* 0.205** 0.137**
3 0.144 0.323** 0.273**
4 0.174** 0.308* 0.301** 0.517** 0.528**
Head of household without education Ref. Ref. Ref. Ref. Ref.
Head with at least primary education 0.096 0.014 -0.121 0.221** 0.170**
Main cash crops
Cocoa 0.237** 0.329** Coffee 0.091* 0.495 0.447** 0.425** 0.180** Cotton -0.190** -0.156 0.142** Tobacco 0.185** Sugar cane -0.085 Vanilla 0.441** Groundnuts -0.001 Bananas 0.054 Regions3 1 -1.419 Ref. 0.138 -0.093 0.467** 2 -0.480** -0.326** -0.242* 0.402** 0.244** 3 -0.055 -0.357* -0.478** 0.075 0.547** 4 -0.279** 0.155 -0.294** Ref. Ref. 5 Ref. -0.260* Ref. 0.657** 6 -0.093 0.281* No. of observations 2108 1123 1212 2323 5167 R2 0.28 0.31 0.22 0.24 0.31
% of total Theil index explained by the
income equation 25.9 28.1 18.1 38.1 25.0
* significatif à 5 %; ** significatif à 1 %.
1. Champ : ménages dont l’activité principale du chef de ménage est l’agriculture. 2 .Revenus agricoles = vente de produits agricoles + autoconsommation 3. Définitions des régions :
Côte d’Ivoire Ghana Guinea Madagascar Uganda
1 Abidjan Western Conakry Antananarivo Central
2 Other towns Central Lower Guinea West coast West
3 Eastern forest Accra Middle Guinea East coast East
4 Western forest Eastern Upper Guinea South central North
5 Savannah Volta Forest South coast
6 Ashanti North coast
The estimation shows that farm size differentials (land area and available manpower) alone account for over 50% of the variance explained by these six variables13. The number of agricultural workers
adds its effect to these size differentials.
The head of household’s level of education only has a significant impact on agricultural productivity in Madagascar and Uganda, where it remains nonetheless limited. Approximately two-thirds of the
13 This variable could not be included in the agricultural earnings equation for Uganda, since farmed surface areas in this country are only
agricultural heads of household had been to school in these two countries, as opposed to less than 20% in Côte d’Ivoire and 10% in Guinea. In Ghana, 55% of agricultural heads of household had received schooling, although the level of education does not appear to improve agricultural productivity. As we shall see later, this low return on education in Ghana is not specific to the agricultural sector.
The production of export crops generally generates higher earnings, except in the case of cotton in Côte d’Ivoire and Ghana. The Ugandan cotton farmers appear to be better off, but most of them are in the North where average incomes are by and large lower regardless of whether cotton or solely food crops are grown. Despite the consideration of these elements of specialisation, geographic location still plays a role in the agricultural income disparities observed in each of the countries. Other things being equal, agricultural productivity is lower on the Southern Coast of Madagascar, in the Centre and the North (Volta) of Ghana, and in the North of Uganda. However, the savannah zone of Côte d’Ivoire does not seem to be at any more of a disadvantage aside from the surcharge on cotton production. Yet however interesting the inequalities within the agricultural sector may be per se, this is not where we should look for a source of substantial inequality deviations between the five countries.
2.3. Inequalities between non-agricultural households
As already noted, inequalities within non-agricultural households are higher than within agricultural households in all the countries. Per capita income inequalities appear to be by far the highest in Côte d’Ivoire (Theil coefficient of 0.68), followed by Madagascar, Guinea, Uganda (0.55, 0.54 and 0.53 respectively) and lastly Ghana (0.44) (Table 11). The reason for the high level of income inequalities in Côte d’Ivoire is thought to be, aside from agricultural dualism, high inequalities within the non-agricultural groups. However, it is hard to capture all of this income, especially household earnings from independent activities.14
Measuring inequalities between social groups gives rise to occupation and status classification problems in addition to income measurement difficulties. It hence proved hard to define an entirely satisfactory and homogeneous occupational or status-based ranking of the countries. These classification problems explain part of the differences between countries in the breakdown by occupation of heads of non-agricultural households. Even the division between wage-earners and the self-employed is not easy to make in a uniform manner, especially at the low-skills levels. For example, many manual and non-manual employees receive individualised remuneration and there is no way of knowing for sure whether this is not rather a form of self-employment more comparable with independent workers without employees. Moreover, the definitions of the skills levels for the wage-earning occupations (executives, intermediate professions, non-manual employees and manual employees) are not very sound. Labour force participation rates also vary with, in particular, a high proportion of heads of household declared as being out of the labour force in Guinea (20%) and Côte d’Ivoire (18%).
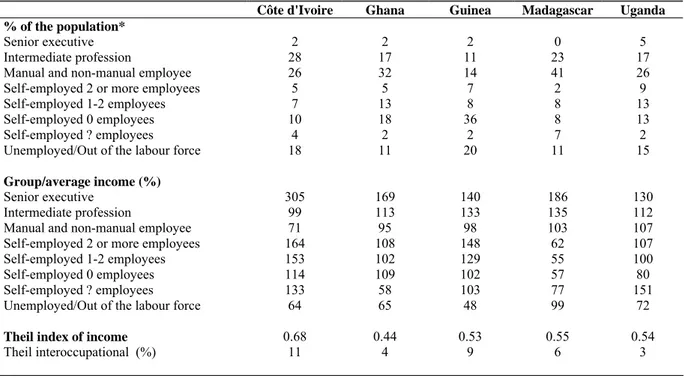
The decomposition of per capita income inequalities by the head of household’s occupation nevertheless finds that Côte d’Ivoire has the widest deviations between social groups (between Theil is 11% of total Theil index). These deviations go a long way to explaining the inequalities outside the agricultural sector in Côte d’Ivoire. Guinea also displays not-inconsiderable deviations beween social groups (9%) .
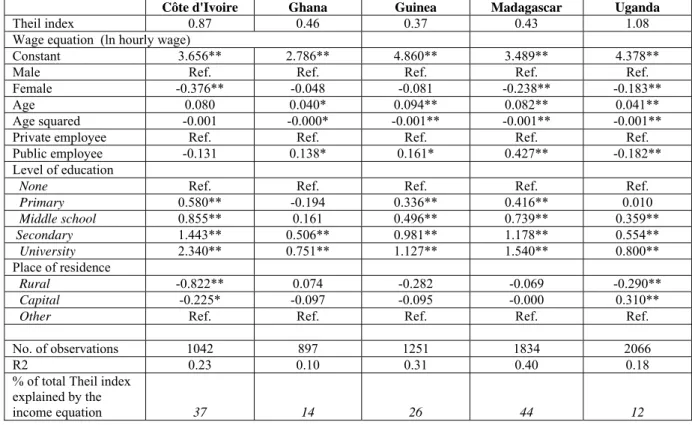
Mincer hourly wage equations were estimated (Table 12) for a more detailed study of wage inequalities. The samples used cover all individuals over 22 years old who declare individualised non-agricultural earnings from their main activity15. Whereas Table 11 presents households’ per capita
earnings, this table analyses individual wage rates.
14 See S. Mesplé-Somps and C. Guénard, 2004. The solution of using the current consumption aggregate to observe these inequalities
partially reduces the measurement errors, but also risks selectively underestimating the level of inequalities for the richer countries such as Côte d’Ivoire.
Table 11 : Decomposition of non-agricultural income inequalities (per capita) by head of household’s occupation
Côte d'Ivoire Ghana Guinea Madagascar Uganda
% of the population*
Senior executive 2 2 2 0 5
Intermediate profession 28 17 11 23 17
Manual and non-manual employee 26 32 14 41 26
Self-employed 2 or more employees 5 5 7 2 9
Self-employed 1-2 employees 7 13 8 8 13
Self-employed 0 employees 10 18 36 8 13
Self-employed ? employees 4 2 2 7 2
Unemployed/Out of the labour force 18 11 20 11 15
Group/average income (%)
Senior executive 305 169 140 186 130
Intermediate profession 99 113 133 135 112
Manual and non-manual employee 71 95 98 103 107
Self-employed 2 or more employees 164 108 148 62 107
Self-employed 1-2 employees 153 102 129 55 100
Self-employed 0 employees 114 109 102 57 80
Self-employed ? employees 133 58 103 77 151
Unemployed/Out of the labour force 64 65 48 99 72
Theil index of income 0.68 0.44 0.53 0.55 0.54
Theil interoccupational (%) 11 4 9 6 3
Coverage: Households whose head is not a farmer.
*: % of individuals whose head of household works in the given occupation
Table 12 shows first of all that it is only in Uganda that, other things being equal, civil servants’ wages are lower than other employees by approximately 20%. In Côte d’Ivoire the differential is not significant. In other countries, civil servants are better paid: They earn about 40% more in Madagascar, as opposed to 14% in Ghana and 18% in Guinea. Moreover, female employees earn lower hourly wages than men in Côte d’Ivoire, Madagascar and Uganda.
Education is the determining variable in the wage scale in each of the countries, although its influence varies widely from country to country. Côte d’Ivoire has the highest returns at all levels. Madagascar follows closely behind with returns to secondary and higher education just below those of Côte d’Ivoire. Guinea comes in third place, with fairly high and significant returns to primary education. Returns to secondary and higher education cannot be accurately estimated in Guinea since too few employees in the sample have a level higher than primary. The estimate made nevertheless suggests that Guinea is also in an intermediate position between Côte d’Ivoire and Madagascar on one side and Uganda and Ghana on the other. However, it is worth noting that Guinea has the highest returns to age. Returns to education appear to be much lower in the two former British colonies than in the former French colonies (see also Cogneau, 2003). Returns to age (experience and seniority) are also lower in the former British colonies.
Note that the same observations hold true when the analysis is limited to public-sector employees.16
This suggests that these wage scale differences are due at least in part to “wage standards” set by the public institutions.
16 Findings not presented, but available on request. Public-sector employees account for 25% to 50% of the total sample of employees,
Table 12 : Wage inequalities and returns to education
Côte d'Ivoire Ghana Guinea Madagascar Uganda
Theil index 0.87 0.46 0.37 0.43 1.08
Wage equation (ln hourly wage)
Constant 3.656** 2.786** 4.860** 3.489** 4.378**
Male Ref. Ref. Ref. Ref. Ref.
Female -0.376** -0.048 -0.081 -0.238** -0.183**
Age 0.080 0.040* 0.094** 0.082** 0.041**
Age squared -0.001 -0.000* -0.001** -0.001** -0.001**
Private employee Ref. Ref. Ref. Ref. Ref.
Public employee -0.131 0.138* 0.161* 0.427** -0.182**
Level of education
None Ref. Ref. Ref. Ref. Ref.
Primary 0.580** -0.194 0.336** 0.416** 0.010 Middle school 0.855** 0.161 0.496** 0.739** 0.359** Secondary 1.443** 0.506** 0.981** 1.178** 0.554** University 2.340** 0.751** 1.127** 1.540** 0.800** Place of residence Rural -0.822** 0.074 -0.282 -0.069 -0.290** Capital -0.225* -0.097 -0.095 -0.000 0.310**
Other Ref. Ref. Ref. Ref. Ref.
No. of observations 1042 897 1251 1834 2066
R2 0.23 0.10 0.31 0.40 0.18
% of total Theil index explained by the
income equation 37 14 26 44 12
* significant at the 5% level; ** significant at the 1% level,
Coverage: Individuals aged 22 and over declaring individualised non-agricultural remuneration for their main activity
These differences in returns to education and experience tally with the previous observation of a more compressed non-agricultural earnings scale in the two former British colonies. In the case of Côte d’Ivoire and Guinea, the higher returns to education combine with particularly pronounced inequalities in the distribution of education (see above, Table 7). These two elements together make for greater inequalities in the non-agricultural sector, especially in Côte d’Ivoire where returns to education are the highest and are not offset, as in Guinea, by high returns to experience and seniority. These agricultural inequalities play an especially important role in Côte d’Ivoire, which has the largest non-agricultural population.
To sum up, and despite the measurement and classification problems mentioned, Ghana continues to stand out from the other countries for its atypical income equality. It has the lowest income deviations between social groups, first and foremost between farmers and farmers, but also between non-agricultural categories. Table 13 sums up the impact of these deviations. It uses a simple reweighting technique to show that the difference between Ghana and the other countries is due to income mean differences, rather than differences in the structure of the population by social groups.
Table 13 : Decomposition of income inequalities by head of household’s occupation
Côte d’Ivoire Ghana Guinea Madagascar Uganda
A: Theil index 0.67 0.40 0.70 0.57 0.50
B: Theil interoccupational (%) 22 2 33 13 7
A-B With Ghana’s structure:*
Theil index 0.68 0.40 0.67 0.60 0.51
Theil interoccupational (%) 23 2 35 14 8
Coverage: Population of households
Note: The occupations defined for this inequality decomposition are the same as in Table 11, plus farmers.
*: Data reweighted such that the composition of the population by head of household’s occupation is the same as in Ghana.
Compared with Ghana, Uganda shows greater income dualism between agriculture and the other sectors, and slightly higher returns to education. Madagascar follows. It is striking to note the strong
similarity between Uganda and Madagascar as regards the weight of agriculture and the distribution of education. However, Madagascar displays slightly higher agricultural dualism, a slightly more unequal distribution of land, and higher returns to education. These three factors are probably behind the ranking of Madagascar above Uganda in terms of inequalities.
The two former French colonies of West Africa are similar even though their post-colonial histories are different. Both have large income differentials separating the social groups. And both have a high level of dualism and low educational development generating high educational inequalities. Dualism plays a decisive role in Guinea, where the ratio of agricultural to non-agricultural income is nearly one to four and where agricultural employment is slightly higher. It alone accounts for 28% of the per capita income inequalities. However, inequalities between non-agricultural social groups are less marked in Guinea than in Côte d’Ivoire. Given that the urban economy in Guinea is largely informal, educational inequalities and returns to education play a relatively smaller role than in Côte d’Ivoire. This latter country combines strong dualism to the detriment of agriculture with high social group inequalities in the non-agricultural world, which are closely connected with the decisive role of education in this country sometimes called the “republic of good students”.
Last but not least, it is striking to see the extent to which remuneration schedules differ between Côte d’Ivoire and its neighbour Ghana, whereas employment structures and standards of living are very similar. This striking contrast between the two countries had been already noted by Glewwe and Twum-Baah (1991).
3. INEQUALITY OF INTERGENERATIONAL OPPORTUNITY
This section compares the cross-sectional income inequalities studied above with longitudinal inequalities due to intergenerational mobility. It first presents the intergenerational school and occupational mobility differences between the five countries. It then uses the Theil index of income decompositions again, evaluating the respective weight of inequalities between social groups and longitudinal inequalities between social origins. These latter inequalities reflect the inequality of opportunity for income due to different probabilities of access to social positions (social mobility) and a direct effect of social origins (schooling, geographic and professional) on individuals’ incomes (see Appendix 5). The section ends with a look at educational and nutritional inequalities among young children.
3.1. Educational and occupational mobility between generations
The five surveys selected allow for a study of the extent to which certain differences in social position are reproduced between parents and their children.
The surveys are used to construct intergenerational educational mobility tables comparing the level of education attained by the father (or mother) with the level of education attained by their adult children (see Appendix 4). As our aim is to differentiate between gender-based inequalities and inequalities due purely to the intergenerational transmission of educational resources, we first of all restrict our analysis to men aged 22 and over and their fathers17.
Table 14 presents a certain number of indicators of the association between the father’s level and the son’s level at different stages of the education system. As is customary in the quantitative analysis of intergenerational mobility, we compare the strength of this association between countries, disregarding the fact that certain countries have made a great deal of progress with education while others have advanced more slowly. For example, the breakdown of fathers by level of education is very similar in Côte d’Ivoire and Guinea: the overwhelming majority did receive any schooling at all.18 Conversely,
17 Bear in mind that the age-based selection implies that a large proportion of the educational mobilities observed occurred in each of the
countries during the colonial period, especially where the surveys analysed are old (Côte d’Ivoire and Ghana).
18 Note, nevertheless, that the father’s level of education in Côte d’Ivoire could only be coded based on the last qualification obtained,
39% of the sons attended at least primary school in Côte d’Ivoire compared with just 23% of the sons in Guinea.
We calculate odds-ratio coefficients to eliminate this “structural mobility” factor. These coefficients compare the probabilities of access to the same level of education for two sons with different educational origins (see also the note in Table 14). This exercise shows that the inequality of opportunity for schooling alone is higher in Côte d’Ivoire than in Guinea, even though the statistical confidence intervals for the two odds ratios are not completely clear-cut due to the small number of fathers who attended school in the two countries. The other three countries, where primary education is much more widespread in the rural areas, display less discrimination in access to schooling. Nevertheless, it is worth noting that Ghana in 1988 shows no more inequality from this point of view than Madagascar, even though primary schooling in this country is less frequent.
Uganda in 1992 had the most advanced level of “democratisation” of access to school, although a ratio of 1 to 7 still separated the sons of educated fathers from the sons of uneducated fathers, for access to school alone. In 1992, there were still 23% of Ugandan men born before 1970 who had never been to school, and 70% of these had a father who had never attended school either (see Appendix 4).
The second column of Table 14 presents the odds ratios observed for sons who received primary schooling and the odds of reaching “collège”, as middle school is known in French, in the former French colonies and middle school in the former British colonies. To make the odds ratios studied more pertinent, and improve their statistical accuracy, the odds for the son of a father who went to school were compared with the odds for the son of a father who did not attend school. Similarly, the third column compares the odds of attending secondary school for the son of a father who attended at least middle school with the son of a father who did not go any further than primary school. This second series of odds ratios establishes that, in the case whereby some sort of schooling was received, Madagascar presents the most discriminating educational heritage inequalities. The influence of these inequalities carries through to both middle school and secondary school. In the other two former French colonies, where schooling is less developed, the majority of the inequality of opportunity for education is concentrated in initial schooling factors. Lastly, the education systems in the two former British colonies are clearly less selective than the education system in Madagascar, at all levels of schooling.
Table 14 : Intergenerational odds ratios
Intergenerational educational mobility
Intergenerational occupational mobility Unschooled / Schooled At least primary /
At least middle school*
At least middle school / At least secondary school** Farmer / Non-farmer Côte d’Ivoire 49.6 [24.4; 100.9] 4.2 [2.9; 6.1] [1.5; 4.0] 2.5 [7.8; 12.6] 9.9 Ghana [6.7; 12.7] 9.2 [1.7; 3.6] 2.5 [2.0; 3.6] 2.7 [4.1; 6.0] 5.0 Guinea [18.2; 32.3] 24.2 [2.0; 3.3] 2.6 [1.3; 2.3] 1.8 [7.7; 11.6] 9.4 Madagascar [8.0; 11.9] 9.8 [3.8; 5.5] 4.6 [3.3; 5.3] 4.2 [13.0; 18.3] 15.4 Uganda [6.1; 8.3] 7.1 [3.0; 3.7] 3.3 [1.6; 2.3] 1.9 [3.6; 4.5] 4.0
Coverage: Men aged 22 and over whose father’s education and occupation are known.
*: The coverage is limited to sons who attended school and the father’s education is coded one level below: unschooled/schooled. The fathers’ and sons’ positions are therefore not symmetrical.
**: The coverage is limited to sons who attended middle school or secondary school and the father’s education is coded one level below: unschooled or at least primary/middle school. The fathers’ and sons’ positions are therefore not symmetrical.
Interpretation: In Côte d’Ivoire, an individual whose father never went to school and an individual whose father attended school have nearly a 50% higher probability of reproducing their father’s position than of changing it. Among the individuals who received schooling, an individual whose father never attended school is over four times more likely to go no further than primary school and an individual whose father attended school is over four times more likely to attend at least middle school, compared with the alternative. Among the individuals who attended middle school, an individual whose father did not go further than primary school is more than twice as likely to go no further than primary school and an individual whose father attended middle school is over twice as likely to go at least to secondary school, compared with the alternative. Lastly, sons of farmers and sons of non-farmers are nearly ten times more likely to reproduce their fathers’ positions than to change them..
The fourth and last column of Table 14 shows that Ghana and Uganda also have greater social fluidity from the point of view of intergenerational movements between the occupation of farmer and the other occupations19. In both of these countries, the son of a farmer and the son of a non-farmer are four to
five times more likely to reproduce their fathers’ positions than to change them. This odds ratio is twice as high (between 9 and 10) in Côte d’Ivoire and Guinea, and climbs to 15 to 1 in Madagascar. Among the former French colonies, the occupational mobility matrices show that it is very rare for sons of non-farmers in Côte d’Ivoire and Guinea to take up agriculture. In Madagascar, sons of farmers rarely leave farming (see Appendix 5).
This first section on longitudinal inequalities therefore gives rise to three main findings. Firstly, it again separates out Ghana, this time not for a particularly egalitarian cross-sectional distribution of income, but for high intergenerational fluidity. Secondly, as regards this latter aspect, it finds close similarities between the two former British colonies of Ghana and Uganda. It is striking to note that the countries with the lowest income dualism are those with the greatest intergenerational mobility between agriculture and other sectors. Thirdly, Madagascar stands out among the three former French colonies for its more widespread schooling in rural areas, but also for a highly selective education system based on social origin and a particularly low rate of exits from agriculture20.
The following section seeks to establish a link between these findings and the previous findings for income inequalities between social groups.
3.2. Inequality of opportunity for income
The social origin of individuals influences their income in two ways. Firstly, it conditions their access to the various levels of education and well-paid occupations. Secondly, it is liable to directly influence income by means of social capital effects and group solidarity effects. The analyses in this section do not attempt to differentiate between what could be called these two direct and indirect channels. Instead, they set out to measure the proportion of inequalities between social origins in cross-sectional income inequality.
Table 15 breaks down the standard-of-living inequalities for men aged 22 and over, using the variables introduced for the study of intergenerational mobility: level of education of sons aged 22 and over and their fathers, and the agricultural or non-agricultural occupation of father and son21. Simple linear
regression techniques presented in Appendix 6 are used to reconstitute, under certain assumptions, the expected income of each category of sons based on their education and origins. From this, we deduce the proportion of observed standard-of-living inequalities deriving from the inequalities predicted by the sons’ levels of education and father’s positions or deriving solely from the fathers’ positions.
19 It is impossible to study occupational mobility in any greater detail due to the lack of accuracy of the occupational classifications
available for the fathers.
20 This begs the question as to whether the gradual spread of schooling in Côte d’Ivoire and Guinea has improved or worsened the odds
ratios observed over time. However, tests using the log-linear model did not find any significant change in intergenerational educational mobility in these two countries, when the population was divided into age cohorts. It is only in Ghana and Madagascar that mobility appears to have risen slightly for the sons of the most recent generations. See Hiller (2005).
21 A cubic polynomial of age is also introduced to take into account income differences due to the life cycle or possibly the birth cohort.
Table 15 : Decomposition of per capita income inequalities between men aged 22 and over: the role of educational mobility and occupational mobility
A B C % Overall Theil index Positions and origins Origins only B/A C/A C/B Côte d’Ivoire 0.68 0.09 0.05 13 7 52 Ghana 0.45 0.01 0.01 2 1 58 Guinea 0.71 0.12 0.07 16 10 62 Madagascar 0.59 0.12 0.09 20 15 76 Uganda 0.63 0.05 0.04 8 6 67
Coverage: Men aged 22 and over.
Method: To obtain the position-based inequalities in column B, the individual’s household’s per capita income log was forecast by a multiple linear regression including the following position variables: age (cubic polynomial), occupation (2 categories: farmer and non-farmer) and level of education (4 categories : no education, primary, secondary and tertiary), and the following origin variables: father’s level of education (4) and farmer father (2). A second series of regressions was estimated with only the origin variables in the list of regressors to obtain the origin-based inequalities of opportunity in column C. See Appendix 6 for more details.
The table shows, first of all, that these position and origin variables explain a relatively large proportion of per capita income inequalities between sons, except in Ghana where, as we have already seen, there are particularly small deviations between groups: 8% to 20% for income (merely 2% in Ghana) (columns B and B/A). It also shows that the deviations between social origins are greatest in Madagascar, where they account for 15% of the per capita income inequalities observed between men aged 22 and over (columns C and C/A). They are again lowest in Ghana, where they come to a mere 1% of the Theil index. The other three countries present similar findings of 6% to 10%22.
Ghana and Madagascar’s respective educational and occupational mobility positions are therefore found to be associated with social origin in this first analysis of the inequality of opportunity for income. However, Uganda’s greater educational and occupational fluidity appears to be reflected to a lesser extent in the equality of opportunity for income, because social origin in this country plays a greater direct role in income.
Table 16 adds to this preliminary analysis by extending the list of destination categories. In particular, two detailed occupation and job status variables are introduced along with two variables concerning where the individual lives, place of residence (capital, other towns or countryside) and region of residence. The mother’s education is also added to the list of origin variables.
Table 16 : Decomposition of per capita income inequalities between men aged 22 and over: access to detailed social groups
A B C % Origins only C/A C/B Overall Theil index Positions and origins C1: Without education C2: With education B/A C1 / A C2 / A C1 / B C2 / B Côte d’Ivoire 0.68 0.22 0.05 0.10 32 7 15 22 46 Ghana 0.45 0.06 0.01 0.01 14 2 3 17 19 Guinea 0.71 0.32 0.07 0.12 45 10 17 23 37 Madagascar 0.59 0.20 0.10 0.13 33 17 22 51 66 Uganda 0.63 0.14 0.05 0.07 23 8 11 33 46
Coverage: Men aged 22 and over.
Method: To obtain the position-based inequalities in column B, the individual’s household’s per capita income log was forecast by a multiple linear regression including the following variables: age (cubic polynomial), detailed level of education (5), detailed status (9) and detailed occupation (8), place and region of residence, and the following origin variables: father’s level of education (4), mother’s level of education (4) and farmer father (2). A second series of regressions was estimated with just the origin variables in the list of regressors in order to obtain the origin-based inequalities of opportunity in column C. See Appendix 6 for more details.
22 In the case of current consumption, the (unreported) proportions explained by the position and origin variables are higher. This is due to
smaller measurement errors and irrelevant random components (transitory earnings). Nevertheless, the country rankings are not affected by this.