DIAL • 4, rue d’Enghien • 75010 Paris • Téléphone (33) 01 53 24 14 50 • Fax (33) 01 53 24 14 51 E-mail : [email protected] • Site : www.dial.prd.fr
D
OCUMENT DE
T
RAVAIL
DT/2005-10
Informal Sector Versus Informal
Contracts in Nairobi, Kenya
INFORMAL SECTOR VERSUS INFORMAL CONTRACTS IN NAIROBI, KENYA
Philippe Bocquier IRD-Paris, DIAL
Document de travail DIAL
Septembre 2005
ABSTRACT
From official records, it would appear that the labour market significantly shifted from the formal to the informal sector in Kenya. However, a careful examination of different data sources for Nairobi show that in the 1990s there has been no direct transfer of employment from the formal sector to supposedly flourishing informal enterprises, but rather an increasing number of employees informally contracted by formal enterprises to the expense of social and legal protection of employees. Seven out of eight jobs in Nairobi still depend on the formal sector, through either formal or informal contracts. Although migrants form more than three quarters of the active population in Nairobi, migration has not had a specific impact on the labour market structure and evolution. However, Nairobi became less attractive to active male migrants during the 1990s as unemployment and lack of opportunity in the formal sector deterred candidates from in-migrating. The Nairobi labour market also became more discriminative against women, whose chance to enter and to remain in the labour market reduced considerably. In the 1990s the combination of higher unemployment, lower female participation rate and reduced migration of males in active ages resulted in higher dependency on the workforce and in doubling the absolute poverty in Nairobi.
Keywords: labour market, migration, unemployment, informal sector, gender discrimination, Nairobi,
Kenya.
RESUME
D’après les sources officielles, il pourrait sembler que le marché du travail au Kenya a basculé sensiblement du secteur formel vers le secteur informel. Cependant, un examen attentif des différentes sources de données sur Nairobi montre que dans les années 1990 il n’y a pas eu de transfert direct des emplois du secteur formel vers les entreprises informelles supposées en pleine expansion. Au contraire, un nombre croissant d’employés est informellement contracté par les entreprises formelles au détriment de la protection sociale et légale de ces employés. Sept emplois sur huit à Nairobi dépendent du secteur formel, au travers de contrats formels ou informels. Bien que les migrants forment les trois quarts de la population active à Nairobi, la migration n’a pas eu un impact spécifique sur la structure et l’évolution du marché de l’emploi. Cependant, Nairobi attire dans les années 1990 moins de jeunes hommes actifs, du fait que le chômage et le manque d’opportunités dans le secteur formel a dissuadé les candidats à l’immigration. Le marché de l’emploi à Nairobi est aussi devenu plus discriminatoire envers les femmes, dont les chances d’entrer et de se maintenir sur le marché de l’emploi se sont réduites considérablement. Dans les années 1990, la combinaison d’un chômage en hausse, d’un taux d’activité féminine plus bas et d’un ralentissement de la migration masculine aux âges actifs a eu pour résultat une augmentation du taux de dépendance et un doublement de la pauvreté absolue à Nairobi.
Mots clés : marché du travail, migration, chômage, secteur informel, discrimination de genre, Nairobi,
Kenya.
Contents
INTRODUCTION ... 5
1. A CRITICAL APPRAISAL OF EMPLOYMENT DATA IN KENYA ... 6
2. WHAT LIES BEHIND THE GROWTH OF THE INFORMAL SECTOR IN NAIROBI? ... 8
2.1. Data sources and definitions... 9
2.2. Retrospective data and migration bias ... 11
2.3. Method of retro-projection and results ... 13
3. MIGRATION, UNEMPLOYMENT AND INFORMAL SECTOR GROWTH... 18
CONCLUSION... 21
BIBLIOGRAPHY ... 23
List of tables
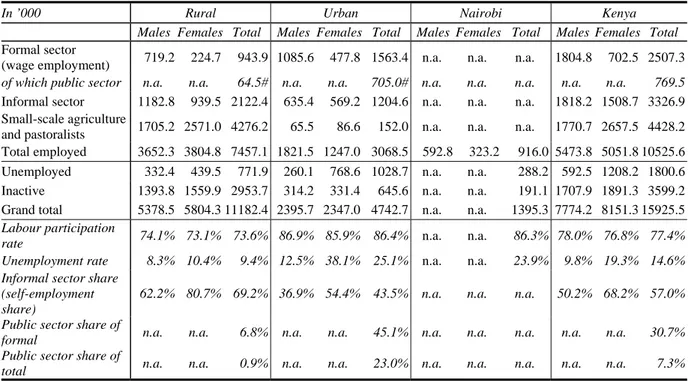
Table 1: Employment figures by area of residence and sex (people aged 15-64) according to the Integrated Labour Force Survey (1998/1999), in thousands... 8Table 2: Percentage non-migrants and migrants by age-group at first migration (NUrIP 2001)... 11
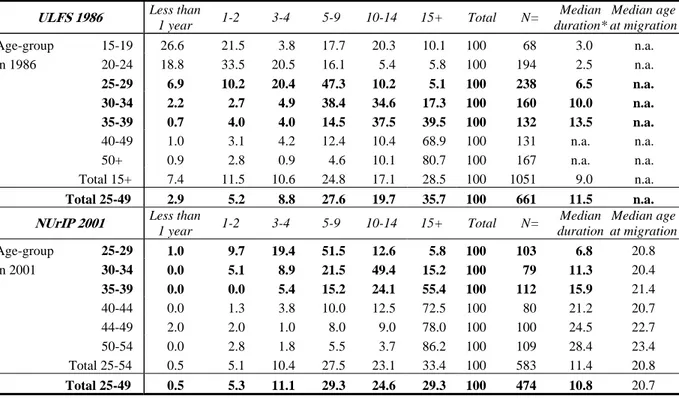
Table 3: Percentage distribution of adult-age male migrants by age-group and duration of residence in Nairobi according to the Urban Labor Force Survey (1986) and the NUrIP (2001) ... 11
Table 4: Mean and median age at first migration before age 30 (NUrIP 2001) ... 12
Table 5: Duration of males’ wage employment (1950s-1990s) ... 13
Table 6: Proportion of Wage Employment in Urban Areas and Nairobi by sex according to various sources... 15
Table 7: Estimation of Employment in Nairobi (1989 and 1999), annual percentage growth (1989-1999) and percentage distribution (population of active age, 15-64) ... 15
Table 8: Employment figures in Nairobi by sex (population aged 15-64) by retro-projection of the Nairobi Urban Integration Project (NUrIP) on the 1999 Census ... 16
Table 9 : Small-scale enterprises employment in Nairobi by sex of the employer (population aged 15-64) by retro-projection of the Nairobi Urban Integration Project (NurIP) on the 1999 Census... 16
Table 10 : Unemployment rate before and after migration (migrants between 15 and 30) as compared to non-migrants by generation and sex ... 19
Table 11 : Formal sector share among occupied migrants before and after migration (migrants between 15 and 30) as compared to non-migrants by generation and sex ... 19
Table 12 : Time to first employment in Nairobi for the city-born or migrants before 15 years old (Nairobians) by generation and sex ... 20
List of figures
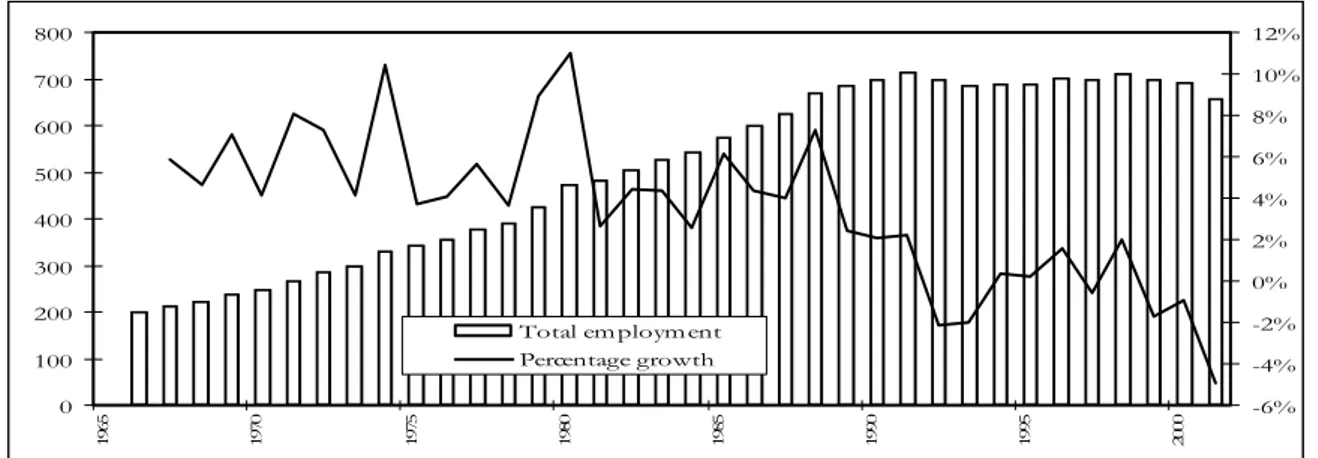
Figure 1: Kenya public sector employment (left-hand scale) and annual percentage growth
(right-hand scale) (CBS data 1966-2001) ... 6
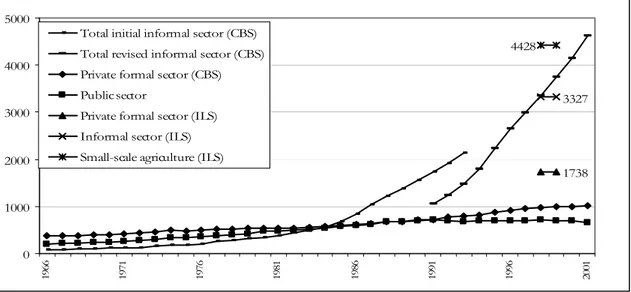
Figure 2: Employment by sector in Kenya according to CBS data (1966-2001) and ILS (1998-1999) ... 7
Figure 3: Repartition by sector of the active population by retro-projection of the NUrIP in 1989... 14
INTRODUCTION
The informal sector growth in Africa is seen by many labour economists as a logical consequence of the economic downturn that the continent is facing. Employment opportunities became scarce in the registered private sector whereas the public sector has practically ceased to recruit since the implementation of the structural adjustment programs (SAPs). The situation in Kenya confirms this outlined scenario. Kenya adopted a SAP proposed by the International Monetary Fund (IMF) as early as 1980, but with real implementation from 1986, following the fall in the coffee world market price in 1983-84. The aid from IMF to Kenya was suspended in 1998 (Kabubo-Mariara and Kiriti, 2002; O'Brien and Ryan, 2001).
The effect of those policies was not immediately evident on the labour market. The most obvious impact was on the public employment sector, as the first section of this paper shows. However, the impact on the private sector is not clear from the available sources on Kenya. In particular, the seemingly straightforward question of the importance of the informal sector has no straightforward answer. This might be surprising to the reader who is no doubt aware that Nairobi hosted a now famous scientific study on the informal sector by an ILO team in the late 1960s. This study (ILO, 1972) has triggered a number of studies aimed at explaining the level of unemployment and underemployment in the urban labour market. Basing their experience on Nairobi, Todaro (1976; 1997), Stiglitz (1974) and many others (to name but a few recent studies inspired by or commenting on the labour market in Africa: Jamal & Weeks, (1993), Becker & Hamer, (1994), World Bank, (1995), Mazumdar & Mazaheri, (2002)) refined the theory on the dualism between the rural and urban economies, by introducing a transition between the two in form of unemployment, in an attempt to explain why fast urbanisation (and high rural to urban migration) occurred despite low employment opportunities in the formal sector. Considering the scope of the literature on the subject, and the historical importance of Nairobi in this literature, it is quite surprising that so little has been done to measure the evolution of the informal sector share in Nairobi since the 1970s. Most studies conducted since then have concentrated on the practices of the informal sector (Macharia, 1997) or of the formal sector (Mazumdar and Mazaheri, 2002), but none have been done on the dynamics of the urban labour market as a whole. Very few results were published from the two major surveys on national labour force, the Urban Labour Force Survey of 1986 (Mazumdar and Mazaheri, 2002) and the Integrated Labour Force Survey of 1998/99 (Republic of Kenya, 2002b).
The lack of data on employment makes it difficult to answer essential questions on the labour market evolution: why did the informal sector appear to grow so much in recent years and what is the role of migration in this growth? The fast urban growth observed in the 1960s and 1970s could be explained by the dualism in the urban areas between the formal and informal sectors (for discussions on the definition of the informal sector, concept initiated by the work of Hart, (1973) in Ghana, see Feige, (1990), Dickens & Lang, (1992), Saint-Paul, (1996), Mead & Morrisson, (1996), Portes & Haller (2002)). In this theory urban unemployment is not the only transitional state towards good quality jobs. The urban informal sector also forms—for migrants but also more generally for the poorest—a transitional sector from the traditional sector (agriculture) towards the urban formal sector. In this view, the informal economy is mainly seen as a reservoir for the under-employed who expect (and do not necessarily get) higher revenue by eventually entering into the formal sector. The migrants were supposed to first enter the informal sector to improve their skills, adapt to the city way of life and then enter the formal, protected sector. Migration is therefore pointed out as a key factor in the development of the informal economy. However, the highest growth rates in the informal sector were observed in the 1980s and 1990s when urban growth rates appear to decline. In the case of Kenya, Nairobi’s growth rate was never as high as in the 1960s (12.2% per year in 1962-69) and has since been fairly constant (ranging between 4.8% and 5.0% per year). Did the migrants really form the bulk of the labour force employed in the informal sector? Can the growth of the informal sector essentially be attributed to migration?
Apart from the dynamics of the labour market with regard to migration, there could also be institutional reasons behind the registered growth of the informal sector. We mentioned earlier that
part of the growth in official figures could originate in a better coverage of the registration system through the improvement of taxation. It could also be that the informal enterprises were encouraged to employ more labour. The official policy regarding the informal sector has certainly changed over the years. As pointed out by historians, the State or the City Council in Kenya since colonial times to date have always hesitated between repression (the informal sector being ruled out as illegal, or even politically threatening) and control (if not integration in the formal economy) of petty traders mainly through taxation (Robertson, 2002). In the late 50s, under the Operation Anvil, petty traders allegedly hid Mau Mau militants, while since independence they have been said to nurture multiparty activists or political opposition at large since the instauration of multiparty system. On one hand they are considered a threat to tax-paying traders and enterprises, thus resulting in unfair trade, but on the other hand are also considered as a possible safety net to high unemployment and poverty. Small-scale manufacturing and crafts (popularly known in Kenya as the Jua Kali sector) were even at times officially supported, e.g. through the creation in 1987 of a Small Scale Enterprises Unit within the Ministry of National Planning and Development (Robertson, 2002), through the creation in 1988 of the Ministry of Technical Training and Applied Technology, nicknamed the Jua Kali Ministry (Macharia, 1997), or through the Sessional Paper N°2 of 1992 on the Small-Scale and Jua Kali Enterprises (Republic of Kenya, 2002b). For example, metal sheds were erected to hide from the ‘fierce sun’ in Kamukunji (an area well known for its informal sector activities), which is a way to give more dignity to those activities. The National Development Plans from 1997 state that the Government institutions will collaborate with non-public organisations to promote the growth of the informal sector. Did the public policy really change anything in the nature and relative importance of the informal sector in Nairobi’s economy?
1.
A CRITICAL APPRAISAL OF EMPLOYMENT DATA IN KENYAAccording to the Kenya Central Bureau of Statistics (CBS) data, the public employment sector increased at a 5.7% average annual growth from 1966 to 1988 (Figure 1), a much higher rate than the average growth of the population in the country (3.4%). This growth was at the expense of the public employees’ income: the average real wage in the public sector declined by about –2.9% per year, a rate more than two times higher that the –1.2% decline in average real wage in the private sector (Mazumdar and Mazaheri, 2002). Public employment annual growth declined from 7.3% in 1988 to 2.2% in 1991, the year when the public sector employment reached its maximum (715 100 employees). The growth was negative (around -2%) in 1992-1993, and hovered around 0% in 1994-2000. It was greatly negative (-4.9%) in 2001. The trend for the 1990s show a reduction of public sector employment to 658 000 in 2001, mainly by reductions in Central Government bodies (50 000 low-wage employees were retrenched by way of early retirement in 1993-98) but also by elimination of so-called ‘ghost-workers’ through computerisation of the pay-roll (O'Brien and Ryan, 2001).
Figure 1: Kenya public sector employment (left-hand scale) and annual percentage growth (right-hand scale) (CBS data 1966-2001)
0 100 200 300 400 500 600 700 800 1965 1970 1975 1980 1985 1990 1995 2000 -6% -4% -2% 0% 2% 4% 6% 8% 10% 12% Total em ployment Percentage growth
Figure 2: Employment by sector in Kenya according to CBS data (1966-2001) and ILS (1998-1999), in thousands 1738 3327 4428 0 1000 2000 3000 4000 5000 19 66 19 71 19 76 19 81 19 86 19 91 19 96 20 01
Total initial informal sector (CBS) Total revised informal sector (CBS) Private formal sector (CBS) Public sector
Private formal sector (ILS) Informal sector (ILS) Small-scale agriculture (ILS)
Nevertheless the lack of employment perspective was not only blatant in the public sector. Indeed, according to the official publications of the CBS (Republic of Kenya, 1970-2002), the share of the informal sector continued to increased from the early 90s. In Nairobi, the proportion employed in the informal sector would have increased from 44.3% in 1992 to 72.3% in 2001. It would appear that the labour market significantly shifted from the formal to the informal sector. This would confirm that the informal sector is a valuable alternative for retrenched formal sector employees as well as for youth entering the labour market. However the mode of computation on which these last figures are drawn is not clear and need to be compared with household surveys sources.
The Integrated Labour Force Survey (referred to as the ILS in official reports) is more comprehensive in its scope and uses internationally accepted definitions for employment sectors (Republic of Kenya, 2002a). The ILS evaluates employment at the time of the survey, i.e. December 1998 to January 1999 (see Table 1). The estimation of public sector employment differs only by about 50 to 70 thousand between CBS data (711 000 in 1998 and 699 000 in 1999) and ILS data (769 000 in 1998-1999). The difference might be due to sampling approximation in the ILS (e.g. Nairobi was under-represented in the sample, as we shall see) or to the interpretation of public employment definition (e.g. contracts with public administration or enterprises).
More worrying is the difference in estimating the formal and informal private sectors. At first glance, Figure 2 seems to show that the estimation of the informal sector is about the same from both sources (between 3.3 and 3.7 million in 1998-1999). However the differences in the estimation of the formal sector (1 million according to CBS, 1.7 according to the ILS) casts some doubt about the exact categories estimated by the CBS. A change in definition was introduced in the CBS data in 1991, though we could not find an explanation in the published reports on the exact change implemented. But more disturbing is the very steep upward trend shown by the CBS data, even considering constant definitions of the informal sector over time. Our opinion is that this trend shows more the improvement of the CBS permanent registration system of informal enterprises—probably through the taxation system—rather than a real expansion of the informal sector.
Because it relies on household data, the ILS should be more reliable despite sampling errors. According to this survey the share of the informal sector (as approximated by non-wage employment as opposed to self-employment) in the labour market (after excluding small-scale agriculture and pastoral activities) was 69.2% in rural areas and 43.5% in urban areas, which is particularly low compared to other African urban areas. However the time at which the survey was carried out— December 1998 to January 1998, when many workers are on annual leave in accordance with the school calendar—might have led to some bias as the last week before the interviews served as the reference to estimate labour participation. This is most surprising since the ILS had an important
module on child labour, which was much more subject to the school calendar constraint than adult labour was. The labour participation question served as a filter so that workers on leave would not answer to specific questions on occupation (such as status of occupation, type of occupation, sector and industry, hours worked) and school-children who worked during their holiday would appear to participate in the labour force and answer to questions on occupation.
Another bias could be introduced by the question relative to the sector of occupation. Respondents were asked to tell the interviewer if their employment fell into public formal sector, private formal sector, informal sector (the term Jua Kali—fierce sun—is explicitly used in the questionnaire), small-scale farming and pastoral activities or other to specify. The specifics of each sector were only given in the interviewer’s manual. No precise questions—i.e. on written accountancy, records, contracts, etc.—were used to categorise the employment, so that the answers are subjected to the view and perception of both the respondent and the interviewer. Furthermore, the ILS also has a major drawback for the purpose of estimating employment in Nairobi: the sample size is particularly small (810 respondents, of all ages, interviewed in Nairobi out of 52 016 interviewed in the whole country) and 5 times under-represented (1.56% in the sample against 7.47% in the population). This is why some statistics (like the share of wage or informal employment) were not produced for Nairobi only, even though with more than 2 million inhabitants at the time it was the largest urban labour market in the country.
Table 1: Employment figures by area of residence and sex (people aged 15-64) according to the Integrated Labour Force Survey (1998/1999), in thousands
In ’000 Rural Urban Nairobi Kenya
Males Females Total Males Females Total Males Females Total Males Females Total
Formal sector
(wage employment) 719.2 224.7 943.9 1085.6 477.8 1563.4 n.a. n.a. n.a. 1804.8 702.5 2507.3
of which public sector n.a. n.a. 64.5# n.a. n.a. 705.0# n.a. n.a. n.a. n.a. n.a. 769.5
Informal sector 1182.8 939.5 2122.4 635.4 569.2 1204.6 n.a. n.a. n.a. 1818.2 1508.7 3326.9 Small-scale agriculture
and pastoralists 1705.2 2571.0 4276.2 65.5 86.6 152.0 n.a. n.a. n.a. 1770.7 2657.5 4428.2 Total employed 3652.3 3804.8 7457.1 1821.5 1247.0 3068.5 592.8 323.2 916.0 5473.8 5051.8 10525.6 Unemployed 332.4 439.5 771.9 260.1 768.6 1028.7 n.a. n.a. 288.2 592.5 1208.2 1800.6 Inactive 1393.8 1559.9 2953.7 314.2 331.4 645.6 n.a. n.a. 191.1 1707.9 1891.3 3599.2 Grand total 5378.5 5804.3 11182.4 2395.7 2347.0 4742.7 n.a. n.a. 1395.3 7774.2 8151.3 15925.5
Labour participation
rate 74.1% 73.1% 73.6% 86.9% 85.9% 86.4% n.a. n.a. 86.3% 78.0% 76.8% 77.4% Unemployment rate 8.3% 10.4% 9.4% 12.5% 38.1% 25.1% n.a. n.a. 23.9% 9.8% 19.3% 14.6%
Informal sector share (self-employment share)
62.2% 80.7% 69.2% 36.9% 54.4% 43.5% n.a. n.a. n.a. 50.2% 68.2% 57.0% Public sector share of
formal n.a. n.a. 6.8% n.a. n.a. 45.1% n.a. n.a. n.a. n.a. n.a. 30.7% Public sector share of
total n.a. n.a. 0.9% n.a. n.a. 23.0% n.a. n.a. n.a. n.a. n.a. 7.3% Source: CBS, 2002. n.a.: not available. #: approximation from 1998 and 1999 data, rural evaluated as public sector employees working in
Agriculture & Forestry or in Mining & Quarrying.
2.
WHAT LIES BEHIND THE GROWTH OF THE INFORMAL SECTOR IN NAIROBI?To fill in the data gap, we had to resort to a combination of Census data and of the Nairobi Urban Integration Project (NUrIP) data. We relied on the Census to get absolute figures of the number employed or not employed whereas we used the NUrIP to get estimations of the different rates. Before going into the details of the computation, we will first explain the nature of the NUrIP survey and the employment-related definitions used in that survey. More extensive results are available in other publications (Agwanda et al. 2004a; Agwanda et al., 2004b).
2.1.
Data sources and definitionsThe NUrIP survey is a retrospective survey aiming at collecting the biographies of a representative sample of three generations aged 45-54, 35-44 and 25-34 at the time of data collection (mid-January to mid-May 2001) in Nairobi Province (which is also a District). The sampling procedure is multistage, proportional to population size (PPS). The first stage consisted of stratification of the main administrative areas (8 Divisions: the population of the agglomeration outside the administrative boundaries was not sampled, although it is estimated that Greater Nairobi is about 15% larger than Nairobi Province). The second stage consisted of surveying 115 Enumeration Areas (EAs) scattered among the eight administrative divisions. In the third stage, a household list was established for each EA identified. The fourth stage consisted of sampling the individuals drawn from the sampled households using unequal sampling probability to obtain a comparable number of biographies for each sex and age groups. Out of the 3 787 households surveyed, 1 577 biographies were collected.
The biographical questionnaire is adapted from the so-called Urban Integration Surveys conducted elsewhere in Africa (Antoine and Bocquier, 1997; Antoine et al., 2000; Antoine, Ouédraogo and Piché, 1998). The rationale of this questionnaire is to collect the aspects of individual lives that change over time and that can be easily remembered and dated. Each part (module) of the questionnaire relate to residential, professional and family events:
1. One module pertains to change of residence from birth to the time of interview. It traces migratory routes including change of residences withing the city. It particularly focuses on housing conditions and access to services (water, electricity, etc.) and on the evolution of residential status (tenant, landowner, and housed).
2. In the module on activities, all periods in active life are recorded including unemployment, schooling and other training period. Changes in status for the same employment (e.g. changes in duties, promotion, etc.) are also taken into account.
3. Marital status, including all complex forms of union (from informal union i.e. simple cohabitation, to monogamy and polygamy) is recorded.
4. The last module pertains to fertility history and to the education and residence of each surviving child.
Before the biographical questionnaire is filled, an AGEVENT form (short for “Age and Event recording form”) helps the interviewer to sketch the biography (Antoine, Bry and Diouf, 1987). It is used to better capture the time of occurrence of events experienced by the interviewee. Family events such as births, marriage, deaths, etc., are first recorded on this form as they are usually the best remembered and also because they are often officially recorded. After this, residential and professional events are recorded and placed along a time-scale, where main historical events are also mentioned. In this way ordering is easily achieved and confirmed. Only changes separated by more than 6 months are recorded, except for period of unemployment which can be captured by a specific question if they lasted between 1 to 6 months. Otherwise, the biographical questionnaire will only record a period of 6 months or more.
With regard to recording periods of activity, employment is divided into three rather than two distinctive categories. The formal sector is composed of registered employees and self-employed individuals or employers who hold written accounts of their business. In the NUrIP survey, the criterion for registration is that the employee received a payslip, an indicator that the employer follows the rules of modern accountancy and is probably paying taxes. In the formal sector, employees are supposedly protected by law and benefit from some sort of health security—through National Health Insurance Fund (NHIF) or other private schemes—and retirement benefit—through the minimum public service, National Social Security Fund (NSSF) or through their employer’s private schemes—, if not from unemployment or early retirement benefits. The self-employed or employers are classified in the formal sector when they declared holding written accounts in personal books or through formal accountancy.
The informal sector is defined by opposition to the above. It is itself divided into two sub-sectors: the upper tier informal sector and the lower tier informal sector. In the NUrIP survey, the employees without payslips are included in the informal sector. Among those, the employees whose salary is recorded either in logbook or in other forms (payment voucher, receipt) are classified in the upper tier informal sector. These types of record indicate that the employer is using some formal accountancy (itself indicating a formal type of enterprise), but the protection of the employee is weak, even though a written proof of employment can be used in court in case of a conflict between the employee and the employer. In the upper tier informal sector, employees do not usually benefit from health, retirement or other benefits, but they can resort to the law when they really need to and can afford it. Employees with salaries not recorded in any way are classified in the lower tier informal sector and this indicates that the employer did not use formal accountancy either for all employees or for that particular employee. Consequently, the lower tier informal sector employees are almost unprotected with regard to the law, in addition to receiving no health, retirement and other benefits.
The self-employed are classified in the informal sector when they declared holding no written accounts in personal books or through formal accountancy. The informal character of the business usually comes from the capacity of its owner rather than from an intention to evade paying taxes or trade license although this can of course be a reason. Owners of informal sector businesses usually lack the capacity and skill to follow formal accountancy rules. The upper and lower tiers of the informal sector employers are not differentiated because of the small numbers of employers using formal accountancy rules. The upper tier informal sector employers (accountancy in personal books) are actually merged with the minority of formal sector employers (with formal accountancy) for convenience and because some sort of written accountancy is an indicator that the enterprise is subjected to some sort of control by the fiscal authorities by way of tax collection (mainly trading licence).
Note that the above definitions classify individuals and not enterprises, unless we are referring to the self-employed who can also be employers. In particular, it is not possible in the NUrIP survey to know to which sector the enterprise an employee of the informal sector works for belongs to. For example, we could have asked about the size of the enterprise the employees worked for. This question was tested in other urban integration surveys elsewhere in Africa but results proved unreliable as many employees did not know the size of their enterprise, let alone the type of accountancy. It is therefore important to bear in mind that there can be a difference between the category of an enterprise and the way its employees are registered. Some employers in the formal sector evade taxes and reduce costs of employment by not registering their employees in their books even though the business itself remains properly registered. Therefore, our definitions differ from the internationally accepted definition of the sector of an enterprise, where all employees of an enterprise belong to the sector of this enterprise. We preferred to use definitions at the individual level to analyse more closely the working conditions of employees, i.e. the quality of employment.
Although the longitudinal nature of the survey makes it suitable for event history analysis (for this type of analysis on the same data, see Agwanda and Bocquier, 2003; Agwanda et al., 2004a), the NUrIP data can also be used for cross-sectional analysis. It is possible with this survey to compute the evolution of an aggregate (e.g. labour participation, informal sector share) at different dates before the survey. However, because of the retrospective nature of the survey, such aggregates can only be computed for respondents who were present in Nairobi as they were interviewed. The survey misses out the migrants who migrated temporarily in Nairobi and left for another destination (be it their place of origin or another one). The survey also omits the inhabitants who died before the time of the survey. For these reasons, the sample cannot be fully representative of all the population that had at one time lived in Nairobi. Therefore the sample mostly represents the sedentary population (urban natives and permanent migrants) and the analyses concerns in particular the Nairobi-born, the migrants who grew up in Nairobi and the migrants who settled for a long period in Nairobi. In that respect, a retrospective survey cannot be a substitute for a permanent system of observation capable of producing yearly indices.
2.2.
Retrospective data and migration biasMigration is an important potential source of bias and more so given that migration has always been a major phenomenon in Nairobi. The data shown in Table 2 pertains to the age at the time of migration, showing the age selectivity of migrants. The proportion of city-born (as opposed to the so-called life-time migrants) is low. It is less than 10% for the older generation (aged 45-54 at the life-time of our survey) but reaches no more than 20% in the younger generation (aged 25-34) for both sexes. In the following, we use a less restrictive definition of non-migrants by joining the respondents born in Nairobi with those who migrated before they were 15 years old. We will henceforth refer to this category as the ‘Nairobians’ or the non-migrants. Even with this extended definition, the Nairobians represent only 15% to 30% depending on the generation, with very little variation by gender.
Table 2: Percentage non-migrants and migrants by age-group at first migration (NUrIP 2001)
Males Females Generation Born in Nairobi Migrants 0-14 Migrants 15-29 Migrants 30+ N= 100% Born in Nairobi Migrants 0-14 Migrants 15-29 Migrants 30+ N= 100% 45-54 9.9 5.2 59.9 25.0 232 9.8 6.4 61.7 20.9 326 35-44 15.8 9.6 64.5 10.1 228 17.6 7.5 64.4 10.5 267 25-34 18.4 8.1 72.2 0.9 223 20.1 9.4 69.8 0.6 308
Migration is certainly high by any standard and remained so through generations. It is however fortunate that migration patterns in Nairobi have not changed much since the 1970s. We have seen already that the population growth of Nairobi has been fairly constant. What is even more remarkable is that the duration of residence did not change much either. This we can verify by comparing the results of the NUrIP with a specific tabulation by Mazumdar and Mazaheri (2002: p.131) from the Urban Labour Force Survey (ULFS) conducted in 1986.
Table 3: Percentage distribution of adult-age male migrants by age-group and duration of residence in Nairobi according to the Urban Labor Force Survey (1986) and the NUrIP (2001)
ULFS 1986 Less than
1 year 1-2 3-4 5-9 10-14 15+ Total N= Median duration* Median age at migration Age-group 15-19 26.6 21.5 3.8 17.7 20.3 10.1 100 68 3.0 n.a. in 1986 20-24 18.8 33.5 20.5 16.1 5.4 5.8 100 194 2.5 n.a. 25-29 6.9 10.2 20.4 47.3 10.2 5.1 100 238 6.5 n.a. 30-34 2.2 2.7 4.9 38.4 34.6 17.3 100 160 10.0 n.a. 35-39 0.7 4.0 4.0 14.5 37.5 39.5 100 132 13.5 n.a. 40-49 1.0 3.1 4.2 12.4 10.4 68.9 100 131 n.a. n.a. 50+ 0.9 2.8 0.9 4.6 10.1 80.7 100 167 n.a. n.a. Total 15+ 7.4 11.5 10.6 24.8 17.1 28.5 100 1051 9.0 n.a. Total 25-49 2.9 5.2 8.8 27.6 19.7 35.7 100 661 11.5 n.a.
NUrIP 2001 Less than
1 year 1-2 3-4 5-9 10-14 15+ Total N= Median duration Median age at migration Age-group 25-29 1.0 9.7 19.4 51.5 12.6 5.8 100 103 6.8 20.8 in 2001 30-34 0.0 5.1 8.9 21.5 49.4 15.2 100 79 11.3 20.4 35-39 0.0 0.0 5.4 15.2 24.1 55.4 100 112 15.9 21.4 40-44 0.0 1.3 3.8 10.0 12.5 72.5 100 80 21.2 20.7 44-49 2.0 2.0 1.0 8.0 9.0 78.0 100 100 24.5 22.7 50-54 0.0 2.8 1.8 5.5 3.7 86.2 100 109 28.4 23.4 Total 25-54 0.5 5.1 10.4 27.5 23.1 33.4 100 583 11.4 20.8 Total 25-49 0.5 5.3 11.1 29.3 24.6 29.3 100 474 10.8 20.7
Source: NUrIP-2001; Mazumdar & Mazaheri (2002) p.131 from Urban Labor Force Survey, 1986, original tabulations. n.a.: not available. * Our own approximation for median age in ULFS. Total for NUrIP is a sample-weighted average. Comparable series are marked in bold characters.
Despite the 15-year span, the results are remarkably similar for comparable age-groups (Table 3). The median ages and the distribution for age-groups 25 to 39 are greatly in accordance, showing only a slightly longer duration of residence in 2001. The median age at migration computed from the NUrIP (last column of Table 3) shows a decline in the youngest generations of males. However the median is computed here for all migrations irrespective of age: the older generation could have a higher median age at migration simply because of age limitation (e.g. the generation aged 30-34 at the time of the survey could not have migrated after 35 years old). To limit this measurement bias we computed a series of median ages for migration before age 30 for both males and females (Table 4). Only for the generation 25-34 does a slight downward measurement bias remain.
Table 4: Mean and median age at first migration before age 30 (NUrIP 2001)
Males Females
Generation Mean Median Interquartile range N= 100% Mean Median Interquartile range N= 100% 45-54 21.1 21.4 5.1 151 20.2 20.0 5.3 222 35-44 20.0 20.3 5.5 169 19.9 19.2 6.5 192 25-34* 20.0 20.5 4.3 179 19.3 19.5 5.4 244
* All indicators for the generation 25-34 are slightly biased downward but the median is less sensitive to this bias.
What is most striking about the figures in Table 4 is that the age at first migration is heavily concentrated around the median. The interquartile range shows that 50% of the distribution is concentrated on 4.3 to 6.5 years around the median, depending on generation and gender. In other words, half the migrants came to Nairobi between 17 and 23 years old or so, and that did not change much over the past 40 years.
If most migrants stayed permanently and formed their family in the city, we could expect a much higher growth rate for Nairobi than the less than 5% actually observed. This is possible only because of a circular migration system. Most of the migrants come as young adults, usually after secondary school. As seen later in this article, a majority of migrants comes to Nairobi to look for employment or after being offered an employment. A minority comes for vocational or higher education. The majority of migrants are males—a pattern that traces back to the colonial times. The male to female ratio has shifted from 16 men to 1 woman at the beginning of the 20th century, to 3.5 men to 1 woman in 1948, 1.47 to 1 in 1969, 1.38 to 1 in 1979, 1.31 to 1 in 1989, to 1.15 to 1 in 1999. The figures are even higher in the population of active age (15-64), although also declining: the indices were 1.83 in 1969, 1.68 in 1979, 1.51 in 1989 and 1.24 in 1999. The male to female ratio is more balanced now than ever before, but meanwhile the city has witnessed a low and declining fertility. In 1988/89 the Total Fertility Rate (TFR, i.e. mean number of children per female) was 4.6 in Nairobi compared to 6.7 for Kenya, and ten years later in 1998 the TFR dropped to 2.6 in Nairobi compared to 4.7 for Kenya. Few migrants form families in Nairobi and in addition many of their children were actually born and raised outside Nairobi, notably when starting school and until they finish secondary education. This explains why there has always been an abnormally low proportion of children (aged less than 15) in Nairobi (the proportion declined from 34.6% in 1969 to 31.1% in 1999) compared to Kenya as a whole (55.2% to 43.7%). The low fertility and the specific living arrangements of the family are meant to lower the cost of education, which is not easily accessible to most of the city dwellers. At older ages, the retired employees do not stay long in Nairobi and contribute to the return-migration flow to places of origin. The basic principles of the circular migration system had probably been put in place in the 1950s. The system is fairly stable since the mid 1960s and has been gradually modified by the rising level of education of women, who entered the labour force in the 1970s and 1980s and led to a more balanced gender distribution of the Nairobi population.
The fact that migration patterns did not change much over the year is reassuring but does not validate retrospective aggregates. Biases could still occur if there was a selection of specific migrants over the years. Another way to check that aggregates computed retrospectively do not differ too much from reality, is to compare the NUrIP estimates with estimates from historical sources. One indicator that we found available in the literature is the duration of first employment. Collier and Lal, (1986)
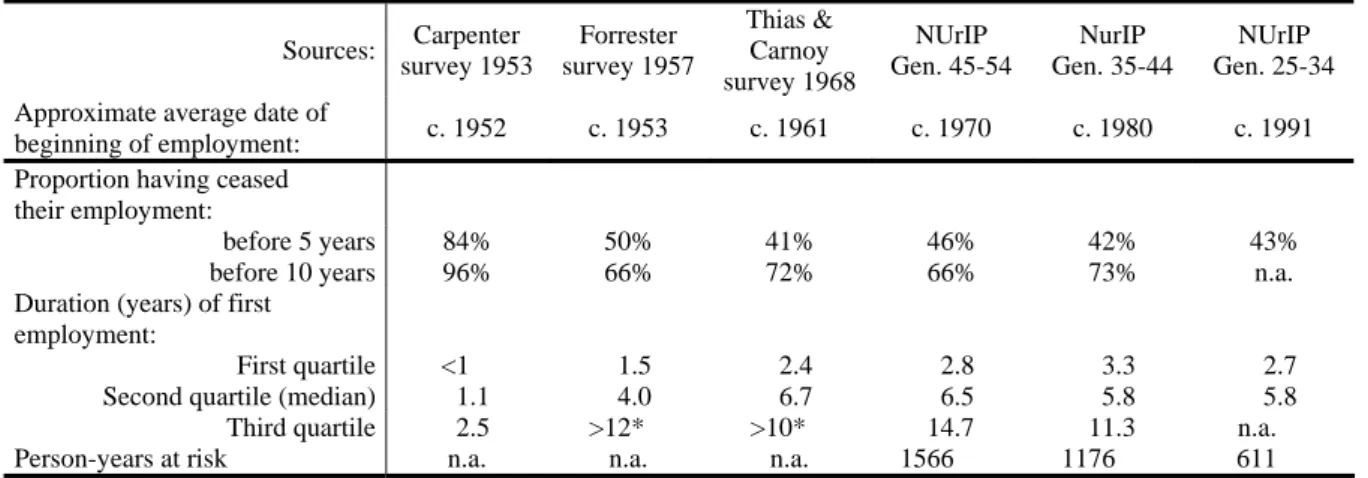
using different surveys for the year 1953, 1957 and 1968. From these, we computed the median number of years in the employment bracket as well as the percentage still in current job after 5 and 10 years. We computed the same estimates from the NUrIP. From Table 5 we first notice the considerable change in employment duration from the beginning of the 1950s to the end of the 1960s. In 1953 84% of wage employees stayed less than five years in their current employment, compared to 50% in 1957 and 41% only in 1968. The median duration of employment jumped from 1.1 to 4 years and then to 6.7 years. Collier and Lal attribute this change to the policy that followed the Carpenter report of 1954 recommending the increase in minimum wage in order to stabilize labour in the city of Nairobi1. The second remarkable feature of Table 5 is that our estimate for the 1970s based on the NUrIP matches quite well with the trend observed by Collier and Lal. The selection bias generally attributed to retrospective data, even for events dating back to the 1970s, does not seem to be strong enough to impair the validity of our retrospective estimates. The selection of the most successful migrants does not seem to be so great as to considerably bias the estimates. The Collier and Lal estimates together with the NUrIP estimates show that wage employment duration remained remarkably stable from the mid 1950s.
Table 5: Duration of males’ wage employment (1950s-1990s)
Sources: Carpenter survey 1953 Forrester survey 1957 Thias & Carnoy survey 1968 NUrIP Gen. 45-54 NurIP Gen. 35-44 NUrIP Gen. 25-34 Approximate average date of
beginning of employment: c. 1952 c. 1953 c. 1961 c. 1970 c. 1980 c. 1991 Proportion having ceased
their employment:
before 5 years 84% 50% 41% 46% 42% 43% before 10 years 96% 66% 72% 66% 73% n.a.
Duration (years) of first employment:
First quartile <1 1.5 2.4 2.8 3.3 2.7
Second quartile (median) 1.1 4.0 6.7 6.5 5.8 5.8 Third quartile 2.5 >12* >10* 14.7 11.3 n.a.
Person-years at risk n.a. n.a. n.a. 1566 1176 611
Source: NUrIP (2001) and our own computation from Table 8.5 in Collier and Lal (1986), citing different surveys. *: approximate values by projection over the 10 years time-limit of the published table. na.: not available.
The consistency of migration and duration of employment indices computed from retrospective NUrIP data and cross-sectional data is an indication that the NUrIP is not affected as much by the migrant selection bias. The migrants sampled by the NUrIP in 2001 seem to represent fairly well the migrants who lived in Nairobi for some time and might have left for some other destination before 2001. There is sufficient evidence to support the use of retrospective estimates at least for the years 1989 and 1999, when Censuses were conducted in Kenya.
2.3.
Method of retro-projection and resultsFrom the NUrIP retrospective survey, we can easily compute a number of rates that can help us estimate the composition of the labour market and its evolution over time, albeit with some cautious computation due to the age-limitation of the NUrIP sample of biographies. The biographies are collected from a sample of males and females aged 25 to 54 at the time of the survey, i.e. in the first half of 2001. Considering that the last Census took place in August 1999, and the last but one in August 1989, our sample was aged about 23 ½ to 53 ½ at the 1999 Census, and 13 ½ to 43 ½ at the 1989 Census. Therefore age-groups which are strictly comparable from one period to the other are 23 ½ to 43 ½. By five-year age-groups of active age (15 to 64), it means that projections are to be computed up to age-group 20-24 for the year 1999 and from age-group 40-44 for the year 1989 and 50-54 for the year 1999. Note that we can use the trend observed from group 15-19 to age-group 20-24 for the year 1989 to project missing estimates for 1999. The trend from age-age-group 40-44
to age-group 45-49, and even 50-54, for the year 1999 can also be used to project missing estimates for 1999. However estimates after 55 years old cannot be obtained from our data and can only be guessed at. Fortunately, the age-composition of the Nairobi population is such that the population aged 55 and above represents only 2.5% of the population of active age in 1989 and 1999. False hypotheses about this age-group are unlikely to affect the aggregated estimates.
Figures 1 and 2, where doted lines represent projections, illustrate the above. By applying this method to Census estimates by age-group and sex, we are able to produce a number of estimates regarding the repartition of the labour force by sector of the economy. Simple aggregates are computed here for comparison of the Nairobi labour market between 1989 and 1999, while more refined estimates are computed for 1999 and offer a valuable alternative to the figures produced by the ILS-1998/99.
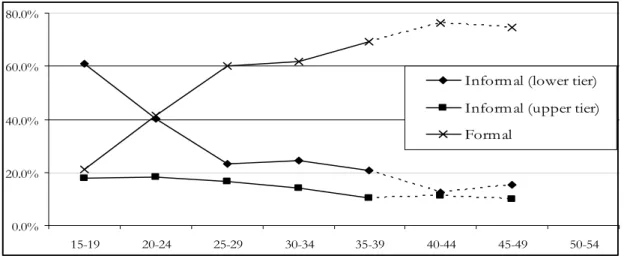
Figure 3: Repartition by sector of the active population by retro-projection of the NUrIP in 1989
0.0% 20.0% 40.0% 60.0% 80.0% 15-19 20-24 25-29 30-34 35-39 40-44 45-49 50-54
Informal (lower tier) Informal (upper tier) Formal
Figure 4: Repartition by sector of the active population by retro-projection of the NUrIP in 1999
0.0% 20.0% 40.0% 60.0% 80.0% 15-19 20-24 25-29 30-34 35-39 40-44 45-49 50-54
Informal (lower tier) Informal (upper tier) Formal
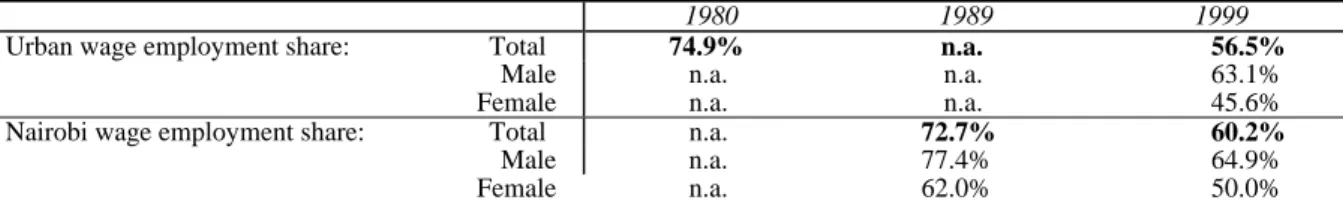
Table 7 is based on the results of the retro-projection for 1989 and 1999, while Table 8 and Table 9 limit themselves to 1999. Table 6 compares our results for wage employment rates with the ILS estimation for 1998/99 and with a World Bank estimation for 1980 (Fallon, 1985). According to the ILS, the share of wage employment in the labour market (excluding small-scale agriculture and pastoral activities) was 30.8% in rural areas and 56.5% in urban areas, which is particularly high compared to other African urban areas, but appears to be declining from a higher estimate for 1980 (74.9%). Unfortunately this statistic on employment was not produced for Nairobi only, again for sampling reasons. Our estimates show that the share of wage employment would have decreased from
Table 6: Proportion of Wage Employment in Urban Areas and Nairobi by sex according to various sources
1980 1989 1999
Urban wage employment share: Total 74.9% n.a. 56.5%
Male n.a. n.a. 63.1%
Female n.a. n.a. 45.6% Nairobi wage employment share: Total n.a. 72.7% 60.2%
Male n.a. 77.4% 64.9% Female n.a. 62.0% 50.0%
Sources: Fallon(1985) using different sources for 1980; ILS 1998/99 for urban areas; NUrIP retro-projection on the 1989 and 1999 Census data for Nairobi.
The number of wage employees in Nairobi would have increased at an annual rate of 1.7% only, against 7.6% for non-wage employment (Table 7). Using our definition of sector, the informal sector (lower and upper tiers) would have increased from 40.0% in 1989 to 44.7% in 1999. The NUrIP estimates for the lower and upper tiers informal sector in Nairobi translate into a 4.8% annual growth in the inter-census period (1989-1999), as against 3.6% for the population employed in Nairobi, and 4.9% for the entire Nairobi population. In the meantime, formal sector share decreased from 60.0% to 55.3%, i.e. only growing at a 2.7% annual rate, 2 percentage points less than the informal sector. The upper tier informal sector grew at 3.8% a year, a little more than the entire employed population, but more for women (7.6%) than for men (2.9%). The growth of the informal sector is mainly attributed to the lower tier informal sector, which experienced a 5.3% annual growth, rising from 25.8% in 1989 to 30.3% in 1999. It is also striking that this increase is essentially due to women (6.1% annual growth as against 4.7% for men).
The unemployment rate in Nairobi was evaluated at 23.9% by the ILS (25.1% for all urban areas) as against 13.8% in the NUrIP and 15.5% in the 1999 Census. This important difference might be explained by a difference in definition (NUrIP relies on retrospective records biased towards long periods of unemployment), and also by the classification by the ILS of many inactive people as unemployed, leading not only to a higher unemployment rate but also to a higher labour participation rate (86.3%) than in the retro-projection based on the NUrIP (74.5%) or in the 1999 Census (74.2%). In addition, the differences might be related to the small sample used for Nairobi by the ILS, and also that it was probably biased toward middle-class areas (unemployment is notoriously higher among educated youth).
Table 7: Estimation of Employment in Nairobi (1989 and 1999), annual percentage growth (1989-1999) and percentage distribution (population of active age, 15-64)
1989 1999
In ‘000; decennial percentage growth in brackets Males Females Total Males Females Total Formal sector 245.7 110.4 356.0 328.9 138.0 466.9
annual % growth 1989-99 formal 3.0% 2.3% 2.7%
Informal sector: 165.6 71.5 237.0 244.7 133.3 377.9
annual % growth 1989-99 informal 4.0% 6.4% 4.8%
upper tier informal sector all employed 70.0 14.2 84.1 92.8 29.4 122.2
annual % growth 1989-99 upper tier 2.9% 7.6% 3.8%
Lower tier informal sector all employed 95.6 57.3 152.9 151.9 103.9 255.7
annual % growth 1989-99 lower tier 4.7% 6.1% 5.3%
Wage employment (all sectors) 318.2 112.8 431.0 372.5 135.7 508.2
annual % growth 1989-99 wage employees 1.6% 1.9% 1.7%
All employed 411.2 181.9 593.1 573.5 271.3 844.8
annual % growth 1989-99 all emploeyd 3.4% 4.1% 3.6%
% distribution Males Females Total Males Females Total
Formal sector 59.7% 60.7% 60.0% 57.3% 50.9% 55.3% Informal sector, of which: 40.3% 39.3% 40.0% 42.7% 49.1% 44.7% upper tier informal sector all employed 17.0% 7.8% 14.2% 16.2% 10.8% 14.5% lower tier Informal sector all employed 23.3% 31.5% 25.8% 26.5% 38.3% 30.3%
Wage employment (all sectors) 77.4% 62.0% 72.7% 64.9% 50.0% 60.2%
All employed 100.0% 100.0% 100.0% 100.0% 100.0% 100.0%
Note: This table and the two following tables are based on indicators computed from the biographical NUrIP data and retro-projected on the Census data for 1989 and 1999. The formal sector includes employees with payslip and self-employed with formal accountancy. The upper tier informal sector includes employees with some kind of record but no payslip whereas the lower tier
Table 8: Employment figures in Nairobi by sex (population aged 15-64) by retro-projection of the Nairobi Urban Integration Project (NUrIP) on the 1999 Census
In ‘000 Male Female Total
Formal sector employees 234.1 84.2 318.3
Upper tier informal sector employees 92.8 29.4 122.2
Lower tier informal sector employees 104.5 66.8 171.2
Total employees 431.4 180.3 611.7
Self-employed formal sector 94.8 53.9 148.6
Self-employed informal sector 47.4 37.1 84.5
Total self-employed 142.1 91.0 233.1
Employed all sectors: 573.5 271.3 844.8
of which wage employees 372.5 135.7 508.2
Unemployed 84.9 50.2 135.1
Studying or Inactive 125.7 308.3 434.1
Grand total 784.2 629.8 1414.0
Labour participation rate 84.0% 51.0% 69.3%
Wage employment rate (all sectors) 64.9% 50.0% 60.2%
Unemployment rate 12.9% 15.6% 13.8%
Informal (upper & lower tier) sector share employees 45.7% 53.3% 48.0%
self-employed 33.3% 40.8% 36.2%
all employed 42.7% 49.1% 44.7%
Lower tier informal sector share employees 24.2% 37.0% 28.0%
self-employed 33.3% 40.8% 36.2%
all employed 26.5% 38.3% 30.3%
Self-employment share formal sector 22.5% 32.2% 25.2%
lower tier informal sector 31.2% 35.7% 33.0%
all sectors 24.8% 33.5% 27.6%
Table 9: Small-scale enterprises employment in Nairobi by sex of the employer (population aged 15-64) by retro-projection of the Nairobi Urban Integration Project (NUrIP) on the 1999 Census
In ‘000 sex of the employer: Male Female Total
Formal sector small-scale enterprises employment 238.6 116.7 355.3
Self-employed 94.8 53.9 148.6
Employees *143.8 *62.8 *206.6
Average number of employees per enterprise 1.52 1.17 1.39
Informal sector small-scale enterprises
employment 61.7 43.5 105.2
Self-employed 47.4 37.1 84.5
Employees *14.4 *6.4 *20.8
Average number of employees per enterprise 0.30 0.17 0.25
All sectors small-scale enterprises employment 300.3 160.2 460.5
Self-employed 142.1 91.0 233.1
Employees *158.1 *69.2 *227.4
Average number of employees per enterprise 1.11 0.76 0.98
Employed all sectors, of which: 573.5 (100.0%) 271.3 (100.0%) 844.9 (100.0%)
Self-employed 142.1 (24.8%) 91.0 (33.5%) 233.1 (27.6%)
Employees of small-scale enterprises *158.1 (27.6%) *69.2 (25.5%) *227.4 (26.9%)
Employees of medium to large scale enterprises 273.2 (47.6%) 111.1 (40.9%) 384.3 (45.5%)
Total employed in formal sector enterprises (all
sizes) 511.8 (89.2%) 227.8 (84.0%) 739.7 (87.5%)
Total employed in informal sector small-scale
enterprises 61.7 (10.8% 43.5 (16.0%) 105.2 (12.5%) All sectors employees 431.4 (100.0%) 180.3 (100.0%) 611.7 (100.0%) Formal sector employees 234.1 (54.3%) 84.2 (46.7%) 318.3 (52.0%) Upper tier informal sector employees 92.8 (21.5%) 29.4 (16.3%) 122.2 (20.0%) Lower tier informal sector employees:
in formal enterprises (small or large scale) 90.1 (20.9%) 60.4 (33.5%) 150.5 (24.6%)
in informal enterprises (small scale) *14.4 ( 3.3%) *6.4 ( 3.5%) *20.8 ( 3.4%)
Note: * The number of employees in small-scale enterprises is deducted from the average number of employees for the self-employed in each sector. The formal sector small-scale enterprises are defined as enterprises of self-employed using formal accountancy. Their employees may be formally or informally contracted. Employees in informal sector enterprises are considered all informally contracted.
Table 9 is an attempt to evaluate for 1999 the number of employees by the sector and scale of their enterprise. Unfortunately, the NUrIP data were not sufficiently robust to estimate the same for 1989. Nevertheless, Table 9 gives an interesting indication on the employment potential of the informal sector. Estimations of the number of small-scale enterprises, formal or informal, are very close in the NUrIP (233 100, Table 9) and the ILS (232 600, quoted from the ILS report). The percentage of self-employed persons holding lower tier informal enterprises is lower in Nairobi (36.2%, i.e. 84 500 according to the NUrIP) than it is for all urban areas (58.7% according to the ILS)2. Using the retrospective data from the NUrIP, we were able to estimate the number of employees for each category of small-scale enterprises using the average number of employees for each self-employed respondent. Formal small-scale enterprises employ on average 1.39 employees compared to only 0.25 employees for informal small-scale enterprises, where the activity generally reduces to self-employment. On average, small-scale enterprises of all sectors employ 0.98 employees on average according to the NUrIP. This estimate compares to a rate of 0.55 employees on average per small-scale enterprise as measured in the ILS for all urban areas3 and to 0.47 for Nairobi only. The ILS estimated 108 400 employees in small-scale enterprises, as against 227 400 in the NUrIP. It is difficult without further detail of the methodology used in the ILS, to explain the discrepancy with NUrIP estimations.
The employers (or self-employed) in Africa usually form a significant part of the informal sector employment than they do in the formal sector. It does not seem to be the case in Nairobi. Contrary to expectations, the new small-scale firms that were supposed to sprout in the informal sector as a result of the economic crisis are actually mainly found in the formal sector: 64% of the self-employed in Nairobi hold a formal business (using written accountancy) and they employ 10 times more than the self-employed in the informal sector.
What is remarkable is that a great majority (150 500, i.e. 87.9%) of the 171 200 employees of the lower tier of the informal sector are actually employed by formal or upper tier informal enterprises. It is not possible to know which employees of the lower tier informal sector are employed by small-scale or by medium to large-scale enterprises4. However, it would appear that only a minority (21 thousand out of 150 thousand, i.e. 12.1%) of the lower tier informal sector employees is employed by lower tier informal enterprises (Table 9). They represent 3.4% of employees from all sectors.
Lower tier informal sector employees represented about 28.0% of all the 611 700 wage employees in 1999. It will strike the reader that this proportion is much higher for female employees (37.0%) than for male employees (24.2%), showing the high gender inequalities on the Nairobi labour market. Not only do women have a lower labour participation rate (51% compared to 84% for males) and higher unemployment rate (15.6% against 12.9%) but upon employment a good proportion of the female workers are subjected to lesser social protection through informal contracts.
These evaluations might be subject to the imprecision attached to limited, retrospective data, but they are certainly sufficient to prove that lower tier informal enterprises are not the only enterprises to generate informal sector employment. Although the NUrIP estimate for small-scale enterprise employees is twice as much as previous estimates by the ILS, we found only a tiny proportion of them to be employed in lower tier informal sector. Most of the employees of the so-called informal sector are actually informally contracted by formal large, medium or small scale enterprises. The informal character of the employment contracts as measured through household surveys should not be confused with the sector (informal or formal) of the enterprises.
Our contention is that formal enterprises not only limited access to formal employment but also ‘informalised’ part of their work force, to the extent that many employees in the formal sector enterprises are now informally contracted. The importance of informally contracted employees in
2 The ILS figures for urban areas as a whole show that 41.3% of the operators registered their activity either to the registrar of companies
(4.4%), the Provincial or Local Authorities (31.1%) or to the Central Government (5.8%).
3 According to the ILS, there were 1 217 874 persons employed by 787 992 small-scale enterprises in urban areas.
4 In the NUrIP, the respondents working as employees were not asked about the size or the type of accountancy of the enterprise they
formal enterprises underlines, somehow negatively, the importance of the formal sector. It is without doubt the driving force of Nairobi’s labour market. The growing importance of the lower tier informal sector should not conceal the structural dependency of the labour market to the formal economy. The importance of employees informally contracted by formal enterprises also underlines the inadequacy of public policies regarding informal sector enterprises. They were not successful at encouraging informal enterprises to multiply and grow, nor were they successful at encouraging them to employ more people. On the contrary, formal enterprises still employ a great majority of the work force in Nairobi, but more and more on an informal basis.
3.
MIGRATION, UNEMPLOYMENT AND INFORMAL SECTOR GROWTHOne common hypothesis about urban labour markets in Africa is that mass migration to the city contributes highly to unemployment growth, and also to informal sector growth. To verify this hypothesis we will analyse the first activity of migrants (for the definition of migrants, see section above on the Retrospective data and migration bias) just after their first migration to Nairobi, and also compare their activity before and after their first migration, using the retrospective data from NUrIP. For the sake of comparison between generations, we will do so by controlling for age, i.e. by selecting respondents who migrated between 15 and 30 years old.
The differential opportunities between Nairobi and the rest of the country could create an incentive to migrate if opportunities were better in Nairobi. An urban growth could therefore result from this differential even if unemployment rose in Nairobi. To verify this, we compare the activity before and after the first migration as for unemployment (Table 10) and formal sector share of employment (Table 11).
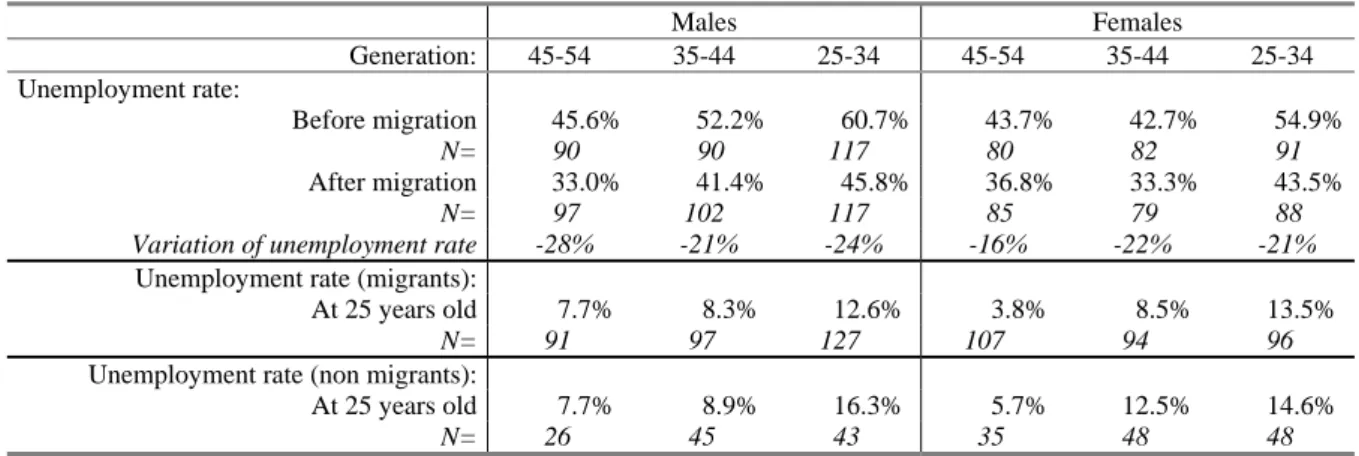
What consequence has the migration had on the activity profile of migrants? Migration has the effect of decreasing the unemployment rate (Table 10). In the older generation of males the proportion decreased by 28%, but as the unemployment rate increased, the benefit of migration is less for the intermediate (–21%) and the youngest generation (–24%). For the female migrants, on the contrary, the gain is less in the older generation (–16% comparable to –28% for males) than in the intermediate (-22%) and younger ones (-21%). However, active female migrants face less unemployment than their male counterparts either before or after migration, but fewer females are active so the impact of unemployment is higher among males.
Of course the above figures are biased toward the successful migrants. Those unemployed migrants who could not find a job in Nairobi probably return to where they belong or migrated elsewhere. Our result should therefore be interpreted with caution. The reduction impact of migration on the unemployment rate is overestimated due to selection bias. However, the results certainly indicate that migration did not increase unemployment among migrants, although we cannot conclude that the unemployment differential in and outside Nairobi is great enough to alone explain the migration of male and female labour. Even more important, the advantage of migration did not change much from one generation to the other even though the unemployment rate increased substantially from the 1970s to the 1990s.
In addition to the above, the unemployment rate is no higher than for non-migrants. In Table 10 and 11, we compare the situation of migrants and non-migrants at the age of 25 years old. Table 10 shows that the unemployment rates are remarkably similar for male migrants and non-migrants, except in the younger generation where it seems higher for non-migrants. For females the unemployment rates are constantly higher for the Nairobians.
Table 10: Unemployment rate before and after migration (migrants between 15 and 30) as compared to non-migrants by generation and sex
Males Females Generation: 45-54 35-44 25-34 45-54 35-44 25-34 Unemployment rate: Before migration 45.6% 52.2% 60.7% 43.7% 42.7% 54.9% N= 90 90 117 80 82 91 After migration 33.0% 41.4% 45.8% 36.8% 33.3% 43.5% N= 97 102 117 85 79 88
Variation of unemployment rate -28% -21% -24% -16% -22% -21%
Unemployment rate (migrants):
At 25 years old 7.7% 8.3% 12.6% 3.8% 8.5% 13.5%
N= 91 97 127 107 94 96
Unemployment rate (non migrants):
At 25 years old 7.7% 8.9% 16.3% 5.7% 12.5% 14.6%
N= 26 45 43 35 48 48
Table 11: Formal sector share among occupied migrants before and after migration (migrants between 15 and 30) as compared to non-migrants by generation and sex
Males Females
Generation: 45-54 35-44 25-34 45-54 35-44 25-34 Formal sector share (migrants):
Before migration 26.5% 25.6% 26.1% 37.8% 36.2% 46.3%
N= 49 43 46 45 47 41
After migration 43.1% 35.0% 25.4% 48.1% 44.2% 30.6%
N= 65 60 63 54 52 49
Variation of formal sector share +62% +37% –3% +27% +22% –34%
Formal sector share (migrants):
At 25 years old 70.7% 59.5% 50.0% 75.0% 67.9% 53.7%
N= 82 84 104 100 84 82
Formal sector share (non migrants):
At 25 years old 58.3% 61.5% 50.0% 59.4% 77.5% 68.4%
N= 24 39 32 32 40 38
Despite higher unemployment rates just after migration in the city, it is possible that migrants are driven by better employment prospects for at least two reasons. First they can get quality employment (in the so-called formal sector), and second, they can get them quickly. As for the quality of employment, Table 11 shows that whereas the same proportion (about 26%) of occupied male migrants were engaged in formal employment before migration, a larger proportion of the same migrants found themselves in formal employment after migration in the older (+62%) and intermediate (+37%) generation, contrary to the youngest generation (-3%). Female migrants were less occupied than their male counterparts, but more so in the formal sector whether before migration (36% to 46% depending on the generation) or after migration (31% to 48%). However the proportion increased after migration by only 27% in the older generation and by 22% in the intermediate, while it decreased—more dramatically than for males—by 34% in the youngest generation of female migrants. Similar to the unemployment rates, the repartition by sector might be biased towards the successful migrants, the others having been rejected from the Nairobi labour market. The size of the sample is also small. However, it can be tentatively said that migrants to Nairobi were attracted mainly by better employment prospects, but that the advantage brought by migration seems to disappear or even to reverse in the youngest generation.
Table 11 shows another interesting feature: regarding employment status at 25 years old (before which most migration took place) the migrants do not seem particularly more involved in informal activities than non-migrants. Actually, the migrants of the older generation whether male or female are more involved in formal activities at 25 years of age than the Nairobians. In the intermediate and younger generations of males, the proportion involved in formal activities is remarkably similar for migrants and non-migrants, and is declining for both in the younger generation. It is only for females that the
formal sector share is higher for Nairobians, but the decline in the younger generation is also observed for both migrants and non-migrants.
As mentioned earlier, not only might migrants get better jobs than they had before migration but they might get them soon after they migrate. It is not possible using available data to determine the speed at which new entrants in the labour market find a job for different parts of the country. However, the NUrIP allows such an analysis for migrants (Table 12) and non-migrants (Table 13) in Nairobi.
Table 12: Time to first employment in Nairobi for the city-born or migrants before 15 years old (Nairobians) by generation and sex
Males Females
Age group: 45-54 35-44 25-34 45-54 35-44 25-34 Proportion having a first employment
before: 20 years old 46% 39% 42% 39% 40% 23% 25 years old 89% 84% 75% 79% 69% 62% 30 years old 95% 94% 82% 85% 84% 73% Age at first employment in Nairobi:
First quartile 18.8 18.5 18.7 19.0 18.2 20.1 Second quartile (median) 20.1 20.7 21.4 21.0 22.2 22.8
Third quartile 20.9 23.6 24.4 24.8 27.0 32.7 Number of person-years at risk 174 323 342 400 504 629
Table 13: Time to first employment in Nairobi for the migrants by generation and sex
Males Females
Age group 45-54 35-44 25-34 45-54 35-44 25-34 Proportion of migrants non-
employed just after migration: 54% 63% 60% 74% 73% 78% Proportion of non-employed migrants
who got employed:
5 years after migration 70% 73% 65% 48% 60% 48% 10 years after migration 91% 91% 82% 71% 67% 63% Number of years before first employment
in Nairobi:
First quartile 0.3 0.4 1.4 2.3 1.3 2.1 Second quartile (median) 3.0 2.7 3.1 5.3 3.3 5.3
Third quartile 6.6 5.7 6.6 12.9 16.7 n.s. Age at first employment in Nairobi:
First quartile 16.7 17.9 16.4 17.1 18.1 15.6 Second quartile (median) 19.2 19.3 20.0 20.9 20.6 20.6 Third quartile 22.2 22.7 22.9 24.4 24.2 25.9 Number of person-years at risk 352 336 356 1437 854 786
The median age at first remunerated employment (excluding apprenticeship) is reported in Table 12 for the Nairobians. The log-rank test of equality of the transition functions shows a significant difference only between the younger generation and the two older generations of males (at the 10% level) and females (at the 5% level). However small the sample, we can see that there has been a delay in entering the labour market for the younger generation of Nairobian males. About 95% of the two older generations of men were employed by the age of 30 years, whereas there were 82% in the youngest. Similarly, there was also a decrease in the intensity of entry into the labour market of women, from 85% employed by 30 years old in the two older generations to 73% in the youngest generation.
Table 13 shows the time taken by migrants to find their first employment from the moment of their first migration into Nairobi. The migrants who were employed upon arrival in Nairobi are excluded from analysis because they may have been offered an employment while still outside Nairobi or simply by appointment from their employer. In other words, they are considered as being at risk outside Nairobi, their migration being a consequence of the new employment (or the new location of the same employment). In our analyses of access to employment in Nairobi, we are interested in the