HAL Id: tel-01565895
https://pastel.archives-ouvertes.fr/tel-01565895
Submitted on 20 Jul 2017HAL is a multi-disciplinary open access
archive for the deposit and dissemination of sci-entific research documents, whether they are pub-lished or not. The documents may come from teaching and research institutions in France or abroad, or from public or private research centers.
L’archive ouverte pluridisciplinaire HAL, est destinée au dépôt et à la diffusion de documents scientifiques de niveau recherche, publiés ou non, émanant des établissements d’enseignement et de recherche français ou étrangers, des laboratoires publics ou privés.
Water Transfers in Sub-Micron Porous Media during
Drying and Imbibition Transferts d’eau en milieux
nano-poreux durant le séchage et l’imbibition
Jules Thiery
To cite this version:
Jules Thiery. Water Transfers in Sub-Micron Porous Media during Drying and Imbibition Trans-ferts d’eau en milieux nano-poreux durant le séchage et l’imbibition. Geophysics [physics.geo-ph]. Université Paris-Est, 2016. English. �NNT : 2016PESC1155�. �tel-01565895�
Water Transfers in Sub-micron
Porous Media during Drying
and Imbibition
Ph.D. Thesis - Jules ThieryThesis
presented by
Jules Thiery
to
The Department of Physics in fulfillment of the title of
Doctor of Philosophy in Physics
University Paris-Est, France
Water transfers in sub-micron porous media during
drying and imbibition
Defended on November 25
th, 2016
Jury:
Prof.
Elisabeth
Charlaix
Reviewer
Prof.
Leo
Pel
Reviewer
Prof.
Stephane
Rodts
Examinator
Prof.
Dani
Or
Board President
Prof.
Philippe
Coussot
Director
Acknowledgements
These years spent as a PhD candidate were of memorable adventures and learning experiences; I will be forever grateful to the people who have driven me forward along this project and enabled me to explore freely what I was curious about.
I would like to warmly thank Philippe and Dave for accepting this collaboration, looking back, what a gamble! Thank you for spending the time, awake or asleep for Dave, to teach me how to think and build a reasoning. I am sincerely thankful for your listening, your confidence and your guidance, as well as for sharing your connections and encouraging me to meet and work with a plethora of interesting scientists throughout the globe. I hope this wasn’t a way to take a mental break from the “volcano of ideas” (P. Coussot, 2016) erupting perpetually within your lab.
I would like to markedly thank Stephane for his continuous mentoring, assistance and individual NMR teaching; I particularly enjoyed working with and learning from you. Thanks for answering your phone at dinner times to trouble shoot me with MRI. I also thank Denis C. Murias for similar practice.
One of my adventures lead me to Crete where I worked with Dimitris Vlassopoulos, thank you Dimitris for having me at FORTH, for teaching me your approach and science and your exquisite culinary knowledge.
Indeed, I would like to fervently thanks, Maximilian Zieringer, Tom Kodger, Lloyd Ung, Adruian Perogaro, Ariel Amir, Emmanuel Keita, Xavier Château, Pamela Faure, Peter Lu, Christoph Muus, David Hautemayou and all members of the Weitz and Coussot Lab. for fueling this project with a large majority of good advice, great company and fruitful discussions.
I would also like to thank my friends and my family: Joce, Stephane, Nicole, my grandparents and particularly my parents, my brother and my sister for their uninterrupted love, I dedicated this work to you. Last but not least, I would like to warmly thank Lottie for helping me develop a delightful British accent and Laura for these great moments.
I acknowledge funding from Harvard University and École Nationale des Ponts et Chaussées. I am thankful to Paris-Est University and the French Academy for the awards and fundings. Eventually, I warmly thank the committee of Arthur Sachs scholarship fund, the Fulbright program as well as François Poncet-Sachs for their award, their financial support and the numerous meetings and discussions.
! "!
! #!
!"#$%&'()$*&#!
Be it wood, rock, sand or skin, porous materials are commonly found in nature. Such materials usually contain, in their asperities, moisture in equilibrium with their surrounding environment. This liquid may be subjected to changes in atmospheric conditions such as a variation in temperature, humidity, external pressure or air velocity. Such changes inevitably result in the material losing or gaining moisture to re-establish equilibrium with its environment. These transitioning mechanisms are usually named after drying for fluid removal and imbibition and adsorption for fluid sorption; these phenomena have been extensively studied over the past century.
Familiar to anyone who ever filled a sponge with water and left it to dry, these transitions can affect the aspect, the integrity and the durability of the material. Sometimes, they may also fundamentally change the material’s nature; this particular property is probably the main reason why drying and imbibition are found widely used in industrial processes. In fact, drying applies to a plethora of industry sectors where products are first prepared wet, as this liquid or pasty state enables easy formulation, mixing, and transport, then dried to transition into their final aspect. For the reasons mentioned just above industrial drying may convey technological or productivity issues depending on the nature and purpose of the material, here are a couple examples:
In the building industry, materials such as concretes, plasters or paints etc. are required to dry rapidly to keep up with productivity deadlines on site but also to maintain their integrity to keep their structural or aesthetic properties. Currently, the most effective way to eliminate drying induced defects in these materials, such as cracks, remains to apply extremely slow drying rates; a slow process leaves time to the material to re-equilibrate and dissipate the incremental stresses that builds up during desiccation. However, slowing down evaporation is time consuming and incompatible with a fast material production.
In the pharmaceutical and health industries, traces of solvent residues in pills may cause health problems to patients. Removing these traces of solvents to an acceptable level is difficult, oftentimes because of water retention in the smallest pores.
Recently in the state of art microfluidic manufacturing industry, the need for synthesis of amorphous nanoparticles triggered the use of supersonic air flow to dry droplets fast enough to prevent crystal nuclei formation; such flow rates are difficult to achieve and accurately control. Surprisingly, despite drying applying to advanced applications, in many instances it remains a step empirically controlled which results in industrial drying being energy intensive and to represent 9% of the global energy consumption. Specifically, a significant amount of this energy is used to remove moisture in particulate materials with strongly hydrophilic surfaces or sub-micron pores. Similarly, imbibition is found involved in a variety of industrial processes, in the previous applications, it may be used in the pre-processing phase to formulate wet mixture. Additionally, this mechanism is seen particularly employed in desalination, functioning of nano-porous batteries
! $!
electrodes, electrophoresis, oil recovery, food processing, impregnation, chromatography, agriculture and more. Imbibition is a faster process than drying, its driving mechanism being highly dependent on the structure of the porous network and less affected by the atmospheric conditions. Therefore, the physics of imbibition are rather well documented and the phenomenon considered as model to study liquid flow through capillary forces, especially in sub-micron pores where a great scientific challenge still stands.
The reasons behind the little knowledge in the field of liquid flow in sub-microporous media may stem from the existing challenge in building a model material representative for the physics in the great variety of the real systems; but also the difficulty to observe and measure the dynamics of the confined fluid with microscopy technics. Due to the high impact of this particular field on energy consumption in scattered industrial applications, it is crucial to gain greater understanding over the physics of drying and imbibition in confined porous media.
This manuscript aims at contributing to the understanding of the physics behind the kinetics and the flow of water in sub-micron porous media, with a strong focus on the transition from micron sized to nano sized pores; it also to opens up new research perspectives in this field. This research is based on the study of drying and imbibition in model porous materials we specifically engineered to cover the need of a generalist approach. The model aspect of these materials stem from the homogeneity of their internal pore structure, the ability to tune their average pore size and to make them responsive to drying stresses, allowing a variety of deformations such as shrinkage, cracking, delamination etc. to develop and therefore to study. Note other materials are also studied. All materials are examined under a series of MRI imaging technics and may benefit from Electron Microscopy imaging (EM). Finally, this research was driven by two main purposes: gaining greater understanding in the phenomenon observed and quench a personal curiosity. This manuscript develops along the following lines:
To clarify the scientific positioning of this study, the first chapter consists in reviewing the current understanding of the physics of drying in porous media initially saturated with water or a single phase of pure liquid and the physics of spontaneous imbibition in porous media.
The second chapter focuses on describing the materials synthesized and used, as well as the functionalities of the set-ups we built and the functioning of the measurement tools we used. The third chapter of this thesis aims at bringing understanding to the kinetics of drying induced by sample deformations (cracking, shrinking etc). This section particularly features the analysis and modelling of the drying kinetics of homogeneous nano-porous gels, being highly responsive to drying stresses; as well as the a study of drying in sponges exhibiting various pore size distributions and special surface properties.
The fourth chapter consists in presenting the advance we achieved in the understanding of fluid transfers and vapor removal in submicron porous media during drying. We present a multiscale approach enabling to compare between the drying behavior of 10 model porous media each of them exhibiting a homogeneous structure with an equivalent pore size ranging from a few microns to a couple of nanometers.
! %!
Eventually, the fifth and last chapter of this manuscript reveals some new mechanisms for spontaneous imbibition in submicron materials, specifically probing the possible influence of liquid films or adsorption on the imbibition kinetics; this last piece of work opens up new perspectives for the study for the imbibition process in nanoporous media.
! &!
+(,,-%.!
"#$%&'()$*&#!/////////////////////////////////////////////////////////////////////////////////////////////////////////////////////!0! !
12-3$4%!5!6!+$-$4!&7!$24!-%$!///////////////////////////////////////////////////////////////////////////////////////////////////////////////////!8!
A - Basic concepts behind the physics of drying of pure solvents in model geometries ...9
1 - Evaporation from an air-water interface ...9
2 - The mechanisms of moisture transport in a dry region. ...11
i. Case of a large cylindrical tube ...11
3 - Effect of capillary forces and surface roughness on drying kinetics ...12
i. Wettability ...12
4 - Capillary pressure, Bond and Capillary Number ...14
5 - Disjoining Pressure for thin liquid films ...15
6 - Case of a square cross-sectional tube ...16
B - Basic concepts behind the physics of drying for porous media ...19
1 - Architecture of a porous media ...19
2 - Darcy’s law ...19
3 - Models for Permeability ...20
i. Permeability for a fully saturated porous media ...20
ii. Permeability for a partially saturated porous media ...21
4 - The mechanisms of moisture transport through coarse porous structures during drying ...22
i. Historical understanding of the physics of drying in porous materials ...22
5 - Drying regimes and water distribution for free water ...23
i. Induction period and isotherm drying ...23
ii. The constant rate period ...23
iii. The Falling rate period ...25
6 - Effect of pore size on drying regimes ...27
7 - Effect of pore size distribution on water distribution within the sample ...28
8 - Liquid films, surface forces and viscosity ...29
9 - Drying stress and sample deformation for wetting porous media ...30
10 - Shrinkage and wrapping ...31
11 - Cracking ...32
C - Basic concepts behind the physics of spontaneous imbibition of pure liquids in hydrophilic nanoporous media ...33
1 - Description of the phenomenon ...33
i. Capillary rise and Lucas-Washburn equation ...33
2 - Spontaneous imbibition in Nano-pores ...35
i. Validity of Lucas-Washburn equation in nano-pores ...35
ii. Fluid flow in nanopores ...36
iii. Front broadening ...37
D - Positioning of this study ...39
! ! !
! '! 12-3$4%!0!6!9-$4%*-:;!-#'!94$2&';!////////////////////////////////////////////////////////////////////////////////////////////////////!<5!
A - Measurement tools ...41
1 - SEM and TEM Imaging ...41
i. Technology ...41
ii. SEM imaging in practise ...42
iii. Sample preparation ...44
2 - Nuclear Magnetic Resonance techniques ...45
i. Principle of NMR measurements ...45
ii. Free induction Decay ...46
iii. The measurement of !" : Spin Echo ...47
iv. NMR Relaxometry, pore sizes and CPMG sequence ...48
v. 1D profiling ...50
vi. High resolution for 1D profiling ...52
vii. Smoothing method for 1D profiling ...53
B - Materials ...55
1 - Synthesis of model nano-porous soft gels ...55
i. Aggregation of colloidal particles ...55
2 - Structure of gels ...59
i. Evolution of the pore network during gel contraction ...59
ii. Gels substrates ...61
iii. Strain sensitive substrate ...61
3 - Synthesizing model porous media ...61
i. Viscous sintering, from gels to homogeneous porous media ...61
ii. Protocol for large particles ...63
iii. Pore size distribution in model porous media ...63
4 - Sponges ...66
i. Surface properties ...66
ii. NMR analysis ...66
iii. Macroscopic pore size distribution ...67
iv. SEM Imaging of the porous structure ...69
v. Sponges structures and relaxivity ...70
C - Set-ups ...71
1 - Drying set-ups for gels and sponges ...71
i. Regular drying ...71
ii. Drying set up in the MRI ...71
iii. Imaging strain during drying ...72
2 - Critical point dryer ...72
3 - Imbibition set-ups ...73
i. Regular imbibition ...73
ii. Imbibition within the MRI ...73
! ! ! ! ! !
! (! 12-3$4%!=!6!>%.*#?!@*#4$*);!&7!'47&%,-A:4!#-#&63&%&(;!?4:;!-#'!;3&#?4;!/////////////////////////////////!B<!
A - Drying kinetics of deformable model nano-porous gels ...74
1 - Drying rate for deformable nano-gels ...74
i. Drying protocol specific to this study ...74
ii. Drying curves ...74
2 - Macroscopic phenomenology ...77
i. The different phases of drying of shrinking and/or fracturing gels ...78
3 - Evolution of the water content within the gels during drying ...80
i. Measurement of the water distribution ...80
ii. Scheme for gel saturation ...81
i. Deformations and drying regimes ...83
4 - Measurement of the material deformation during drying ...83
i. Delamination ...83
ii. Shrinkage and first crack regime ...85
iii. Second crack regime ...87
iv. Spiral cracks ...87
5 - Origin for sample deformation ...88
i. Delamination ...88
ii. Suggested origin for cracks in the different cracking regimes ...89
6 - Deformations influencing the drying rate ...91
7 - Numerical simulation and modeling of the influence of the first crack regime on the drying rate ...92
i. Distribution of the airflow velocity ...92
ii. Modelling ...93
iii. Model predictions ...95
8 - Influence of the second crack regime on the drying rate ...99
i. Crack density on drying kinetics ...99
9 - Conclusion on the section ...101
B - Study of Sponges during drying, a model deformable porous media with a wide pore-size distribution ...102
1 - Drying curves ...102
i. Reproducibility of the measurement ...102
ii. Influence of airflow velocity on the drying mechanism ...103
i. Influence of surface affinity on drying kinetics of the blue sponge ...104
2 - Macroscopic deformations ...104
3 - Drying Scheme ...105
4 - MRI study of the water distribution within the sample during desiccation ...106
i. MRI sequence ...106
ii. Distribution of water in the green sponge ...106
iii. Distribution of water in the blue sponge ...108
5 - Scheme for the drying kinetics ...109
6 - Study of the drying mechanism through pore emptying dynamics ...110
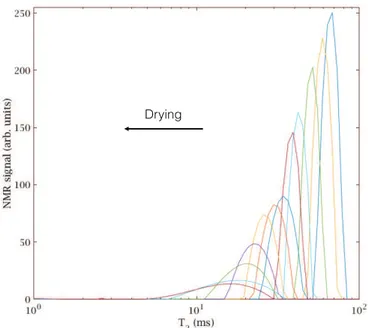
i. Evolution of the !" spectrum during drying ...110
7 - Analysis of pore emptying dynamics ...111
i. Global !" ...111
ii. 1D profiles and Local dynamics ...111
iii. Macroscopic measurement, optical microscopy ...113
iv. Capillary equilibration process ...114
8 - Wet imaging for the blue sponge ...115
! )! C - Conclusion ...117 ! 12-3$4%!<!6!>%.*#?!%4?*,4;!*#!2&,&?4#4&(;!3&%&(;!,4'*-!7%&,!,-)%&!$&!#-#&6;)-:4!///////////!55C! 1 - Experimental details ...118 i. Protocol ...118
ii. Physical framework ...118
2 - Observation of the water distribution with varying pore size ...118
i. Scheme for water distribution during drying varying bead sizes ...122
3 - Drying rate ...122
4 - Analysis of drying regimes ...123
i. From water distribution to drying regimes ...123
ii. Measurement of the apparent dry region ...124
iii. Quantitative considerations for drying regimes ...125
iv. Knudsen diffusion for vapor transport through the porous network ...126
v. Kelvin Effect in nano-pores to explain the drying kinetics ...127
5 - Analysis for water distribution ...129
6 - Conclusion ...129
! 12-3$4%!D!6!+3&#$-#4&(;!*,A*A*$*&#!*#!;(A,*)%&#!3&%&(;!,4'*-!///////////////////////////////////////////////!5=5! 1 - Macroscopic study ...131
i. Phenomenology ...131
ii. Imbibition curves and reproducibility ...133
2 - Analysis of the imbibition curves ...134
3 - MRI evidence of the evolution of water content during imbibition ...136
4 - Analysis of the MRI data ...138
i. Front dynamics ...138
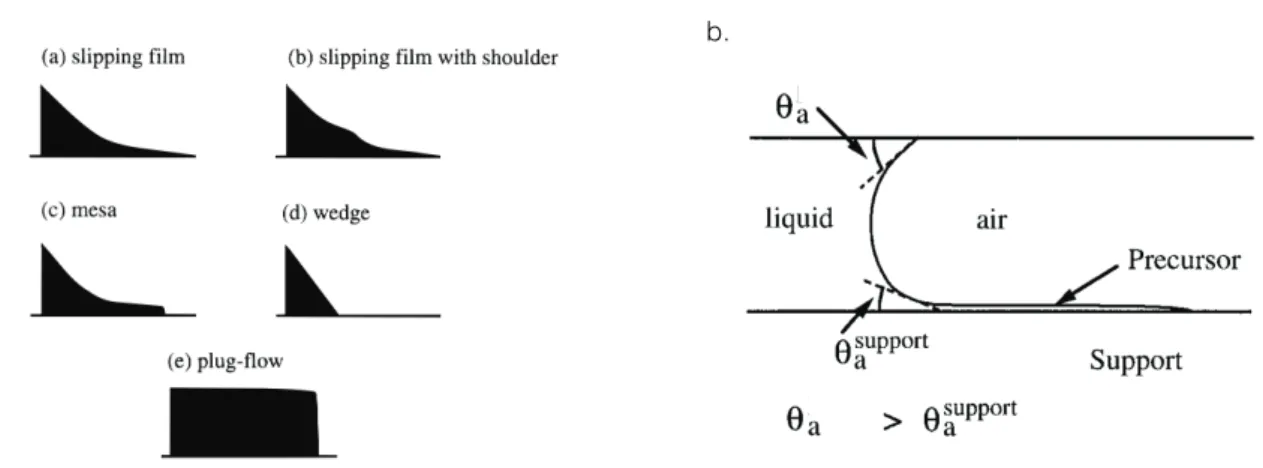
ii. Shape of the partially saturated front ...140
iii. Opalescence ...142
5 - Analysis at low moisture content ...143
i. Evidence of precursor films ...143
ii. Influence of initial liquid films on the imbibition dynamics ...144
iii. Scheme for the influence of precursors films on imbibition dynamics ...145
6 - Conclusion and perspectives ...146
1&#):(;*&#!-#'!;(??4;$*&#!//////////////////////////////////////////////////////////////////////////////////////!5<B! E474%4#)4;F!/////////////////////////////////////////////////////////////////////////////////////////////////////////////////!5DG! H##4I4;!//////////////////////////////////////////////////////////////////////////////////////////////////////////////////////!5DB! 1 - Pore size analysis software ...157
2 - Image and mass acquisition software ...157
3 - NMR measurement parameters Chapter 2 sponges ...159
4 - NMR 1D profiling measurement parameters Chapter 4. ...160
5 - Dimensions of the samples presented in Chapter 5, Fig5-2 ...161
! *!
!
!
12-3$4%!5!6!+$-$4!&7!$24!-%$!!
This first chapter aims at probing the scientific advance in the different fields we decided to investigate and explain the theoretical knowledge currently reached through the study of applied systems.
H!6!J-;*)!)&#)43$;!A42*#'!$24!32.;*);!&7!'%.*#?!&7!3(%4!;&:K4#$;!*#!,&'4:! ?4&,4$%*4;!!
In the present section we describe the existing knowledge of the physics of water drying in atmospheric conditions within tubes with various geometries and a porous media.
1 - Evaporation from an air-water interface
Evaporation is a vaporization phenomenon and is the driving mechanism for water removal during spontaneous drying porous media filled with water. It occurs from the surface of water into the air, when the latter is not saturated with the evaporating substance. As a matter of fact, air can carry a certain amount of water molecules, this quantity is usually measured in terms of vapor density and denoted #$%&.
Evaporation from a liquid surface will proceed until thermodynamic equilibrium between the liquid and the gaseous phases is reached, i.e. until the air becomes completely saturated with water molecules; in this case, the equilibrium vapor density is reached and #$%& ' #(%). The equilibrium vapor density increases non-linearly with temperature according to Clausius-Clapeyron relation and takes the following values: 7*+ ,-..at 5 ̊C, 23.4/*+ ,-.at 25 ̊C and 150/*+ ,-.at 60 ̊C. From the ratio between the current to maximum vapor density can be inferred a familiar variable, the relative humidity of the air:
0 ' #$%&
! "+!
Therefore, when 0 5 3661, the system is out of equilibrium and water molecules diffuse from the surface of the liquid to the air, leading to a mass transport phenomenon toward the dryer region described by Fick’s Law as:
/78 ' 9:;+ <#/ 3+"
where :; is the diffusion coefficient of vapor water through the air; at 25 ̊C, :; ' "+=+ 36->/,?+ @-A. Desiccation can be a very slow process therefore its study often requires to accelerate the rate of evaporation of the liquid; for this purpose, air is often blown at the sample surface; this is called convective drying (see Fig1-1).
Figure 1-1 : Scheme of evaporation for convective drying of a water, air is blown parallel to the air-water interface.
When an air flux is blown over a wet surface S, water molecules are removed rapidly from this wet surface resulting in an acceleration of the evaporation process. Seen form a fluid dynamic perspective, blowing air alongside a wet interface in a laminar regime leads to the formation of a gradient in air velocity, perpendicular to this surface [7]. If the vapor density of the air blown #$%& ' #; is inferior to #(%), a gradient in vapor density appears within this boundary layer, [8], see Figure 1-1. For drying considerations a rough approximation [9, 10], consists in considering that this vapor gradient is constant in a region of thickness δ of the order of this boundary layer while the vapor density (#;) is maintained constant in the region of nearly uniform velocity (see Fig1-1). In that case, from (Eq1.1 and Eq1.2), we obtain the following expression for the rate of evaporation BC (in D+ E-A4: BC ' F #G ' :;+ #(%) #G + 20 9 34 H 3+I
Where #G ' 3666JK+ D-. is the liquid water density and 0 the relative humidity of the convective air (see Eq1.1). This approximation well describes the drying rate recorded for any type of wet material put to dry when their surface exposed to the airflow remains covered by a significant layer of liquid water, but not only. In fact, Suzuki and Maeda [10], showed that the drying rate of a uniform liquid sheet and its counterpart presenting dry patches at its surface, can be identical if the
Velocity vector
Air + Vapor, ρsat Free stream, ρvap
δ
! ""!
spacing between dry patches remains greatly inferior to L. Therefore, (1.3) is verified as long as L remains greatly superior to the characteristic length of the surface roughness or heterogeneities.
2 - The mechanisms of moisture transport in a dry region.
Although a porous medium with its hierarchy of pore diameters and junction structures is clearly much more complex than a cylindrical tube, the consideration of an individual channel as a model system to understand basic transport phenomena has often proven to be a useful and relevant model, [11]. In this section, we first describe the mechanism of transport in a circular tube during drying; we further consider a polygonal tube and probe the effect of the corner of the geometry on the drying process. This step by step approach enables to study individually crucial phenomena playing roles in the drying kinetics of porous materials.
i. Case of a large cylindrical tube
Figure 1-2 : Scheme of convective drying from a cylindrical tube. A boundary layer of thickness L forms at the tube entrance where air is blown
The system is a circular tube of length M;/and cross section N;/as sketched in Fig1-2, the tube diameter is large enough so that the liquid-gas interface can be considered flat at all time, i.e. presenting no curvature. O/is the height of the air-water interface measured positively from the to the top to the bottom of the tube. Low vapor density air, #;, is blown perpendicularly to the tube at its open end giving rise to the formation of a boundary layer of thickness L at this location. In these conditions, drying is seen to drive the air-water interface to recede within the tube; therefore, the distance a molecule of vapor water needs to travel to exit the system is L P O. From the previous section we can express the drying rate of the tube and the evolution of the interface height with time: Z L 0 δ Air Water Vapor + Air
! "#! BC ' 3 N;+ QD QR ' :;+ #(%) #G + 0 9 3 H P S / 3+T
with D ' #G+ N;+ 2M; 9 O4 being the mass of liquid water remaining in the tube. We therefore deduce the following differential equation for Z:
#G?+ QO
QR+ L P O ' :;+ #(%)+ 0 9 3 3+U
and the solution is:
O R ' ":;#(%)
#G? 0 9 3 + R P L ?9 L
Remark that as soon as the height of the dry region becomes greater than/L we can make the following approximation O P LVO, and the equation (1.5) becomes
#G?+ QO
QR+ O ' :;+ #(%)+ 0 9 3 Finally, the solution is:
O R ' ":;#(%)
#G? 0 9 3 + R
We observe O W / R, which shows that a diffusion process takes place for the development of the dry region; note that the drying rate evolves inversely proportional to the square root of time : XY
X) W A
).
3 - Effect of capillary forces and surface roughness on drying kinetics
When the diameter of a tube is decreased to a couple of micrometers or the geometry of the tube presents angle, a substantial curvature of the air-water interface is observed. This curvature originates from the affinity between each component of this liquid-solid-gas system and defines the wetting property of a solid surface by the liquid. Wettability is a crucial parameter that governs moisture flow in porous media; it is oftentimes studied through the shape a droplet adopts when put in contact with this surface.
! "$!
As articulated by Young, when a small liquid droplet is put in contact with a flat solid surface at given temperature and pressure, two different equilibrium situations may be found depending on the value of the contact angle ZG observed (see Fig1.3). Specifically: partial wetting with ZG [ 6 (see Fig1.3a and b) or complete wetting when ZG ' 6/(see Fig1.3c).
Figure 1-3 Schematic showing a sessile droplet on a flat solid substrate exhibiting (a) and (b) partial wetting, (b) stronger wetting than (a); (c) complete wetting. On the right side of each droplet is the conventional force balance used to derive Young’s equation.
If partial wetting is encountered, a three-phase contact-line forms between the solid, liquid and the equilibrium vapor phase. The corresponding equilibrium angle is determined by a balance of solid-vapor, \]^, solid-liquid_ \]`, and liquid-vapor,//\`^, surface tensions (thermodynamically defined as the respective free energy per unit area for each interface, [12]). This equilibrium can be written, as a projection on the x axis (see Fig1.3), as follow:
\]^9 \]`9 \`^+ ab@ ZG ' 6 3+c
At 25°C and atmospheric pressure, the surface tension for water is \`d/= 71.97 De+ D-A, this value decreases with increasing temperature. For water, a wettable surface, also termed hydrophilic, corresponds to ZG f 90° whereas a non-wettable surface, hydrophobic, corresponds to ZG 5/90°. In the following array we present examples for contact angles on rough surfaces for a water droplet on well-known materials:
Phases (L-S) Contact Angle θw
Water - Teflon ~110º Water - Glass ~110º Water - Silica ~180º
Table 1-1 : Values for the contact angle observed for water on well-known materials, [13].
As described by Wenzel, [96], the contact angle observed for a liquid on a flat solid surface greatly depends on the roughness of this surface, for instance a polished Teflon exhibits a 180° contact angle with water in air [13].
x z S L V γLV γSV γSL θw γLV γSV γSL S L V L V S L V S θw S a. b. c.
! "%!
4 - Capillary pressure, Bond and Capillary Number
When water wets the walls of a sufficiently narrow circular tube (of radius r), the interface between air and water presents a curvature define by gh the radius of the corresponding sphere: a meniscus is formed (see Fig1.4).
Figure 1-4 : Shape of the air-water interface in a capillary tube filled with water and made of hydrophilic walls.
The pressure drop across this interface verifies the Young-Laplace relation:
ij '"\`^ gh '
"\`^ab@ ZG
g 3+=
Often, for systems presenting strong wetting, the effect of surface tension on the shape of an liquid/air interface is likely to dominate the effect of gravity, this trend is assessed from the dimensionless Bond Number, defined as [14]:
kl ' i#+ K+
M?
\`^ 3+m
Where/i# is the difference in density between the two phases at the interface, K is the gravitational acceleration and M the characteristic length of the system. A high value of the Bond number indicates that the system is relatively unaffected by surface tension effects whereas a low value (typically less than one) indicates that surface tension dominates.
Surface tension forces may also compete with viscous forces when liquid flows (at a velocity B); it is of particular importance when liquid draining occurs through tiny films, as seen in the following section. For this reason, the capillary number quantifies the relative effect of viscous forces versus surface tension acting across a liquid and gas interface.
no ' pq \`^
θ
w2r
r
c! "&!
Where p is the dynamic viscosity, physically pointing at the resistance of a fluid measured from its gradual deformation. This value is temperature dependent; for water pG ' m+r6/s/36-t/jo/at 25°C
5 - Disjoining Pressure for thin liquid films
Capillary pressure is not the only force one may encounter from wetting a surface. When a thin liquid layer ranging from fractions of a nanometer (monolayer), to several micrometers in thickness, wets and spreads on a surface, surface forces set up an additional pressure, the disjoining pressure, u. It defines the force of molecular interaction (per unit area) of bodies that are separated by a thin plane parallel interlayer. A positive value of v corresponds to repulsion and a negative value to a confinement. B.D.V and Kusakov measured the thickness of the equilibrium wetting aqueous film that forms when a gas bubble is pressed against a glass plate immersed in the liquid. In that case, u is the difference between the pressure in the thin film of liquid adjacent to the glass surface and that in the air interface, [15, 16], and is expressed as:
u ' 9 w
cxyz. 3+r /
Where z is the film thickness, A is the Hamaker’s constant, w ' x?{#%#| defining the Van der Waals interaction between water and the solid surface with #%/and #|/the number of atoms per unit volume in the two interacting bodies; finally, C is a coefficient depending on the pairing interaction between particles. For a glass-water interface w} 3+=+36-?;~; for a silica-water interface w } 6+mU+36-?;~ .
Previously, we studied evaporation in a large cylindrical tube where capillary effects can be neglected as the air-water interface simply slides at the tube walls. Let’s look at how capillary forces influence on the liquid distribution in a slightly more complex geometry i.e. a square tube.
"'!
6 - Case of a square cross-sectional tube
In a porous media, pores are often considered as cylindrical tubes in analytical or computational studies but such simplification prevents the capture of the rich phenomenology associated to the roughness or corners of the solid matrix. Considering the pores geometry is crucial to realistically study capillary flow, accurately estimate liquid and vapor distribution and thus find the origin of the drying rate recorded. Drying a cylindrical and a polygonal tube leads to different results owing to the different liquid distribution along the tube walls (see figrue1.6), [17, 18].
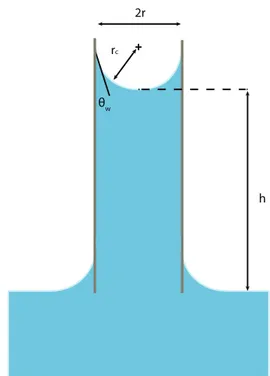
Figure 1-5: (a) Side view of the air-liquid interface in the square tube (c) between the dashed line and the top of the tube; (b) Scheme of tube cross section (dashed line) in (c);
g; is the curvature radius of the tube’s rounded corners, gh is the in-plane curvature radius
of corner menisci, and w is the thickness of the corner film, [9]. (b) 3D view of the air-liquid interface receding in the tube during drying.
Drying a solvent in a square tube results in the liquid interface pining the corner walls while the bulk menisci recedes toward the bottom of the tube (see Fig1-5). An almost similar situation as the one encountered for a cylindrical cross section; however, in identical drying conditions, the
total desiccation time for square geometries appears much shorter (see Fig1.6). This sharp
difference stems from the development of corner films that, when thick enough [19], provide a pathway for transporting the liquid from the receding bulk meniscus up to the film tips. Prat and al. [18], followed the location of the film tips along desiccation and found the existence of 3 different dynamic regimes associated to the corner films thickness :
"(!
Figure 1-6: Comparison of the evolution of the menisci location during drying of circular
(bottom curves, see graph) and square section capillary tubes, [18]. Here •; is the location
of the bulk menisci and d the width of the tube.
Fig1-6 presents the evolution of the location of the bulk menisci with time and indicates crucial moments related to the evolution of the corner films. We observe that in a first regime (R1) the level of the bulk interface recedes into the tube linearly with time (see Fig1-6), in parallel, thick liquid films pinning the tube entrance develop in the corners of the geometry (as sketched in Fig1-5c) and are seen to progressively thin down with desiccation (see Fig1-7b, black curve in the main graph). For low Bond numbers, gravity effects on the interface curvature are neglected and its shape can be considered identical to its quasistatic counterpart, [20]. Accordingly, the interface’s
radius of curvature may be expressed as gh ' Q€I+==, where d is the width of the tube (see
Fig1-5b), and therefore the films thickness as • ' " 9 3 + gh 9 g; , [18]. Further drying triggers the
transition to a second regime (R2); in this regime, the main menisci slows down and the liquid films depin the entrance of the tube (see Fig1-6 at “depinning”). This regime essentially constitutes
a transition phase to the third regime: (R3) where O; (the location of the bulk menisci) simply
recedes as the square root of time (see inset of Fig1-6), similarly to the situation of a cylindrical tube. Let’s see how this 3 step process compares in terms of vapor removal and therefore drying rate.
Figure 1-7: (a) Simulation of the distribution of vapor within a polygonal tube during the first regime (R1) identified in (b); the x axis represent the height of the tube in mm, black continuous lines represent the iso-surface for vapor density and dashed lines the location
of the menisci; here/RAf R?, [21]. (b) Rescale drying rate (‚€‚;/is the ratio of the current
0 5000 10000 15000 20000 25000 30000 t(s) 0 5 10 15 20 25 30 35 z0 / d 0 50 100 150 200 t0.5 0 5 10 15 20 25 30 z0 / d heptane 2-propanol heptane
2-propanol (circular tube) (circular tube) depinning
")!
to initial drying rate) as a function of the average liquid saturation of the tube (S) for a square tube, and evolution of the rescaled thickness of the corner films w (see text), [17].
As a first step toward greater understanding of the origins of variations in the drying rate recorded, it is necessary to look at how the vapor distribute in the system during the process. In Fig1.7a, we present the evolution of the vapor density field with time, calculated from 2D finite element modelling, [21]. This distribution shows that the gas phase within the tube, between the bulk menisci to the films tips is saturated with vapor except in a region very close to the tip of the liquid films (see Fig1-8a). Therefore, one can infer from (Eq.1.4) that the vapor transport by diffusion in the gas phase is only significant in the film tip region (where the gradient is the highest). Finally,
the linear evolution of O; (the location of the bulk menisci) with time in this regime (see Fig1-6a)
indicates that, as long as liquid films are thick enough, water preferentially flows through the films rather than diffuse in the gaseous phase between the bulk menisci to the films tips; in this region evaporation can therefore be neglected and the drying kinetics observed on Fig1-7b may further be explained.
As a first drying regime (R1, see Fig1-7b) a period of slowly decreasing desaturation is maintained until the liquid films depin the entrance of the tube. This shows that as long as liquid films pin the tube entrance, liquid flows to the surface, evaporating from the film tips region. This slow decrease is likely due to the modification of the shape of the air-liquid interface [21], therefore to a modification of the contact angle (see Eq1.7) that entails a drop in capillary pressure at the pinned point, [22] and results in slower drainage. Further drying causes liquid films to become so thin that viscous forces dominate over capillary forces and therefore drainage is prevented, [12]. This latter situation gives rise to a falling drying rate (R2) and a slowdown in menisci rescission (see inset on Fig1-7b). Eventually, thick films depin the entrance of the tube (see Fig1-6) and a diffusive regime (R3) identical to the one we encountered in a cylindrical tube takes over (see inset of Fig1-5). Comparing between the drying kinetics of a cylindrical and square tube, we conclude that for a wetting liquid, the geometry of this tube can play a significant role in the drying kinetics observed; specifically, when a three phase contact line pins the entrance of the tube, liquid films can develop in the corners of the geometry and drain liquid toward it, resulting in a 3 phases drying process.
While increasing the tube roughness (g; ƒ 6 in Fig1-6) have proven to extend of the period of
regime R1, adding corners to the geometry have proven to increase the rate of drying in this regime, [53]; eventually both of these parameters are seen to reduce the total drying time. Considering a porous media as a simple bead packing made of holes and corners at the bead contact points (see Fig1-8), one may foresee that similarity in the mechanism of drying may exist and the importance for an averaging approach over the whole system.
Figure 1-8: Scheme of the interface shape of the liquid wetting a couple of pores in porous media made of a spherical bead packing. Pinning points correspond to the corners of this geometry, [23].
! "*! J!6!J-;*)!)&#)43$;!A42*#'!$24!32.;*);!&7!'%.*#?!7&%!3&%&(;!,4'*-!!
The physics behind drying of a porous media are ubiquitous, universal, and fairly simple. As evaporation proceeds, air progressively substitutes water within the porous structure. Evaporation drives the medium into a partially saturated state, which eventually empties. However, when scrutinized closely, this simple process exhibits rich phenomenology that arouse a plethora of intriguing wonders.
1 - Architecture of a porous media
A porous material is a three-dimensional structure presenting a solid matrix with asperities varying in size and distribution, these asperities are commonly named after: pores. Porous media are characterized by their porosity, denoted „, defined as the ratio between their total pore volume to their overall volume; their pore size distribution (probability density function); their specific surface area and pore connectivity as pores may be inter-connected or isolated.
2 - Darcy’s law
Liquid flows through a porous media is commonly described by Darcy’s law, [26], highlighting a linear relation between flow velocity (… ) and the pressure gradient (<j4/throughout the porous structure. For a directional pressure gradient along the z axis:
… 'J p+
†j
†• 3+36
where p is the dynamic viscosity of the fluid. Note that … is the average velocity throughout a whole sample and …‡ as … ' ˆ+ …‡, the average velocity through the porosity.
#+!
3 - Models for Permeability
i. Permeability for a fully saturated porous media
The porous network of a material can be geometrically modelled to deduce the expression of its permeability:
Figure 1-9: Schematic drawing representing the complexity of flow through a porous solid matrix (by Zbigniew Koza)
When a porous media contains solvent in its pore network, one can define the ratio of the total
volume of the liquid to the total pore volume as the average saturation, ‰. Note that this value
constitutes an average over the whole the porous body. If all the pores are filled, the material is said saturated and ‰ ' 3. For a saturated porous structure made of an homogenous pore size, the permeability is seen to scale proportionally to the square of the pore radius, [9]:
J ' Š „ + g&?
The function F(„4 takes different values depending on the geometric model adopted to describe
the pore network:
Figure 1-10: Scheme for a pore network of a porous media: (a) parallel ducts, (b) Tortuous duct, (c) connected tortuous ducts.
The simplest model consist in modelling a porous media by a series of parallel cylindrical tubes
of radius g& (see Fig1-10a). Under a pressure gradient the flow velocity may be calculated from
the Poiseuille law, [27], and the pre-factor identified as Š&l‹( „ ' „€m. However, this model
remains very basic as it only describes unidirectional flow. Saffman model for porous media constitute a more realistic approach, starting from the previous model and implementing no
restriction in canal orientation with space. In this case, Š]%ŒŒ2„4 ' „€"T ' Š&l‹(€I. The factor 1/3
stemming from the 3-dimensional direction in space, [116].
No flow zone
L L L
! #"!
However, both these models fail to express the tortuous nature of the porous network, illustrated in Figure 1.6.1 by curved streamlines for solvent flow. In fact, for a porous sample of length M, the effective average length for a flow line through the sample is MC f M (see Fig1-8b), the ratio of those two values defines the dimensionless tortuosity,/•, of the porous media :
• 'MC
M f 3 3+33
Note that by definition the tortuosity is always superior to 1. Now taking into account Saffman model and the tortuosity factor, one may compute the new factor F and find/ŠŽ2„4 ' „€"T•?. An more accurate geometric model would consist in adding the distribution of channel size, as of the porous media, for a distribution •2g&4, the permeability is expressed as :
J ' ˆ
"T•? g&?+ • g& Qg&
The limitation of this model falls into the knowledge of the material pore size and its distribution; these quantities being hard to measure accurately. The specific surface, w(, of the porous matrix is however easily measureable, especially when the porous structure is made of a homogeneous bead packing. The Kozeny-Carman model for permeability takes this parameter into account and has shown to be very reliable in a laminar flow regime:
J ' w(g& ?ˆ. 3m6 3 9 ˆ ? '
„.•?‘?
3m6 3 9 ˆ ? 3+3"
where : is the particle diameter and ‘ the sphericity of the particle in the packed bed (‘ ' 3 for a sphere).
ii. Permeability for a partially saturated porous media
When a porous medium becomes partially saturated with liquid its apparent permeability now depends on the permeability dictated from the structure of its solid matrix but also scales with a factor describing the hydraulic resistance of the liquid (’ ‰ 4. This parameter reflects the characteristic draining capability of the liquid network. Note that this implies this network being continuous throughout the whole sample. In this case and for a homogeneous distribution of liquid throughout the sample, J can be expressed as follow, [9]:
! ##!
4 - The mechanisms of moisture transport through coarse porous structures during drying
i. Historical understanding of the physics of drying in porous materials
The very first scientific exploration of the physics of drying started in the 1920s. First, Lewis, [28] in 1921, followed by Sherwood, [29] in 1929, proposed a description of the drying mechanism based on vapor evaporation from the free surface in soap slabs and vapor diffusion through porous clay bricks using Fick’s Law. At that time a main hypothesis relied on the use of a constant diffusion coefficient for vapor appeared for both systems. This hypothesis was only proven wrong by Cunningham, [30] and Moyne, [31] in the 1980. However, already, in 1937, Ceaglske and Hougen, [23], demonstrated the limitation of the previous models highlighting the major role of capillary forces on water flow in granular packings. Twenty years later, in 1957 Philip and De Vries developed the theory for heat flux and thermal conductivity in partially saturated media. The most significant input was probably implemented in 1962 by Krisher, [32], who minutely described the different aspects of capillary transport, equilibrium, diffusion in the gas phase and for the first time highlighted a three step process for the drying kinetics under convective air flow through extensive experimental exploration of different material. In the following years, thermodynamic approaches were built to describe the three different regimes (Ludovik, 1966) and further knowledge was gained on the internal phenomenon (Marle, 1967; Slattery, 1967; Whitaker, 1967; Gray 1975). In the late 1980s Scherer provided extensive theoretical knowledge on drying induced deformation and material failure, [33-38]. Further industrial needs encouraged in 2000 the development of a general scaling approach by Coussot, [9]. And finally, thanks to the development of novel measurement technics and model analogous systems, as polygonal tube, recent research have proven the importance of liquid film flow during drying, Pratt and Yiotis, [18].
Most models describing moisture transport in real porous media (wood, clay, concrete etc.) during drying rely on the differentiation of two regions within the liquid: the bulk region, or non-hygroscopic region, where water is considered free from molecular or surface interaction with the porous matrix and a confined region (hygroscopic) consisting in a thin liquid layer around the pore walls where interactions exist between the liquid and the solid matrix. For water and glass this region was measured to 10nm, [39, 40]. While great understanding was achieved in the physics of drying for free water in large pores, very little understanding remains in the physics of drying at low moisture content, in nano-pores or even for adsorbed water layers.
#$!
5 - Drying regimes and water distribution for free water
Surprisingly the removal of free water during convective drying of a porous media is very similar to the one earlier encountered for a square tube; it is modeled with 3 main periods:
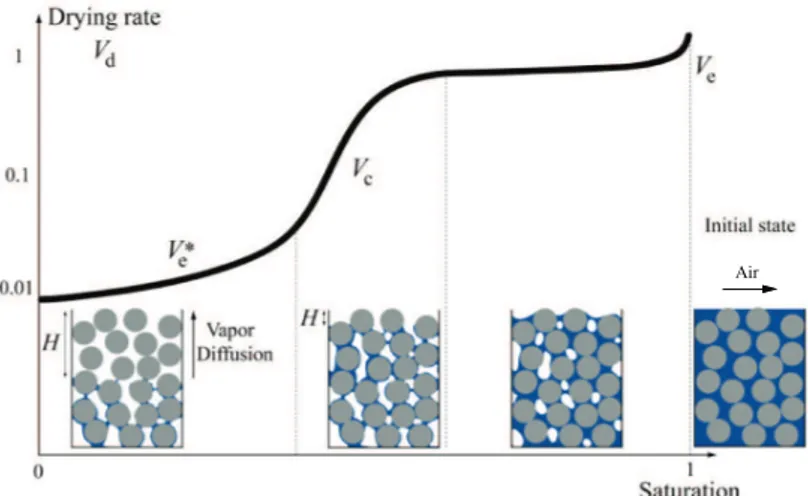
Figure 1-11: Evolution of the drying rate BX matched with the evolution of the water
distribution within the sample for a porous media. Air is blown parallel to the free surface of the sample at all time as pointed out on the far right scheme representing the initial state. H here represents the extent of the dry region forming from the sample free surface.
i. Induction period and isotherm drying
An induction period is observed until the heat and mass transfer processes between the material and the surrounding atmosphere approach an initial steady state (note the very small decrease in the drying rate at the very beginning of the test in Fig1-10) and the boundary layer of thickness L (seen in section 1) has fully formed. The duration of the induction period is usually insignificant compared to the time of the other drying periods. During this short transient regime, the material is considered fully saturated. In this study, drying will be performed at room temperature in isothermal conditions.
ii. The constant rate period
Following the induction period, a constant drying rate is observed as long as the sample free surface is maintained effectively wet. Here the gas-phase mass transfer is determined by the thickness of the boundary layer L and equation 1.1 applies. Evaporation only occurs from the free surface. Therefore, the extent of the constant rate period, depends on the material's ability to keep its surface wet enough, so to say to maintained a liquid network capable to drain enough water through the sample to the free surface for drying to remain boundary layer controlled (see Figure 1-12). For this reason, the water is also said to be in a “funicular” regime.
#%!
Figure 1-12: Liquid phase distribution during evaporation from a sand column obtained by synchrotron x-ray tomography. The arrangement of sand grains and liquid phase within the first scanned block (3.3 x 3.3 x 1.7 mm3) is shown for five time steps. Isolated liquid clusters were filtered out to highlight continuous liquid phase only. [117]. Note that this type of distribution is an example and is specific to the material studied, one can imagine other situations for water distribution, especially a more homogeneous distribution not including complete emptying of pores of network discontinuity, for instance in very hydrophilic porous media.
Liquid flow is triggered by a pressure gradient that develops over a short distance near the sample free surface (measured in the scope of 2.5 times the tube diameter in a polygonal tube system, [23]). In this region, water removal causes meniscus to progressively recede in the pores, increasing the local capillary pressure so that a pressure gradient develops in the sample. MRI profiling measurements presenting the concentration profile of water in the height of a bead packing during drying (see Fig1-12a) shows that during the constant rate period, the water remains homogeneously distributed throughout the whole sample. As a matter of fact, air substitutes water in an abrupt way, its dynamic being depicted by Haines jumps, [41], directing flow from area of higher depression (following depression gradients within the sample), see Fig1-12b. This overall mechanism of water redistribution is named after capillary equilibration process.
t1 t2
t3 t4
100μm
b. a.
! #&!
Figure 1-13: (a) Saturation profile, at different times during desiccation, within a homogeneous bead packing, [42], the flat profiles witness of an homogeneous distribution of water throughout the whole sample. (b) Confocal image of the capillary equilibration process during drying for an homogeneous bead packing, the fluid appears red because of a dye agent, beads appear in black, [43]; t1<t2<t3<t4, from t1 to t2, a first capillary equilibration step is observed in the circled area, from t3 to t4 a second one is observed in a different, but close area.
This constant rate period is therefore encountered in the case of hydrophilic solid matrix where meniscus can develop. However, when the contact angle between the liquid and the solid matrix is too high (close to 90–), drainage is prevented and similarly to the case of a large cylindrical tube, a dry region starts to develop from the free surface toward the inside of the porous matrix as presented on Fig1-14. This figure particularly shows the development of an apparent dry region from the free surface of the sample (at 30mm) from the beginning of the test.
Figure 1-14: (a) Saturation profiles during desiccation for water within a hydrophobic porous media, [42]
Nevertheless, even for hydrophilic solid matrix, the constant rate period of drying is not always observed; typically, when drying system exhibiting very low permeability (as with extremely small pores for instance), this period may not be observed even if strong capillary forces exist (see Fig1-15 in the next section).
iii. The Falling rate period
The third stage of drying is the falling-rate period or periods (see Fig1-15). Essentially, this is the period when the removal of moisture from the solid is dictated by the material itself. The transition between the constant and falling rate drying periods appears at an average moisture content called the critical moisture content or saturation, ‰h, which also corresponds to a critical capillary velocity, [9]. Note that past this point, the liquid network is assumed to become rapidly discontinuous [9]. Right before the regime transition, the flow of water within the sample remains dictated by Darcy’s Law, Eq1.10. At the top free surface of the sample, the capillary pressure is —€g& (— being a constant depending on wetting properties), at a distance M from the free surface,
! #'!
the total pressure in the liquid considering the local saturation ˜ is ™ ˜ P/#GKM where ™2˜4 is the corresponding capillary pressure. Therefore, using Darcy’s Law, the expression of the permeability for partially saturated system (Eq1.13), and providing that the driving pressure gradient is the difference of the former pressures divided by M; one can find the expression of the capillary velocity: …h%& ' Š „ + ’ ˜ + g&? pM + 2 — g&9 /™ ˜ 9 #GKM4
At the free surface, the average meniscus curvature is higher than in the saturated area (located at L), therefore providing that ™ ˜ š ›€”• :
…h%& '
—+ Š „ + ’ ˜ + g&
pM 9
Š „ + ’ ˜ + #G+K+ g&?
p 3+3T
Finally, in the case where gravitational effects on flow are negligible, the second term in Eq1.14 is neglected and the critical capillary velocity be expressed as:
…h '
—+ Š „ + ’ ˜h + g&
p+ M 3+3U
where/˜his the critical local saturation, at that point, the liquid is unable to flow and replace the evaporated liquid even along the liquid-limit of minimum curvature. Keey (1972) followed by Coussot (2000) respectively proposed and scaled two distinct falling-rate periods in the drying of a porous medium: Initially, the moisture will recede to a position in the material where evaporation takes place with moisture supplied by capillary-driven flows. Usually this receded position remains close to the free surface, at distance œ (see Figure 1-10), this first falling rate period is usually called after capillary regime. Inevitably, the drying time of this first falling-rate period depends on the size and distribution of the pores in the porous structure: macro pores extend this period of drying, [9].
Eventually, further drying will trigger a second falling-rate period, this transition known as the "percolation transition", triggers the propagation of a receding evaporative front and usually starts at low moisture content. In this regime specifically, the drying rate scales inversely proportional to the square root of the height of the dry region, œ, as it was observed earlier in the case of a cylindrical tube (Eq1.4).
q ' 9:& #(%)
#G
• 9 3
L P œ 3+3c
Where :& is the diffusion coefficient of vapor through the partially saturated porous structure, :& ' „•:; and L ' :&€:;+ L the relevant length to take into account considering drying conditions.
! #(!
6 - Effect of pore size on drying regimes
Pore size is a crucial parameter that strongly influences the drying kinetics, [9]; for a porous media made of a close packing of spherical beads, the average pore radius can be approximated to 1/6 of the bead radius from geometrical considerations (space between 3 beads closely packed together in 3D). In this section, only porous media made of close packing of glass spherical beads are considered, note that the shape of the particle also plays a role in the drying kinetics one can observe [44], but this is beyond the scope of this study.
Figure 1-15 Normalized drying rate (in this graph the average saturation of the sample is noted ž) as a function of the average saturation in model bead packings filled with ethanol, [9].
Fig1-14 presents the evolution of the rate of drying during convective drying of homogeneous and compact (Vc6 9 cI14/bead packings filled with ethanol and made with a different bead sizes. We observe that during the so called constant rate period, the drying rate is not exactly constant but slowly decreases, as already remarked by Van Brakel [45] and seen earlier on with the polygonal tube; additionally for porous media made with bead diameter ranging from 34-200pD, in the drying conditions considered, we see that the same drying rate applies in this period regardless of bead size. In fact, in these drying conditions and this range of sizes, enough liquid can flow to the surface to cover the evaporation demand imposed by the airflow, regardless of the particle size. Going down to smaller pores, however, the data set shows that the drying rate of the materials decreases immediately from the beginning of the test and no CRP is observed. This trend is consistent with expectations from the Darcy’s law and may be explained by the expression of the critical capillary velocity in Eq1.15: the later relation shows that the smaller the beads, therefore the pore size, the smaller the critical capillary velocity (…h being directly proportional to the particles radii). Therefore, in systems where gravitational forces can be neglected to the capillary forces, the tinier the pores, the sooner the occurrence of the falling rate period, ultimately reached in the very beginning of the desiccation process.
The drying rate in the final stage is seen independent of the particle radius and tends towards an asymptotic value. This is in agreement with the theory corresponding to the receding regime which predicts that the drying rate simply decreases with the distance of the liquid-limit from the free
100 10-1 10-2 10-2 10-1 100 101 200 116 4,5 34 17 Particle diameter d d t (h-1 ) (+m)
#)!
surface of the sample, considering that the tortuosity and the porosity of the porous structure remain similar (Eq1.16).
7 - Effect of pore size distribution on water distribution within the sample
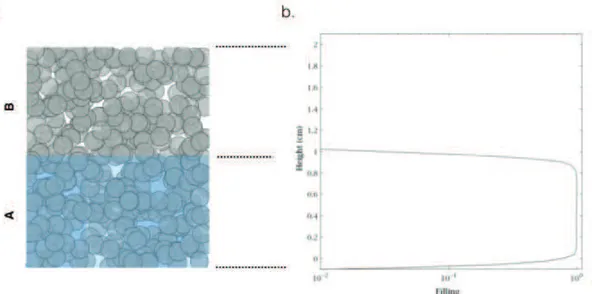
Capillary equilibration is a process observed during the CRP, [Coussot ketia] that enables liquid transfers toward regions of higher depression, in other terms considering the capillary pressure only (Eq1.7), transfers occur from bigger to smaller pores. In Fig1-15a we present a scheme principle: big pore empty first and water is pulled by the Laplace pressure toward the smallest menisci (connection channels between pores are also called throat pores). In Fig1-16b NMR concentration profiles of water within a biphasic porous medium show the direction of liquid flow during drying. Specifically, this porous structure is made with 2 different compartments consisting of compact bead packings with different bead sizes (big beads at the bottom and small beads on top); we observe that drying triggers the bigger porosity to empty first and water to be sucked by the tiniest pores (consistently with Fig1-16a). Note that this system is a model system, a homogeneous pore structure is rarely found for a real porous media. As a matter of fact, the pore size distribution of actual materials is usually wide, (due to the heterogeneity in grain sizes or shapes etc.); In this case, numerical simulation with a three-dimensional invasion percolation model (see Fig1-16c) showed that depending on the width of this distribution different heterogeneous water distributions along the vertical axis of the sample could be expected. In fact, if a continuous liquid network remains within the sample: it suggests that big pores would empty first (probing higher equilibration velocities due to the lower permeability) even if they are located in the bottom of the sample (also seen on (b)) and water would be drained to the top surface in the partially saturated area by thick liquid films likely located in the smaller porosity. Note that this simulation suggests that the narrower the pore size distribution the smaller the vertical extend of liquid films during desiccation and therefore the earlier the formation of a dry region during the test. Time Sample height (mm) b. a. (1) (2) (3) (4) Air
Partially saturated zone
Front width
Air Front Depth: H
Partially saturated zone
Saturated zone c. W ide por e siz e distr ibution Nar ro w por e siz e distr ibution c.
! #*!
Figure 1-16: (a) Scheme for capillary equilibration in a porous structure presenting a wide pore size distribution. (b) 1D MRI profiles representing the water content in a porous media made of 2 homogeneous compartments each of them made of close bead packings with different sizes,[46]; (c) Numerical simulation suggesting the effect of the width of the pore size distribution of a porous media on its water content during drying, [47].
We conclude that heterogeneities in pore size may trigger different water distributions within the sample during drying and specifically possible liquid retention. Liquid retention may occur in the smallest porosity, or in the case of strongly hydrophilic surfaces, at the pore walls; in these cases, drainage through liquid films may be significant. Drawing a parallel with the previous study of a square capillary tube, one could expect a significant influence of draining films on the drying kinetics of the porous media considered. Let’s further look at the current knowledge on liquid films.
8 - Liquid films, surface forces and viscosity
Two types of liquid films have been identified and distinguished in real porous media depending on their draining capacity [19, 48, 49]: The “thick” films that are trapped by capillarity in the corners of the porous geometry and are still considered as draining, i.e. typically corresponding to the films previously seen in the corners of a polygonal tube walls in the former section; and thin films, referring to physically adsorbed water in the form of multi-molecular layers on the walls of the solid matrix by disjoining pressure effects (Van der Waals and electrostatic contributions). The hydraulic conductivity of thin films is very small [50], and therefore their effect on the drying rate is assumed to be negligible compared to that of thick films. Recently, Yiotis et al [51] have presented a pore network model of drying, based on numerical simulation, including the effect of thick films. In accordance with previous works, their simulations qualitatively confirm the significant effects of thick films on the drying rates of coarse porous media. Their research specifically shows that drainage from thick liquid films enhances the overall drying rate of the material.
While drying free water, i.e. water retained in large pores by capillary forces, is well understood and gives rise to a 3 phase process, the physics behind drying of bounded water, referring to physically adsorbed water on the solid matrix remains unclear. The advance in the understanding we present therefore may remain rather qualitative.
The distinction of bounded and free water was specifically put to the fore through neutron scattering experiments during imbibition, [77, 78]. In fact, neutron scattering measurements being sensitive to liquid’s viscosity, emphasized a partitioning of the diffusion dynamics of the molecules in the pores in two species: one component with a bulk-like self-diffusion dynamics and a second one which is immobile, sticky on the time scale of the experiment. While the rheology of the “sticky” water isn’t clear, simple rheology consideration on pore bulk water during imbibition testified the absence of any non-Newtonian behavior for this part of the liquid, [76, 118, 119]. In fact, the disjoining pressure [15] as well as the structural peculiarities of the poly-molecular liquid layers are suspected to reduce mobility of liquid molecule, this is usually translated into an
! $+!
increased viscosity for the wetting solvent. Additionally, recent computational investigation suggested that viscous flow may govern transport at the pore wall in adsorbed layers, [54]. Specific to our case, as we will be using silica surface and water in this study, we record studies performed with hydrophilic Vycor glass [76], that suggests the experimental existence of a sticky boundary layer of water at silica walls from macroscopic scaling. A conclusion which is supported by Molecular Dynamics studies on the structure of water boundary layers in silica pores [120-123], (see 19), or more generally the structure of water on hydrophilic surfaces [123-125]. In Fig1-18a, we illustrate these results showing the computed density of water molecules in a nanotube probing the existence of two different regions with distinct densities and finally a water density profile at the pore wall in Fig1-18b. These former simulations specifically emphasise that the thickness of these bounded liquid films may approximate to a couple of molecules of water (see Fig1-19b).
Figure 1-17: (a) Simulation of the average local densities of water in the horizontal plan (cross section of a tube) in 3nm diameter tubes simulated with silica walls with silanol groups concentration (chemical bounding of the water molecule to silica) of PL=2PH. The density scale is 0-4 K+ ŸD-.; (b) corresponding water density profiles #2g4 in pores (a) as a function of distance from the pore axis. The density profile of the silica matrix is also shown to locate the pore surface (partial and plain gray shadings for the PH and PL cases, respectively).
The physics behind flow of bounded water remains a very delicate topic that may add complexity to our study specifically when pores become a couple of nanometric and the saturation of the porous structure becomes very low.
9 - Drying stress and sample deformation for wetting porous media
Not only capillary forces play a role in the flow of water within the porous media, it is also responsible for its deformation. In fact, the mechanisms of pore fluid loss during drying of a deformable porous medium are seen to play a key role in the onset of drying shrinkage and cracks. The major drying stresses behind these mechanisms are commonly identified as the capillary pressure, the osmotic pressure, the disjoining pressure, [38]. This section focuses on describing the deformation generated by capillary forces during drying of deformable porous media. Along