Introduction
One of the outcomes of the World Summit for Children in 1990 was a call for the development of new vaccines and vaccine technologies. It was proposed that the ideal vaccine should be (1) administered as a single dose, preferably oral, (2) effective when given near birth, (3) heat stable, and (4) comprise multiple antigens. Last, but not least, vaccines should be affordable. Many scientists worldwide took up the challenge set out in the World Summit declaration, including researchers interested in the concept of developing plant-derived vaccines (PDVs). Based on transgenic plant technology, the PDV research concept has been proven, promising products have been created, and all indications are that remaining scientific and technological challenges are surmountable (Das, Phillips, & Khachatourians, 2008). It is now time to think about how PDVs would work if introduced into the market. While it is not realistic to expect the com-mercialization of this technology in the immediate future given that many developments, and regulatory and institutional hurdles remain to be overcome, its prospects for commercialization are nevertheless inter-esting to examine in a prospective model using a struc-tured dynamic approach.
The model and the results presented in this article are hypothetical and prospective. While analogous to case study research, retrospectively focused, the study presented in this article explores—from a prospective standpoint—the problem of biotechnology diffusion for
tion of a PDV against hepatitis B in India. India was chosen as the setting to examine the technology diffu-sion problem of PDVs for three main reasons. First, this country must manage a high rate of contamination of the hepatitis B virus, but it has only partially adopted immu-nization programs. Second, India could become a prime candidate for the introduction of this biotechnology, as it has been making efforts to attract biotechnology R&D, and it is also a country where new biotechnology prod-ucts originate (Mani, 2004; Mehra, 2001). Third, India possesses an institutional and legal framework that sup-ports the utilization of biotechnology products, and it has been a member of the WTO since 1995.
It therefore becomes inherently interesting to observe the potential health impacts related to the diffu-sion of PDVs on the population in developing countries. One of the key working hypotheses that underlies this work is that the system of technology diffusion is assumed complex due to the time and interrelationship dynamics amongst variables. This research case uses a system-dynamics (SD) model to examine the market introduction in India of a PDV against hepatitis B as a substitute for the traditional vaccine technology. The lit-erature on SD provides examples for looking at issues associated with the adoption and diffusion of new prod-ucts (Maier, 1998; Milling, 2002), the introduction of medical technology (Homer, 1987), and health care pol-icy (Hirsch, 2004; McDonnell, 2004).
The goal of this article is to examine the impacts and David Castle and Kira Kumagai
University of Ottawa
Celine Berard and Martin Cloutier
University of Québec at Montréal
Richard Gold
McGill University
Plant-derived vaccines may soon displace conventional vac-cines. Assuming there are no major technological barriers undermining the feasibility of this innovative technology, it is worthwhile to generate quantitative models of regulatory burden of producing and diffusing plant-derived vaccines in industrial-ized and developing countries. A dynamic simulation model of technology diffusion—and the data to populate it—has been generated for studying regulatory barriers in the diffusion of plant-derived vaccines. The role of regulatory burden is evalu-ated for a variety of scenarios in which plant-derived vaccines are produced and diffused. This model relates the innovative and conventional vaccine technologies and the effects of the impact of the uptake of the innovative technology on mortality and morbidity. This case study demonstrates how dynamic sim-ulation models can be used to assess the long-term potential impact of novel technologies in terms of a variety of socio-eco-nomic indicators.
Key words: dynamic simulation model, plant-derived vaccines, regulatory burden, technology transfer, vaccines.
A Model of Regulatory Burden in Technology Diffusion: The Case of
Plant-Derived Vaccines
ization of PDVs. As far as technology diffusion goes, this article is concerned with three aspects of that prob-lem: (1) the demographic evolution of India, (2) the propagation of the virus in infant and non-infant cohorts, and (3) the potential access by the population to that biotechnology product. Given the exploratory nature of this work, and the paucity of hard data to build a “definitive” model, little attention is paid at this time in this study to institutional issues associated with the introduction of the technology. This is not because these issues are not important—quite to the contrary. The cur-rent scope of the model can be used as a starting point to examine more narrowly the technology diffusion prob-lem from an economic and managerial perspective prior to enlarging it to broader legal and institutional consid-erations, which would be essential to fully examine the questions raised in this article. Obviously, a more trans-disciplinary perspective would be required to look into these issues (Gold et al., 2004) and to expand the scope of the following model.
The remainder of the article is organized such that the next section provides background information on hepatitis B, and the following section describes the research method. An influence diagram of the model is then presented and briefly described. The accompanying level-rate model is discussed. Some illustrative simula-tion results are presented prior to presenting our conclu-sion.
Hepatitis B Prevalence
Hepatitis B is a disease much more serious than many realize. The virus is more infectious than HIV, and is the second-most common carcinogen after tobacco. HepB is also highly prevalent—an estimated 350 million people worldwide are chronically infected, and HepB results in approximately 900,000 deaths per year (Organization for Economic Cooperation and Development [OECD], 2003). Hepatitis B is the foremost cause of cancer deaths in males in sub-Saharan Africa and much of Asia, as well as a significant cause of morbidity among women in these regions (Kong et al., 2001). The out-comes of HepB infection are age-dependent and include acute or clinically visible hepatitis B, chronic HepB infection, cirrhosis, and hepatocellular carcinoma. Chil-dren infected with HepB seldom acquire acute HepB, but up to 90% develop into chronic carriers and, hence, become future sources of HepB infection causing acute and chronic infection (Program for Appropriate Tech-nology in Health [PATH], 2005). Infants and young chil-dren have the highest risk of contracting HepB. Despite
this, however, the vaccine—which is 95% effective in preventing the development of chronic infection in childhood—covers just 50% of the world’s annual birth cohort (PATH, 2005).
Research Methods
The model design follows the steps outlined in Sterman (2000). First, the problem was defined, as well as the objective of the model. The fundamental idea underly-ing the model design is to observe the diffusion of the PDV into the market and its effects on the population given market assimilation of the technology. Second, we used an influence diagram (ID) to formulate the dynamic hypothesis that represents the structure of the dynamics of hepatitis B propagation and the PDV adop-tion with respect to the substituadop-tion with existing tech-nology in relation to the evolution of the population in India. Third, we converted the dynamic hypothesis into an SD level-rate model. That model was calibrated with data collected from publicly available information from many sources. As will be discussed however, the avail-ability of data remains an issue. The design of the model is also an opportunity to identify data needs. Fourth, we evaluated the model for consistency. Due to the very nature of the prospective case under study, this model-ing step was difficult to execute with respect to histori-cal consistency. This dimension of the model evaluation was conducted for the historical part of the model only for which data was available. Fifth, the model generated illustrative results.
The consultation of several data sources has proven most useful in providing the information and expertise necessary to build the model and, in particular, to iden-tify underlying feedback loops. The data supporting this model has been updated from the data presented at the PICMET (Portland International Center for Manage-ment of Engineering and Technology) conference in Cape Town, South Africa in July 2008. Specifically, ProVacs (a research group at the Biodesign Institute at Arizona State University) updated the data used for cost estimates and PDV production. The latest research released from the ProVacs group indicates that the cost for PDVs would be $0.02 less than what was used in the previous model. In addition, all of the values for the input parameters for PDV production were updated using data released by the ProVacs group in 2006.
Diffusion of PDV: Dynamic Hypothesis
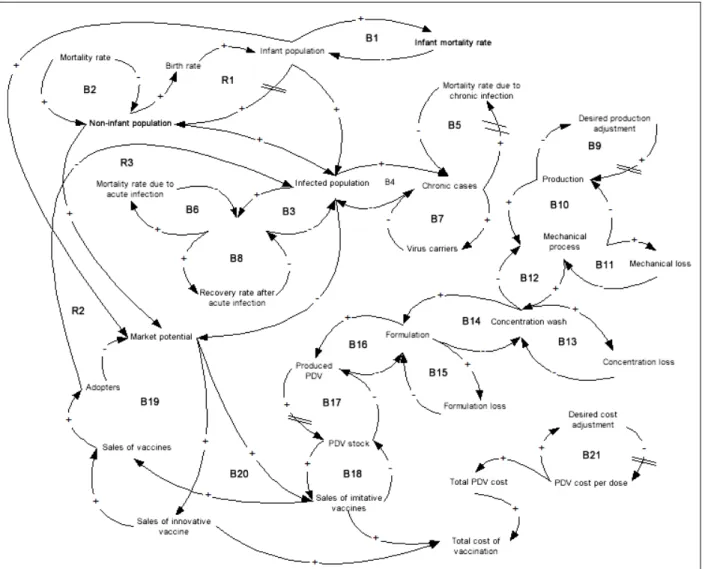
The structure of the dynamic hypothesis showing the main feedback loops of the model is shown in Figure 1,with key time delays highlighted (see the double bars). The dynamic hypothesis contains 21 balancing feedback loops and three reinforcing feedback loops. There are three main sets of interrelationships represented within this structure. The population dynamic distinguishes between the infant (0 to 4 years old) and the non-infant cohort (5 years old and over). An important dynamic is the virus propagation in both infant and non-infant pop-ulations. The inherent dynamics of PDV diffusion are modeled.
General Population Dynamics
The term “infant population” refers to the population between the age of 0 and 4, and the non-infant popula-tion defines the populapopula-tion above age 5. The reinforcing feedback loop R1, represents the interaction between
these two population cohorts by the influence of the variable “birth rate.” The balancing loops B1 and B2 are related to infant and non-infant mortality rates that affect their respective cohort population.
Virus Propagation Dynamics
The virus propagation dynamics in the overall popula-tion are shown in the set of balancing feedback loops labeled B3 to B8. These relationships include the level of infection in the overall population, referred to as “infected population,” and the disaggregation of the population between acute and chronic cases. Although not shown in Figure 1, these feedback loops also sepa-rate this dynamic for both infant and non-infant cohorts.
PDV Diffusion Dynamics
The modeling of PDV diffusion takes into account rela-tionships relative to production, sales, and production costs. The balancing loops B9 to B17 represent steps that must be executed prior to PDV commercializa-tion—that is, steps from plant production to vaccine storage. More precisely, “production” refers to the num-ber of hectares under production. However, it is likely that production output will not be on par with the set objective as soon as infrastructures are put into place— that is, when greenhouses are put under production. The number of hectares in production will increase over a number of years to reach the desired production objec-tive, and this is represented in balancing loop B9. Fol-lowing this, a certain biomass is extracted from this production. This biomass extraction is conducted in three steps: mechanical process, concentration wash, and the formulation that leads to vaccine production. There is wastage generated at each step, and this process slows down the PDV product output. The dynamics inherent to this transformation process are described by the balancing loops B10 to B16. The PDV ready for dif-fusion, or the PDV stock, depends on the number of PDVs produced (taking into account the import time delay of PDVs) in case the producing country differs from the diffusion one. This is captured by the balancing loop B17.
Regarding sales, the dynamics represented in Figure 1 are analogous to production diffusion and technology substitution. PDVs can be seen as a substitute to con-ventional vaccines. The sales of innovative vaccines refer to the sales of conventional vaccines, and the sale of imitative vaccines refers to PDV sales. Likewise, the population targeted by the vaccination program is shown as market potential, and individuals that have used one or the other vaccine are referred to as adopters. These mechanisms of double diffusion, illustrated by the balancing loops B18 to B20, are thus linked, on the one hand to the existing market for conventional vac-cines, and on the other hand, to the emerging market of PDVs, according to production levels.
The remaining aspect to consider relative to the dif-fusion of PDVs is vaccination costs. The PDV cost per dose represents the effective cost for one dose, including production and administration costs. The assumption is that unit cost diminishes during a time interval to even-tually stabilize. The time delay required is about the same as the time it takes to adjust production (B9), and this phenomenon is represented by the balancing feed-back loop, B21. The total PDV cost is thus a function of
the PDV cost per dose and of the number of doses required, but also includes additional costs linked to the regulatory burden. Finally, the total cost of vaccination accumulates costs associated with the total number of vaccines sold. The impact of this third subsector (PDV diffusion) on the propagation of the hepatitis B virus is important as the number of vaccinated persons (or num-ber of adopters) reduces the infected population (as seen in reinforcing feedback loops R2 and R3).
Diffusion of PDV: The Simulation Model
Model Structure
The influence diagram shown in Figure 1 defines the blueprint for the simulation model. Given the nature of the problem examined, the model computes results on an annual basis. Note that all the feedback loops shown in the influence diagram are part of a large level-rate model. This overall model can be split into five main subsectors. We “sliced” the model into five subsectors.
• Demographic evolution in India
• Virus propagation—infant population and non-infant population
• Market potential for PDV and vaccine diffu-sion—infant population and non-infant popula-tion
• PDV production, including time delays due to the regulatory burden
• Estimation of vaccination program costs, includ-ing costs due to the regulatory burden
Hence, the propagation of the virus in India, for both infant and non-infant cohorts, was modeled and quanti-fied according to the demographic evolution over time of the infant and non-infant cohorts. More specifically, hepatitis B (chronic versus acute infections), related deaths, and infection recoveries were all included in the model. The hepatitis B infection rates are estimated through the birth cohorts. The vaccination rate is thus dependent on the diffusion of the PDV in India, mea-sured by the potential market and adopters. The quantity of PDV available in the market for a given period is directly linked to the production and distribution pro-cess of vaccines. This propro-cess is therefore directly sub-ject to certain time delays and costs, according to the different regulations to consider during the diffusion of a new biotechnology product.
Model Calibration
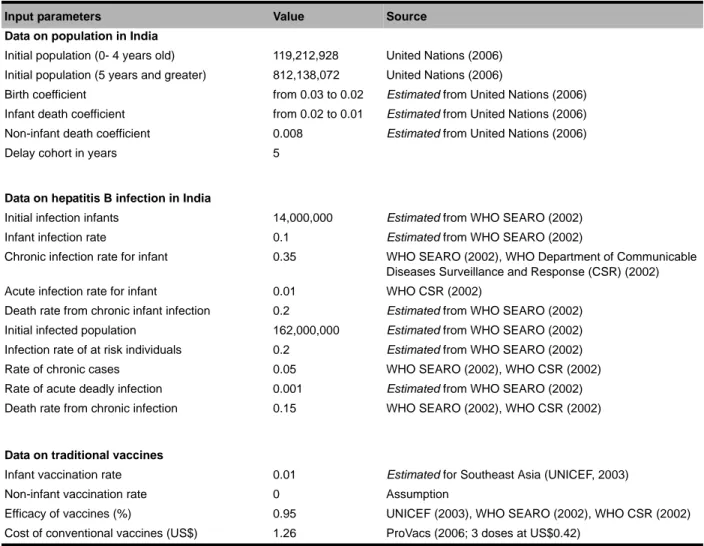
The parameters of the base-case level-rate model were set using data collected from publicly available sources. However, much of the data and information are not directly available. Due to the hypothetical nature of the problem modeled, only part of the results could be eval-uated for historical accuracy. Table 1 shows the input parameters used in the model and their sources. Some entries are based on estimates of what they may be, given extraneous information. The reference year for the model evaluation is 1995. Relative to the demographic evolution of India, the simulated results were quite com-parable to the available historical data. This evaluation was conducted using past and future population esti-mates available for the period 1995-2015 (United Nations, 2006).
Relative to the fraction of the population infected with the hepatitis B virus, no specific time series was
available. The model was calibrated using data from a study conducted by the World Health Organization (WHO South-East Asia Regional Office [SEARO], 2002) that has estimated the number of infected cases, the number of virus carriers, number of deaths from the disease, etc. This data was also useful for looking into the rates of new infant cohorts.
Data on PDV Production and Distribution
The model assumes that a PDV would be available on the market starting in 2010. The real year for diffusion initiation could, in fact, take place later due to certain regulatory time delays imposed by different types of regulation. Three assumptions were made for the esti-mation of data relative to PDV production. First, follow-ing the same assumption of ProVacs (2006), it was supposed that 75 million doses of PDV should be pro-duced annually and, thus, 25 million vaccines. The
tar-Table 1. Model parameters: Base case specification (t0=1995).
Input parameters Value Source
Data on population in India
Initial population (0- 4 years old) 119,212,928 United Nations (2006) Initial population (5 years and greater) 812,138,072 United Nations (2006)
Birth coefficient from 0.03 to 0.02 Estimated from United Nations (2006)
Infant death coefficient from 0.02 to 0.01 Estimated from United Nations (2006)
Non-infant death coefficient 0.008 Estimated from United Nations (2006)
Delay cohort in years 5
Data on hepatitis B infection in India
Initial infection infants 14,000,000 Estimated from WHO SEARO (2002)
Infant infection rate 0.1 Estimated from WHO SEARO (2002)
Chronic infection rate for infant 0.35 WHO SEARO (2002), WHO Department of Communicable Diseases Surveillance and Response (CSR) (2002)
Acute infection rate for infant 0.01 WHO CSR (2002)
Death rate from chronic infant infection 0.2 Estimated from WHO SEARO (2002)
Initial infected population 162,000,000 Estimated from WHO SEARO (2002)
Infection rate of at risk individuals 0.2 Estimated from WHO SEARO (2002)
Rate of chronic cases 0.05 WHO SEARO (2002), WHO CSR (2002)
Rate of acute deadly infection 0.001 Estimated from WHO SEARO (2002)
Death rate from chronic infection 0.15 WHO SEARO (2002), WHO CSR (2002)
Data on traditional vaccines
Infant vaccination rate 0.01 Estimated for Southeast Asia (UNICEF, 2003)
Non-infant vaccination rate 0 Assumption
Efficacy of vaccines (%) 0.95 UNICEF (2003), WHO SEARO (2002), WHO CSR (2002)
geted production level will be met after a certain time, thus initial production would be lower. Second, PDVs would be produced in greenhouses and not in open fields, because according to ProVacs (2006), the green-house scenario is the most appropriate. Third, the plant used for the biotech vaccine would be tobacco—which has the highest cost per acre of production (ProVacs, 2006)—and not potato, tomato, or wheat.
The effective cost of one PDV dose was determined, and it includes both production and administration costs. The initial proposed cost for a PDV dose should experi-ence a reduction prior to stabilizing after some time. These cost estimates were provided by the research work conducted by ProVacs (2006). The initial cost cor-responds to the effective cost estimated for a single dose, while the reduced cost is an estimated cost for a lot of ten doses.
The last dimension to be quantified includes costs, time delays, and the degree of certainty, linked to the regulatory burden. These data had to be estimated for each type of regulation, related to
• IP, • seeds, • product approval, • cultivation, • manufacturing, and • import/trade.
The time delays associated with the first five types of regulation slow down the beginning of PDV tion; these delays impact only the initial year of produc-tion. Time delays linked to PDV imports intervene only when the producing country differs from the final desti-nation. It no longer slows down the beginning of pro-duction, but the number of doses on the market. The greater the certainty about each regulation type, the greater the time delay.
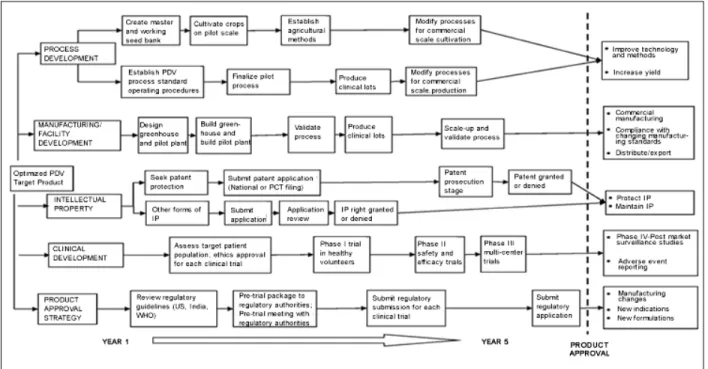
A temporal PDV product development plan is illus-trated in Figure 2. In this ideal plan, all development stages (process, manufacturing/facility, intellectual property rights, clinical, and regulatory) happen simul-taneously, minimizing the time delay between clinical development completion and public access to PDVs.
Costs associated with the first three types of regula-tory burden intervene only in the initial year of PDV production. Inversely, the last three types of regulation generate costs to account for each PDV put on the mar-ket. In this case, regulatory certainty is also taken into account, increasing the risk for higher costs.
It is important to recall that the effective cost of a PDV and the regulatory burden (costs, time delays, and certainty) depend upon the country where the PDV is produced and where distribution is controlled. Data were collected for each of the following three scenarios (further explained in Table 2).
1. Production and distribution of the PDV is con-trolled by developed nation (United States). 2. Production of the PDV is controlled by
devel-oped nation (United States), and distribution is controlled by India.
3. Production and distribution of the PDV is con-trolled by India.
Simulation Results
The designed and calibrated simulation model tested and compared alternative scenarios. The commercializa-tion year for the PDV was set to 2010, and the time delay required for adjustments in production and in costs was established at three years for each scenario. Moreover, for the purpose of the calculations presented, the assumption is that the PVD is not available in quan-tities large enough to satisfy the need, and there is still a penetration rate of 1% for the existing vaccine.
The repercussions generated by the alternative sce-narios have been compared with a business-as-usual baseline. “Business as usual” refers to a situation with-out PDV introduction; only the conventional vaccine is available. In accordance with the data presented in Table 1, only 1% of children are vaccinated.
The three hypotheses identified earlier have led to the estimation of three scenarios. The results presented in this section have an objective of comparing the hypotheses for the
• swiftness of the PDV production process (Figure 3),
• number of new infected cases by the hepatitis B virus per year (Figures 4 and 5),
• mortality associated with these new infected cases (Figures 6 and 7), and
• total cost of vaccination (Figures 8 and 9).
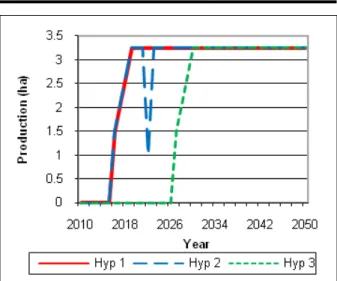
The number of hectares in annual production provides the swiftness of the production process. These results are shown in Figure 3.
As mentioned earlier, the market opens for the PDV in 2010. However, according to the scenarios, the time delays associated with the regulatory burden interfere. The results shown in Figure 3 indicate that for Hypothe-ses 1 and 2, the PDV production would begin in 2016, after a time delay of 6 years; for Hypothesis 3, it would begin in 2027, after a time delay of 17 years. It appears that for regulatory reasons, the time delay would be much longer if India produced the PDV, not the United States. Moreover, it is important to note that the results
Table 2. Summary of the three possible scenarios for PDV diffusion. Summary
Scenario 1 PDVs are produced in the United States and distributed in India by a US firm. Production must meet US regulatory standards regarding containment and confinement practices. Finished product must meet US drug and biologic regulations. These regulations ensure product safety and efficacy but are expensive. India is open to foreign investment, but firms must undertake due diligence to ensure intellectual property rights protection. Import tariffs must be reviewed, and the distribution firm may be subject to review by the Reserve Bank of India.
Scenario 2 PDVs are produced in the United States by a US firm but distributed in India by an Indian firm. US environmental regulations and regulations for the finished product safety and quality apply. The US firm would likely negotiate a license with the Indian firm to distribute the final product, including licenses for intellectual property rights. In this scenario, the burden of foreign investment barriers is traded for licenses and importation tariffs. Like Scenario 1, the burden of US regulation in the United States, and the high cost of production must be considered.
Scenario 3 Scenario 3 involves the production and distribution of the PDV in India by an Indian firm, requiring compliance with Indian environmental and manufacturing standards, which may not be as stringent as in the United States. Several Indian authorities have regulatory jurisdiction over the commercialization of biotechnology, making the regulatory pathway somewhat uncertain and slow. Biosafety is a concern and appears in many regulations, including the Indian Patent Act. While the technology would be licensed, importation and tariff rules no longer apply.
generated are coherent with the assumption of time delays required to reach targeted production levels of 3.25 hectares. For each of the hypotheses, the adjust-ment is realized over a 3-year period. The target is reached in 2019 for Hypotheses 1 and 2 and in 2030 for Hypothesis 3.
Figures 4 and 5 present the repercussions of each hypothesis and of “business as usual” on the new infec-tion cases by the hepatitis B virus in India per year. Fig-ure 4 presents infant new infection levels for each birth cohort. Figure 5 displays new infection levels for non-infant cohorts, but for which infection will occur later in life.
The results presented show that the diffusion of PDVs, no matter what the scenario, contributes to a reduction in new infected cases per year. Indeed, by 2050, a reduction of nearly 84% in the total number of new infections could be achieved. The number of new infections declines soon after the introduction of PDVs. It can be observed, however, that this figure never reaches zero. Two reasons explain this outcome. First, all vaccines, whether conventional or PDV, are not 100% reliable. More precisely, 95% of the individuals vaccinated could nevertheless develop an infection. Sec-ond, the targeted PDV production, set at 25 million vac-cines, is not sufficient to cover all newborns, given the increase in the number of newborns.
Finally, the comparison of results for the three sce-narios stresses that the reduction in the number of infected cases is slightly more effective in Scenario 2 than in Scenario 1. This is due to the more prevalent time delays and regulatory certainty of imports in Sce-nario 1. Regarding SceSce-nario 3, the reduction witnessed is much slower than for the other two scenarios. These
results are consistent with the analysis conducted earlier regarding the swiftness of the PDV’s production pro-cess. The production of PDVs, if first conducted in India, could only begin 17 years after 2010, compared to 6 years for Scenarios 1 and 2, where production first takes place in the United States.
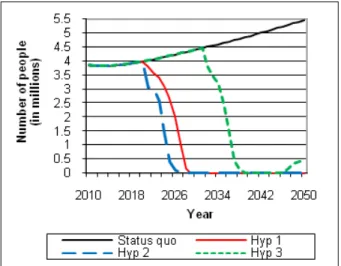
Figures 6 and 7 present the repercussions of each scenario—and of the status quo (without PDV commer-cialization)—on the number of deaths due to the hepati-tis B virus per year in India. Figure 6 shows the impact of the uptake of the new technology on infant deaths, while Figure 7 presents the number of non-infant deaths that could be avoided.
As emphasized earlier, in connection with the reduc-tion in the number of infected cases, the number of deaths due to hepatitis B could decline rapidly if PDVs are commercialized. Indeed, beginning in 2023—com-pared with the status quo—a reduction of 35,102 deaths is expected in Scenario 1 and 162,008 deaths in nario 2 (in both infant and non-infant cohorts). In Sce-nario 3, deaths will not be reduced until 2034, when (for that year only) 105,686 deaths will be avoided. From 2010 to 2050, it appears that a total of 5.9 million deaths would be avoided in Scenario 1, 6.3 million deaths in Scenario 2, and 3.8 million deaths in Scenario 3. As identified earlier, the differences in these numbers are due to the speed at which the PDV production process can be initiated. Based on these results, Scenario 3 slows the process of PDV diffusion the most. It is there-fore clear that the impact of time of PDV diffusion on mortality rates is non-negligible. Although Scenarios 1 and 2 are only slightly different, the health benefits remain important in the case of the second hypothesis.
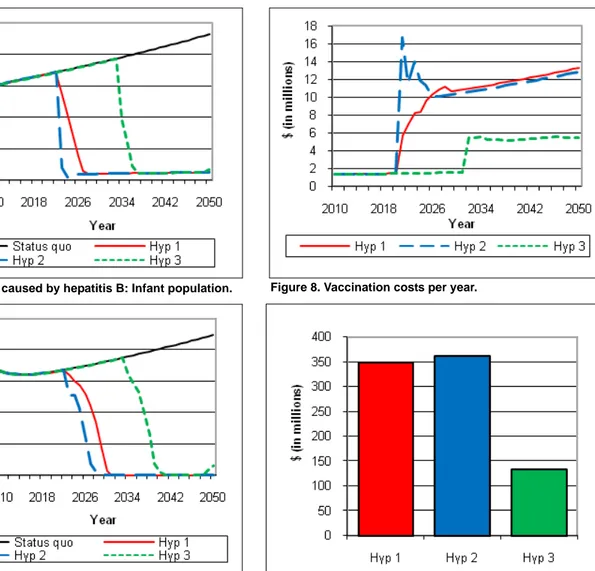
Finally, the results were examined for their effects on costs. Figures 8 and 9 present these results.
Prior to the production and distribution of PDVs, the costs only relate to the sales of the conventional vaccine, and it approximates about 1.5 million dollars (the assumption is that only 1% of infants are vaccinated in each year). From the time the PDVs are commercial-ized, there is an increase in cost that varies according to the scenario under consideration. In 2050, the annual cost reaches $13.3 million, $12.81 million, and $5.48 million, respectively for Scenarios 1, 2, and 3. Scenarios 1 and 2 show a slight difference between their respective annual costs. Similarly, with respect to the results in Figure 8, it appears that the total cost of the vaccina-tion—that is, the cumulative costs from 2010 to 2050— differs according to scenarios. Total costs are $348.36 million in Scenario 1, $362.93 million in Scenario 2,
and $133.25 million in Scenario 3. According to these findings, Scenario 2 generates the highest costs and Sce-nario 3 generates the lowest costs.
These comparative analyses have highlighted that Scenario 2 generates the largest benefits with respect to reduction in the number of infected cases and mortality related to the hepatitis B virus. This can be explained by the fact that the time delays are less important for this scenario than for the other two. In addition, the costs generated by this scenario, while higher, are fairly close to those of Scenario 1. In Scenario 3, costs are signifi-cantly lower, but health benefits would take much lon-ger to obtain. These results indicated that PDV technology should be produced in the United States and control over distribution should be executed in India.
Figure 8. Vaccination costs per year.
Figure 9. Total vaccination costs (from 2010 to 2050). Figure 6. Deaths caused by hepatitis B: Infant population.
Figure 7. Deaths caused by hepatitis B: Non-infant popula-tion.
Conclusion
The possible diffusion of PDV biotechnology in India offers an alternative to existing, more expensive, con-ventional vaccine technology that is currently available on the market. The fact is that, in light of growing health inequities aggravated by worsening wealth distribution, the need for vaccines in poor and developing countries has never been more pressing (Peny, Gleizes, & Covilard, 2005). The development of new, safe, and affordable vaccines and new vaccine delivery technol-ogy for infectious diseases in developing countries is crucial for the survival of hundreds of millions of peo-ple, especially children (Global Alliance for Vaccine Initiatives [GAVI], 2007). This article is concerned with the potential impact that the introduction of such a tech-nology could have on the incidence of hepatitis B cases on India’s population overtime. The objective of the article is to look at the hypothetical issues of PDV diffu-sion using a system dynamics model. Some illustrative results have been presented to show the interaction between infection rates, mortality rates, vaccination rates, and costs. The new ProVacs data used for the model parameters provided updated predictions for the number of deaths avoided due to vaccination, as well as the cost to vaccinate. The updated data used in this model from that presented at PICMET provides more accurate and conclusive results for the overall benefit of PDV technology, as well as further support for Scenario 2, the production of PDV in the United States and the distribution by an Indian firm in India. In spite of prom-ising features, such as much lower production costs, institutional hurdles to a widespread diffusion of the technology still need to be overcome.
References
Das, V., Phillips, W.B., & Khachatourians, G.G. (2008). Commer-cialization of plant-derived vaccines in Canada: A distant dream? Health Law Review, 16(4), 25-29.
Global Alliance for Vaccine Initiatives (GAVI). (2007). GAVI website: Innovative technologies section. Geneva, Switzer-land: Author. Available on the World Wide Web: http:// www.gavialliance.org/about/in_technologies/index.php. Gold, E.R., Adams, W.A., Castle, D., Cleret de Langavant, G,
Cloutier, L.M., et al. (2004). Probing benefits: Biotechnology innovation and the patent system. Public Affairs Quarterly, 18, 299-344.
Hirsch, G.B. (2004, July 23-27). Modeling the consequences of major incidents for health care systems. Paper presented at the 22nd International Conference of the System Dynamics Society, Oxford, England.
Homer, J. (1987). A diffusion model with application to evolving medical technologies. Technological Forecasting and Social Change, 31, 197-218.
Kong, L., Richter, Q., Yang, Y.F., Arntzen, C.J., Mason, H.S., & Thanavala, Y. (2001). Oral immunization with hepatitis B sur-face antigen expressed in transgenic plants. Proceedings of the National Academy of Sciences, 98, 11539-11544. Maier, F.H. (1998). New product diffusion models in innovation
management—A system dynamics perspective. System Dynamics Review, 14, 285-308.
Mani, S. (2004). Institutional support for investment in domestic technologies: An analysis of the role of government in India. Technological Forecasting and Social Change, 71, 855-863. McDonnell, G. (2004, July 23-27). Using system dynamics to
analyse health system performance within the WHO frame-work. Paper presented at the 22nd International Conference of the System Dynamics Society, Oxford, England.
Mehra, K. (2001). Indian system of innovation in biotechnol-ogy—A case study of cardamom. Technovation, 21, 15-23. Milling, P.M. (2002). Understanding and managing innovation
processes. System Dynamics Review, 18, 73-86.
Organization for Economic Cooperation and Development (OECD). (2003). Biotechnology and sustainability: The fight against infectious diseases. Paris: Biotechnology Unit Direc-torate for Science, Industry and Technology.
Peny, J.M., Gleizes, O., & Covilard, J.P. (2005). Financial require-ments of immunization programs in developing countries: A 2004-2014 perspective. Vaccine, 23, 4610-4618.
Program for Appropriate Technology in Health (PATH). (2005). Children’s vaccine program. Hepatitis B quick facts. Seattle, WA: Author.
ProVacs. (2006). Plant-derived vaccines: Cost of production. A Program of the Center for Infectious Diseases and Vaccinol-ogy, The BioDesign Institute at Arizona State University, Tempe, Arizona.
Sterman, J.D. (2000). Business dynamics: Systems thinking and modeling for a complex world. New York: Irwin-McGraw-Hill.
UNICEF. (2003). UNICEF website: Statistical tables section. New York: Author.
United Nations. (2006). World population prospects: The 2006 revision population [database]. New York: United Nations, Population Division. Available on the World Wide Web: http:/ /esa.un.org/unpp/.
World Health Organization (WHO), Department of Communica-ble Diseases Surveillance and Response (CSR). (2002). Hep-atitis B (WHO document number WHO/CDS/CSR/LYO/ 2002.2). Geneva, Switzerland: Author.
WHO, South-East Asia Regional Office (SEARO). (2002). Pre-vention of hepatitis B in India, an overview (WHO document number SEA/EPI/141/SEA/Hepat/5). New Delhi, India: Author.
Acknowledgements
The authors gratefully acknowledge support from Genome Canada through the Ontario Genomics Institute and from the Social Sciences and Humanities Research Council of Canada supported Intellectual Property Mod-eling Group.