HAL Id: tel-01807948
https://tel.archives-ouvertes.fr/tel-01807948
Submitted on 5 Jun 2018HAL is a multi-disciplinary open access
archive for the deposit and dissemination of sci-entific research documents, whether they are pub-lished or not. The documents may come from teaching and research institutions in France or
L’archive ouverte pluridisciplinaire HAL, est destinée au dépôt et à la diffusion de documents scientifiques de niveau recherche, publiés ou non, émanant des établissements d’enseignement et de recherche français ou étrangers, des laboratoires
Improving Functional and Structural Test Solutions for
Integrated Circuits
Aymen Touati
To cite this version:
Aymen Touati. Improving Functional and Structural Test Solutions for Integrated Circuits. Electron-ics. Université Montpellier, 2016. English. �NNT : 2016MONTT308�. �tel-01807948�
Délivrée par l’Université de Montpellier
Préparée au sein de l’école doctorale I2S Et de l’unité de recherche LIRMM/UMR 5506
Spécialité:Systèmes Automatiques et Microélectroniques (SYAM)
Présentée par Aymen TOUATI
Président du Jury: M. Daniel CHILLET
Amélioration des Solutions de Test Fonctionnel et Structurel des Circuits Intégrés
***
Improving Functional and Structural Test Solutions for
Integrated Circuits
Soutenue le 15-10-2016 devant le jury composé de
M. Stefano DICARLO Professeur Associé Politecnico di Torino Rapporteur
M. Daniel CHILLET Professeur Université de Rennes Président du jury | Rapporteur M. Matteo SONZAREORDA Professeur Politecnico di Torino Examinateur
M. Arnaud VIRAZEL MCF UM-LIRMM Examinateur
M. Alberto BOSIO MCF UM-LIRMM Directeur de thèse
M. Patrick GIRARD DR CNRS CNRS-LIRMM Co-Directeur de thèse
Acknowledgements
I would like to express my deepest gratitude to my thesis director, Prof. Alberto Bosio. With his encouraging and supporting attitude, meeting him has always been a work-stress reliever for me. His profound guidance and invaluable advises helped keeping my research well di-rected and my progress on schedule while maintaining my autonomy.
My sincere thanks also goes to my co-director, Prof Patrick Girard, for his immense knowledge, motivation and support throughout the research. I also appreciate Prof. Arnaud Virazel’s insightful comments and advises during my research.
My grateful thanks are also extended to Prof. Matteo Sonza Reorda and Prof. Paolo Bernardi for their generous support and effort to actively maintain the collaborative part-nership, LAFISI, and their valuable and constructive suggestions that helped me enrich my ideas.
I wish to acknowledge the support received form my friends at LIRMM for the various dis-cussions and brain storming sessions. Also for making the last three years memorable. Finally, none of this would have been possible without the love and patience of my fam-ily (especially my sister Haifa) and my fiancee Syhem. Their constant support and strength has aided and encouraged me throughout this endeavor.
"A life spent making mistakes is not only more honorable, but more useful than a life spent doing nothing"
Abstract
nlight of the aggressive scaling and increasing complexity of digital circuits, meeting the demands for designing, testing and fabricating high quality devices is extremely challeng-ing. Higher performance of integrated circuits needs to be achieved while respecting the constraints of low power consumption, required reliability levels, acceptable defect rates and low cost. With these advances in the SC industry, the manufacturing process are becoming more and more difficult to control, making chips more prone to defects.
Test was and still is the unique solution to cover manufacturing defects; it is becoming a dominant factor in overall manufacturing cost. Even if existing test solutions were able to satisfy the cost-reliability trade-off in the last decade, there are still uncontrolled failure mechanisms. Some of them are intrinsically related to the manufacturing process and some others belong to the test practices especially when we consider the amount of detected defects and achieved reliability.
The main goal of this thesis is to implement robust and effective test strategies to comple-ment the existing test techniques and cope with the issues of test practices and fault models. With the objective to further improve the test efficiency in terms of cost and fault coverage ca-pability, we present significant contributions in the diverse areas of in-field test, power-aware at-speed test and finally scan-chain testing.
A big part of this thesis was devoted to develop new functional test techniques for processor-based systems. The applied methodologies cover both in-field and end-of manufacturing test issues. In the farmer, the implemented test technique is based on merging and compacting an initial functional program set in order to achieve higher fault coverage while reducing the test time and the memory occupation. However in the latter, since we already have the structure information of the design, we propose to develop a new test scheme by exploiting the existing scan chain. In this case we validate the complementary relationship between functional and structural testing while avoiding over as well under-testing issues.
The last contribution of this thesis deals with the test improvement of the most used DFT structure that is the scan chain. We present in this contribution an intra-cell aware testing approach showing higher intra-cell defect coverage and lower test length when compared to conventional cell-aware ATPG. As major results of this effective test solution, we show that an intra-cell defect coverage increase of up to 7.22% and test time decrease of up to 33.5% can be achieved in comparison with cell-aware ATPG.
Key words: Functional Test, Structural Test, ATPG, Power-Aware At-Speed Test, Test
Compaction, Microprocessor Test, SBST, Fault simulation, Intra-Cell Defect, Scan-Chain Testing, Test Quality.
Résumé
ompte tenu de la complexité des circuits intégrés actuels qui ne cessent d’integrer de plus en plus de transistors, l’amélioration des tests fonctionnels et structurels de ces circuits est devenue une problématique de plus en plus critique.
En effet, la diminution de la taille de ces transistors induit implicitement une sensibilité toujours plus importante des circuits aux perturbations provenant de l’environnement, mais également aux défauts de fabrication.
Ce contexte technologique conduit donc les concepteurs à prévoir des techniques de test toujours plus élaborées, permettant de garantir des circuits sains après fabrication.
Les travaux présentés dans ce mémoire concernent directement cette problématique et pro-posent un ensemble de solutions qui satisfont à diverses contraintes, comme les contraintes de consommation de puissance au cours du test, les contraintes liées à la couverture de défauts temporels, celles liées au temps de test, à l’occupation mémoire générée par le stockage des vecteurs de test , etc.
Les solutions de test proposées dans cette thése, combinées avec d’autres techniques, per-mettent de détecter plus de fautes dans les cœurs de processeurs, mais aussi de considérer des modéles de faute plus réalistes dans le cas des circuits munis de chaînes de scan, technique de conception en vue de test DFT généralement utilisée dans l’industrie.
Les travaux sont illustrés sur la base de deux cœurs de processeur en particulier, mais peu-vent s’étendre à d’autres cœurs sans réelles difficultés.
Contents
Acknowledgements i Abstract iii Résumé v List of Figures xi List of Tables xv 1 Introduction 12 A Comprehensive Evaluation of Functional Programs for Power-Aware Test 5
2.1 Introduction . . . 5
2.2 Evaluation Framework . . . 8
2.3 Experimental Results . . . 11
2.3.1 Experimental Setup . . . 11
2.3.2 Functional Coverage Evaluation Metrics . . . 12
2.3.3 Structural Coverage Evaluation Metrics . . . 14
2.4 Summary . . . 17
3 An Effective Approach for Functional Test Programs Compaction 19 3.1 Introduction . . . 19
Contents
3.3 Fault Coverage Analysis . . . 22
3.3.1 Fault Coverage Merging . . . 24
3.4 Compaction Technique . . . 27
3.5 Experimental Results . . . 28
3.6 Summary . . . 32
4 Exploring the Impact of Functional Test Programs Re-Used for Power-Aware At-Speed Testing 35 4.1 Introduction . . . 36
4.2 Background . . . 37
4.3 Proposed Methodologies . . . 38
4.4 Experimental Results . . . 41
4.4.1 Fault Coverage Enhancement Results . . . 41
4.4.2 A Global Test Solution Results . . . 44
4.5 Summary . . . 48
5 Scan-Chain Intra-Cell Aware Testing 49 5.1 Introduction . . . 49
5.2 Scan Chain Test . . . 50
5.3 Overall Flow of The Proposed Approach . . . 52
5.4 Defect Characterization . . . 53
5.5 Intra-Cell Defect Grading . . . 56
5.5.1 Scan Chain Test . . . 56
5.5.2 Logic Test . . . 58
5.6 Results and Analysis . . . 59
5.6.1 Defect Grading Results . . . 59
5.6.2 Learning . . . 63
5.7 Summary . . . 67
6 Conclusion 69
Contents
List of Figures
2.1 Over and under test phenomena . . . 6
2.2 Test program generation . . . 7
2.3 Functional coverage flow . . . 10
2.4 Structural coverage flow . . . 11
2.5 Functional program generation . . . 12
2.6 Statement code coverage evaluation . . . 12
2.7 Branch code coverage evaluation . . . 13
2.8 Condition code coverage evaluation . . . 13
2.9 Expression code coverage evaluation . . . 14
2.10 Toggle code coverage evaluation . . . 14
2.11 Stuck-at fault coverage . . . 15
2.12 Stuck-at fault observability . . . 15
2.13 Transition fault coverage . . . 16
2.14 Transition fault observability . . . 16
3.1 Stuck-at fault coverage achieved by functional test programs generated for the minimips . . . 22
3.2 Test redundancy . . . 23
3.3 Flow for determining the set of detected faults . . . 24
3.4 Merged stuck-at fault coverage for the minimips . . . 25
3.5 Merged transition fault coverage for the minimips . . . 26
List of Figures
3.7 Redundant pseudo-code . . . 27
3.8 % of test reduction (stuck-at fault mc8051) . . . 28
3.9 Test time distribution . . . 30
3.10 Memory occupation distribution . . . 31
3.11 Reduction and test Time (Transition faults minimips) . . . 32
4.1 Functional test programs peak-power consumption (mc8051 core) . . . 37
4.2 Observability issues (%) mc8051 . . . 37
4.3 Functional test program waveforms . . . 38
4.4 LOC & Launch-off-Shift (LOS) test schemes . . . 39
4.5 Mapping functional test program to Launch-off-Capture (LOC) test scheme . . 40
4.6 Functional programs to test patterns . . . 41
4.7 LOC and LOS detected faults repartition . . . 43
4.8 a) LOS vs Func2LOC, b) LOC vs Func2LOC . . . 44
4.9 A global test solution . . . 45
4.10 Transition fault improvement by applying a global test solutions . . . 45
4.11 A global test solution (mc8051 case study) . . . 46
4.12 Cumulative transition fault coverage : mc8051 . . . 48
5.1 MUX-scan flip-flop . . . 51
5.2 Full scan architecture . . . 51
5.3 Overall flow . . . 52
5.4 Spice simulation . . . 55
5.5 Schematic view of a MUX21 . . . 55
5.6 Scan-chain test intra-cell defect grading . . . 57
5.7 Logic test intra-cell defect grading . . . 58
5.8 Logic test functional window, corresponding to the period when scan enable = 0 59 5.9 Fault & defect coverage evaluation of the ATPG patterns . . . 61
5.10 Defect coverage evaluation for scan-chain test . . . 62
5.11 Defect coverage capabilities of the different test sets . . . 63
List of Figures
5.13 Delay fault UDFM example: MUX-Scan Flip-Flop . . . 65 5.14 Proposed test solution . . . 66
List of Tables
3.1 Mc8051 & minimips gate-level characteristics . . . 22
3.2 Functional test programs analysis . . . 23
3.3 Test reduction (%) . . . 29
3.4 Test time example . . . 29
3.5 Test time reduction (%) . . . 32
4.1 Mc8051: LOC and LOS test set characteristics . . . 42
4.2 Functional test programs characteristics . . . 42
4.3 Faults left undetected by LOC and LOS . . . 44
5.1 Defect database . . . 54
5.2 Multiplexer defect database example . . . 55
5.3 Defect coverage evaluation for logic test . . . 61
5.4 Defect coverage evaluation for scan-chain test . . . 62
5.5 Logic test overall defect coverage . . . 63
5.6 Intra-cell aware ATPG construction . . . 66
List of Acronyms
IC Integrated Circuit . . . 4
CPU Central Processing Unit . . . 7
EA Evolutionary Algorithm . . . 8
HDL Hardware Description Language . . . 14
CDV Coverage-Driven Verification . . . 9
CUT Circuit Under Test . . . 5
FC Fault Coverage. . . .59
SAF Stuck-at Fault . . . 59
TF Transition Fault . . . 59
SBST Software-Based Self-Test . . . 3
DAGs Directed Acyclic Graphs . . . 7
ALU Arithmetic Logic Unit . . . 21
CISC Complex Instruction Set Computing . . . 8
RISC Reduced Instruction Set Computing . . . 21
CC Clock Cycles . . . 29
DfT Design for Testability . . . 35
List of Tables
LOS Launch-off-Shift . . . xii
Func2LOC Functional-programs mapped into LOC scheme . . . 42
RTL Register Transfer Level . . . 9
ATPG Automatic Test Pattern Generator . . . 35
VCD Value Change Dump. . . .11
FSM Finite State Machine . . . 9
SE Scan Enable. . . .50
SI Scan-In . . . 50
SPICE Simulation Program with Integrated Circuit Emphasis . . . 54
DC Defect Coverage . . . 56
LT Logic Test . . . 63
ST Scan-chain Test . . . 63
Chapter
1
Introduction
The ever-increasing advances in semiconductor technology continue to open new issues for research in the domains of digital circuit design and process development. Designing and manufacturing smaller, faster, cheaper and low-power devices are some of the main challenges that for the semiconductor industry. The incessant increase in density and the corresponding decrease in feature sizes of integrated circuits as evinced by Mooreś Law [1] have been a driving force in the progress of the industry for the past few decades. However, scaling of CMOS structures into the nanometer domain has posed new challenges to the physical design and reliability of circuits. The reasons for this are manifold [2] [3] [4]. Firstly, manufacturing structures much smaller than the wavelength of light used in modern lithography are difficult to fabricate and can be practically done only with certain coarse limits. Similarly it is difficult to control the doping concentration for transistors in the nanometer range. Further, the structures are located closer to each other with every technology node, resulting in even the smallest of impurities or metal silvers being able to create shorts or other defects. Lastly, as the number of transistors, wires, contacts and vias on a single chip increase, the probability of one or more being faulty increases. These limitations have resulted in increasing the probability of defects in advanced technology nodes.
A circuit defect may lead to a fault causing an error that can result in a system failure. Manufacturing defects are physical defects introduced during manufacturing that cause the circuit to fail to function properly. The diversity of defects makes difficult to generate mean-ingful tests maximizing the defect coverage. Fault models which are gate-level representation of physical defects are necessary for generating and evaluating a set of test patterns. Gen-erally, a good fault model should accurately reflect the behavior of the physical defects and should be computationally efficient in terms of the time required for fault simulation and test generation [5]. Many fault models have been proposed so far, but unfortunately, no single fault model accurately reflects the behavior of all possible defects that can occur. As a result, a combination of different fault models is often used in the generation and evaluation of test patterns. Some well-known and commonly used fault models are the stuck-at, the bridging and the delay fault models. The stuck-at fault is a logical fault model that has been used successfully for decades. The gate-level stuck-at fault transforms the correct value on the
faulty signal line to appear to be stuck-at a constant logic value, either logic 0 or 1, referred to as stuck-at-0 (SA0) or stuck-at-1 (SA1), respectively. At the switch level, a transistor can be stuck-off or stuck-on, and these faults are also referred to as stuck-open or stuck-short faults respectively. A short between two wires is commonly referred to as a bridging fault. Delay faults have become more prevalent with decreasing feature sizes, and are used to model the excessive delays caused by resistive opens and shorts in wires as well as parameter varia-tions in transistors. In the gate-delay fault and transition fault models, a delay fault occurs when the time interval for a transition through a single gate exceeds its specified range. The path-delay fault model, on the contrary, considers the cumulative propagation delay along any signal path through the circuit. The small delay defect model takes into consideration the timing delays associated with the fault sites and propagation paths from the layout [6].
This in turn necessitates the need for having effective test architectures and methodologies for efficiently capturing all modeled faults while maintaining ease of application. Different test methodologies like parametric, functional and structural testing are combined together to maximize the fault detection. Parametric testing is typically used to check the electrical properties of the device and can be used to characterize any potential systematic issues with the process node. These tests may not check any functionality of the device but can find gross shorts, opens, leakage issues, or current drive problems. One of the uses of functional tests is for design verification wherein it is checked if the output responses are inline with expected values according to design specifications.
However it is considered very time consuming and very expensive due to the exhaustive nature of applying test patterns to cover each known reachable functional state. Structural tests deal with observing the state of internal signals at the primary outputs of a circuit. Unlike functional testing, it does not require enumeration of all functional states to test the design, so test volumes are not as large.
For any modern chip design with a considerably large portion of logic, embedding design for test (DFT) structures has become a mandatory part of the design process that helps to reduce the complexity of testing sequential circuits. In this context, scan design has been widely adopted across the industry due to the ability to achieve high fault coverage with relatively low overhead. The basic concept of a scan test is to connect memory elements like flip-flops or latches forming chains, so that shifting through scan chains allows controlling and observing the states of the DUT.
Delay tests verify that a design operates correctly at the specified clock speed. Application of at-speed tests for detection of delay faults in synchronous sequential circuits can be done using scan-based structural tests generated by an automatic test pattern generator (ATPG) or they can also be applied using the functional patterns [7]. Depending on how the transition is launched and captured during test, there are two delay test pattern generation methods in scan test environment. In the first method, referred to as Launch-Off-Shift (LOS), the last shift of the scan chain load also serves as the transition launch event whereas in the second method, referred to as Launch-Off-Capture (LOC), the entire scan data shifting is done at slow speeds and then two at-speed clocks are pulsed for launch and capture [8] [9] [10].
As device geometries continue to shrink, deep sub-micron delay defects become prominent, thereby increasing the need for at-speed tests. As tests generated for one fault model can
Chapter 1. Introduction
potentially detect faults of other models, identifying a good order of fault models to target during test generation can help reduce the number of test vectors and, in turn, test time.
The ideal goal while developing test patterns is to achieve 100% fault coverage with no test escapes. In conventional test flows, usually multiple tests are performed with different patterns generated for targeting different fault models. In this scenario, there is a great need for a unified test solution which may deal with both design verification and manufacturing testing if a potential correlation exists between these metrics. Although structural ATPG tests generally provide high fault coverage, they may lead to significant yield loss due to over-testing. This is due to the fact that some of these patterns may activate paths which are not required to meet system speed (for e.g. non functional paths), and these patterns may fail during production test. Herein the challenge lies in complementing functional test patterns with the high fault coverage obtained by structural ATPG patterns. In this context, there is a need for efficiently merging functional and structural test sets to develop an optimized test solution. Furthermore, the test pattern generation process must efficiently take into account the multiple diverging metrics of high fault coverage, low memory requirement and test-time while respecting the test power budget.
This is particularly relevant for modern processor based systems where the most efficient strategy for applying functional tests is the Software-Based-Self-Test (SBST). SBST is a test methodology based on the use of test programs to cover the faults inside specific processor blocks. A test program is first loaded in the processorś program memory, then executed and its results collected. These results can be used as a signature to determine the correct functioning of the target block. SBST is employed for complying with new standards mainly in the critical aviation and automotive applications that specify hard constraints regarding execution time, memory occupation, test frequency and test coverage.
Another issue related to the modern deep submicron technologies, is the fact that physical defects do not appear only in the cell interconnections but also inside the cell itself. They are called intra-cell defects [11]. It has been observed that these defects can escape classical test solutions using classical fault models (i.e., the inter-cell fault models). This phenomenon has been already investigated in the literature but mainly for the combinational gates [12] [13]. However, intra-cell defects affecting sequential elements (i.e., flip-flops) have not been targeted so far. Usually, scan chain test is applied only when flip-flops are in test mode. This classical way of testing the scan flip-flops results in low intra-cell defect coverage. Hence we need to review the applied shift-test to overcome these systematic intra-cell defects.
The main contribution of this thesis consists in providing effective test solutions targeting the issues encountered at different abstraction levels starting from the transistor level up_to the system level. More in details, we will investigate the Software-Based Self-Test (SBST) techniques and propose a methodology able to increase the achieved fault coverage without affecting the test length. Moreover, we will show how the SBST technique can be used coupled with structural test to maximize the fault coverage. In the second part of the thesis, we target the test of intra-cell defects affecting sequential elements. We will show that combining together different tests can lead to a meaningful defect coverage compared to existing tools and solutions.
of utilizing functional tests. It starts by discussing one of the most critical aspects of Integrated Circuit (IC) testing i.e. power-aware testing which has been the subject of many prior research works. The adopted technique consists of generating a set of power-hungry functional test programs which are used to tune the test power limits. Our first contribution provides a comprehensive evaluation of such programs taking into account other interesting test and verification metrics. Later in Chapter 2 we present a correlation analysis between all these metrics (i.e., the switching activity, the fault coverage and the verification of the design), collected at different levels.
Chapter 3 introduces the functional self-testing also called SBST strategy. The adoption of cumulative fault coverage of functional test programs and related constraints are discussed. Later in this chapter, we propose a static test compaction technique targeting a high test quality and minimum test length. Moreover in this chapter, the critical memory occupation is considered while implementing the test compaction technique.
Chapter 4 is devoted to describe functional test programs fault coverage analysis and test solutions targeting the observability issues and the property of each type of test (structural vs functional). This chapter first provides an in-depth analysis on the impact of reusing functional test programs for at- speed test by exploiting the existing scan chain circuitry. More specifically, we propose to map the functional test programs into a LOC-like test scheme. This analysis shows an increase of the fault coverage especially when the transition fault model is considered. In addition, a comparative analysis between the structural and the mapped functional test programs shows clearly the benefits of merging both sets and leads to a global test solution. In final part of chapter 4, an efficient test flow is proposed, based on a selection strategy thereby reducing the test length and the shifting power consumption since a scan-test scheme is used during the proposed mapping technique. We propose a refined scan-test length compaction based on pattern fault simulation and a constrained static test compression.
Chapter 5 covers a more granular topic concerning basically the structural scan testing. This study presents an in-depth study of the impacts of intra-cell systematic defects that first of all escape the classical test solutions using classical fault models and also may affect the scan chain test. This topic represents a sort of bridge between transistor and gate abstraction levels. As a first step, the basics of scan chain design and test are reviewed. Next, we briefly introduce the defect characterization process and show the intra-cell defects escape rate when standard tests are applied. This was our motivation to propose a high quality test solution. This latter is based on combining different test sets, generated by a commercial ATPG and targeting different fault models. An experimental case study of the application of the developed high quality test solution and other available commercial intra-cell-Aware ATPG is presented. Finally, a comparative analysis concludes the chapter.
Chapter
2
A Comprehensive Evaluation of Functional
Programs for Power-Aware Test
T
His chapter provides the first handling of the functional test programs and offers an overview of the context and the motivation of dealing with functional test in this thesis. In Section 2.1, a brief introduction of one of the most critical issues of IC manufacturing is presented (i.e, test overhead), presenting so one of the recent works which copes with test-power issues. Next, Section 2.2 provides a detailed and comprehensive eval-uation of the generated functional programs taking into account other interesting test and verification metrics. Moreover, with this latter, we could detect any correlation between the corresponding switching activity and those testing and verification metrics and generate based on that a meaningful test solution. Finally, Section 2.3 presents the obtained preliminary re-sults which will validate or not this correlation. Concluding remarks are given in Section 2.4. We note that since the Circuit Under Test (CUT) is a processor device, the considered functional patterns will refer to programs executed by the processor.2.1
Introduction
IC manufacturers exploit the technology scaling to produce smaller and faster electronic devices. However, manufacturing defects affecting latest technologies lead to dynamic faults (i.e., delay faults) [14]. Such faults require at-speed test to be detected. Usually, at-speed test is achieved by exploiting structural test patterns.
At-speed structural test leads to excessive power consumption that can either damage the Circuit Under Test (CUT) or lead to yield loss [15]. In fact, the yield loss is a case in which a good chip fails the test. This happens when the test exercises intensively the device making a high number of the capacitance charging and discharging simultaneously and results in phenomena such as IR drop and crosstalk [16] which in turn cause the critical path to be decelerated and results in a false fault detection.
2.1. Introduction
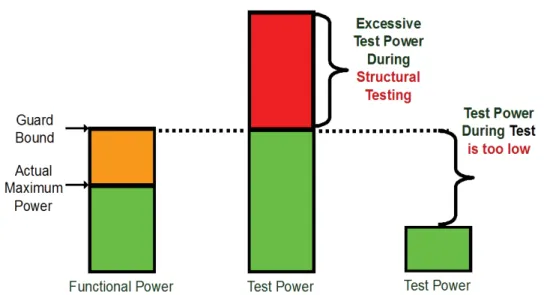
Reducing the power during test is a well-known technique, but reducing too much the power consumption leads to test escapes phenomena as depicted in Figure 2.1. Test escape, in the other side, is a case in which a faulty device passes the test. This happens when the test is not exercising the device to an extent where the switching activity is sufficient to cause the critical path to decelerate enough to make small delay defects observable and detectable. Thus remain undetected and the device escapes the test.
Figure 2.1: Over and under test phenomena
Therefore, to cope with the above issues, we have to control this risk by limiting the test power depending on the functional power of the device itself [15]. The knowledge of the actual functional power is thus mandatory. In [17], authors propose a generator of functional test programs for microprocessor core. The generator aims at maximizing the power consumption of the target microprocessor, thus the generated programs are good candidates to accurately estimate the functional power limits (i.e., to avoid both over- and under-test).
The functional programs generation has been carried out by Politecnico di Torino group [18][19] and hereunder to understand how this functional programs generator works. We refer to this generic and simplified version which will target the optimization of a given metric. It could be the induced power consumption, the fault coverage or also how much stressful are the generated test programs.
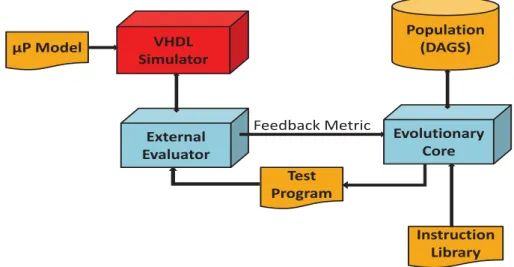
Chapter 2. A Comprehensive Evaluation of Functional Programs for Power-Aware Test µP Model Instruction Library External Evaluator VHDL Simulator Population (DAGS) Evolutionary Core Test Program Feedback Metric
Figure 2.2: Test program generation
Since our target is Central Processing Unit (CPU) cores, the input functional patterns are assembly programs. Figure 2.2 sketches the overall routine of this proposed efficient test programs generator composed of an evolutionary core, an instruction library and an external evaluator, totally separate blocks.
The evolutionary core cultivates a population of assembly programs which are internally represented as Directed Acyclic Graphs (DAGs), composed of different types of nodes. Basi-cally, it uses auto-adaptation mechanisms, dynamic operator probabilities, dynamic operator strength and variable population size. The instruction library is used to map individuals to valid assembly language programs. So according to the instruction library which contains a highly concise description of the assembly syntax, each node is mapped to a different instruc-tion. Finally, the external evaluator simulates the assembly program providing the necessary feedback to the evolutionary core.
By looking to this figure, we can rapidly figure out the importance of the feedback mecha-nism which permanently guides the optimizer (implemented in the evolutionary core). This optimizer is based on a technique called MicroGP (µGP), an evolutionary system able to au-tomatically devise and optimize a program written in a general assembly-like language [20]. Some features of µGP stem from genetic programming (GP) which is a technique whereby computers programs are encoded as a set of genes that are then modified using a generic population-based meta-heuristic optimization algorithms also known as Evolutionary Algo-rithms (EA). These latter, implemented in the evolutionary core in Figure 2.2, may be defined as local search algorithms since they sample a region of the search space dependent upon their actual state. The µGP is firstly fed by an initial set of test programs, randomly generated. These latter will be evaluated depending on the targeted metric using an external evaluator. Then, based on the feedback information (the estimated value), the generated test programs will be optimized.
Now back to our case study, the external evaluator tool corresponds to a power estima-tor tool which will determine the maximum peak power and thus driving the µGP for cor-rectly generating functional patterns with maximum peak power consumption (survival of the
2.2. Evaluation Framework
fittest). From an initial random population and resorting to Evolutionary Algorithm (EA), the µGP tool is able to maximize the power metric discarding the weak ones and improving the stronger patterns.
Since generated programs maximize the power consumption, they are definitively character-ized by a high switching activity [17]. In other words, they could be also good candidates for delay fault testing. In this work, we would like to investigate more in detail the capability of such generated functional-programs to satisfy other metrics than the power consumption. In this chapter, we will focus on two metrics: structural and functional. The first one is related to the fault coverage, where the fault models are the stuck-at and the transition faults. The second one corresponds to the code coverage, such as statement, branch and toggle coverage. The main goal of this comprehensive evaluation is to verify whether or not the above metrics are in some way correlated in order to provide a meaningful test that can be reused many times during the overall product flow (i.e., during verification and for power aware test). Our case study (i.e., targeted microprocessor) is the Intel mc8051 non-pipelined Complex Instruction Set Computing (CISC) processor, with 8-bit ALU and 8-bit registers, synthesized with a 65nm industrial technology as already presented in [17]. Next section will describe the evaluation framework for both structural and functional metrics.
2.2
Evaluation Framework
Previous work [17] proved that the switching activity correlates with the overall power con-sumption, therefore, we have to investigate if there exist some relations between the switching activity and the considered metrics (i.e., functional and structural). Basically, the question we would like to answer is: can the functional programs, generated to maximize the power consumption, be re-used for verification and test purposes?
In this chapter, we first evaluated the functional test programs generated in [17] with respect to the code and functional coverage. We measured how much these test programs can meet the design quality needs by exercising each piece of code in the behavioral description of the microprocessor.
Before starting the framework evaluation, a brief introduction of these new metrics (i.e., code & functional coverage metrics) could be helpful to understand the representation of each metric in the whole design verification flow. First of all, the code coverage concept is one of the most significant measurements to check the testbench completeness (how thoroughly the entire verification suite exercises the source code). It can help increase our confidence that the verification job is complete, but it should not be our only indicator. In fact, it gives us a great head-start on full verification coverage. Results from code coverage tools should be interpreted with a great precaution. They should be used to help identify corner cases that were not exercised by the verification suite.
Statement coverage : it measures whether or not a given statement was executed which is
different from the line coverage for the simple reason that we can find multiple state-ments on a line.
Chapter 2. A Comprehensive Evaluation of Functional Programs for Power-Aware Test
Branch coverage : it is considered as a refinement of the statement coverage (i.e., more
granular). It checks if each possible branch in an "if/else" or "case" statement has been exercised or not.
Usually during the Coverage-Driven Verification (CDV) process, it is easy with these two metrics (i.e., statement and branch coverage metrics) to achieve 100% coverage with the appropriate exclusions to meet the verification intent. In some cases, it is normal for some statements not to be executed (i.e., dead code). As effective practice, as mentioned in [21], this additional code simply monitors for conditions that should never occur and reports that an unexpected condition happened. Every statement and every branch was executed correctly, however the functionality are not completely tested. So, we need to consider more granular metrics.
Condition & Expression coverages : these metrics check if each possible sub-expression
has been evaluated or not.Thus would detect the missing evaluations.
Toggle coverage : it measures the amount of activity in the design, such as unused signals,
signals that remain constant, or signals that have too few value changes. This metric is very useful for testing tri-state wires.
Finite State Machine (FSM) coverage : this metric enters the realm of functional
veri-fication, since it monitors the coverage of the FSM representation of control logic blocks in the design. It is more sophisticated metric and based on behavioral not just language elements.
Additionally, high functional coverage does not necessarily correlate with high code coverage. Whereas code coverage is concerned with recording the mechanics of code execution, func-tional coverage is concerned with the intent of the implemented function. So two can serve to complement each others. We started by the most basic ones, which are the statement, toggle and branch coverage. Figure 2.3 depicts the overall evaluation frame. Basically, each test program is simulated using Modelsim [22] that reports the verification coverage. For this evaluation the Register Transfer Level (RTL) description of the microprocessor is used.
2.2. Evaluation Framework
Figure 2.3: Functional coverage flow
The second evaluation has been done with respect to the structural coverage. The test programs can act as test patterns to excite faults inside the gate-level description of the microprocessor. Targeted faults are the stuck-at and transition fault models. Similarly, we take here few lines to recall the definition of stuck-at and transition fault models that will be used for the rest of this thesis as the most relevant structural coverage metrics.
One of the most popular fault models in manufacturing test is the stuck-at fault model. As defined in [23], it is a logical fault model where any wire in the logic circuit can be stuck-at-1 or stuck-at-0. A test vector that produces the opposite value (zero for a stuck-at-1, and one for a stuck-at-0) will excite the fault. The effect of the fault has to be propagated to an observable circuit output in order for the fault to be detected by the vector.
For the second fault model (i.e., the transition fault model), there are two transition faults associated with each signal: a slow-to-rise fault and a slow-to-fall fault. A slow-to-rise (slow-to-fall) transition fault is a logical model for a defect that delays a rising (falling) transition. The extra delay caused by the fault is assumed to be large enough to prevent the transition from reaching the primary outputs at the time of observation. The transition fault is con-sidered to be detected if a transition occurs at the fault site and if a sensitized path extends from the fault site to any primary output.
For any fault model, given a test vector set, the fault coverage of the test vector set can be computed using fault simulation. For every possible fault in the fault model, it is checked for each vector in the vector set whether the fault is excited and propagated to a primary output. Fault coverage for a vector set is defined as the number of detected faults divided by the total number of faults. Fault coverage measures the "goodness" of a vector set in detecting all faults. A test set with higher fault coverage is more likely to detect bad integrated circuits and so fault coverage is used to drive the test generation process.
Figure 2.4 shows the corresponding evaluation flow. In this case each test program is still simulated using Modelsim [22] but the output is the mc8051 activity. The activity is stored
Chapter 2. A Comprehensive Evaluation of Functional Programs for Power-Aware Test
into a Value Change Dump (VCD) file. This file is then used as input for the fault simulator which is Tetramax [24].
Figure 2.4: Structural coverage flow
2.3
Experimental Results
In this section, we present a set of experiments, which provides an evaluation of func-tional test programs according to the metrics discussed previously: the code, funcfunc-tional and structural coverages.
2.3.1
Experimental Setup
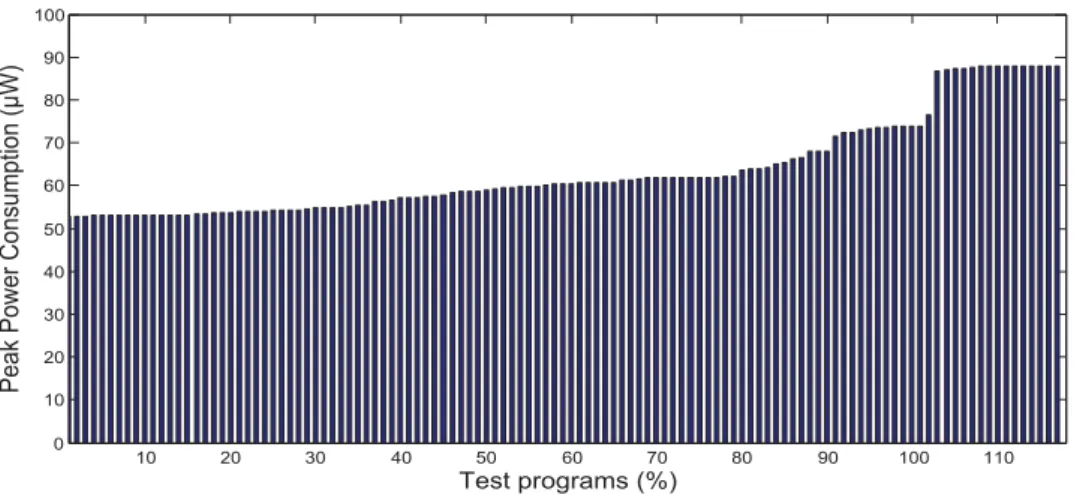
The population of functional test programs has been generated by using the methodology presented in [17]. The target circuit is the mc8051 synthetized using a 65nm technology. A total number of 117 functional test programs has been generated. Figure 2.5 depicts the generated programs on the X-axis and the peak power on the Y-axis. By construction, the peak power increases at each new test program, leading to have a very effective test set for maximizing the power consumption of the circuit.
2.3. Experimental Results 10 20 30 40 50 60 70 80 90 100 110 0 10 20 30 40 50 60 70 80 90 100
Peak Power Consumption (µ
W)
Test programs (%)
Figure 2.5: Functional program generation
Since all experiments will focus on evaluating these test programs, we keep the same order as the one shown in Figure 2.5. As we mentioned before, the goal of this contribution consists in evaluating functional test programs considering other metrics, nevertheless satisfying the power consumption one. In this way, we can detect prospective correlation between these metrics.
2.3.2
Functional Coverage Evaluation Metrics
The functional coverage metrics are exploited by the CDV. It is usually used in order to improve prototype quality by identifying untested areas of the design and locating potential overlaps (i.e., redundancies). It measures how well these test programs exercise both structural and functional codes of the design. As we mentioned in the section 2.2, functional coverage is measured by using the behavioral description of the mc8051 microprocessor.
In this section, we present the most common functional code coverage to evaluate our test programs, which are Statement, Branch, Condition, Expression and Toggle coverage, shown in Figures 2.6, 2.7, 2.8, 2.9 and 2.10, respectively.
10 20 30 40 50 60 70 80 90 100 110 45 50 55 60 Test programs (%)
Statement Code Coverage (%)
Chapter 2. A Comprehensive Evaluation of Functional Programs for Power-Aware Test
We started the code coverage evaluation metric by the most basic criterion, which is the Statement coverage, measuring whether or not a given statement in the RTL code of the design was executed. The vertical axis in Figure 2.6 represents the average statement code coverage of the whole behavioral description with its different modules. The statement coverage, exercised by this test programs set, varies between 47% and 59%, but no correlation with the switching activity has been observed with this distribution.
10 20 30 40 50 60 70 80 90 100 110 30 32 34 36 38 40 42
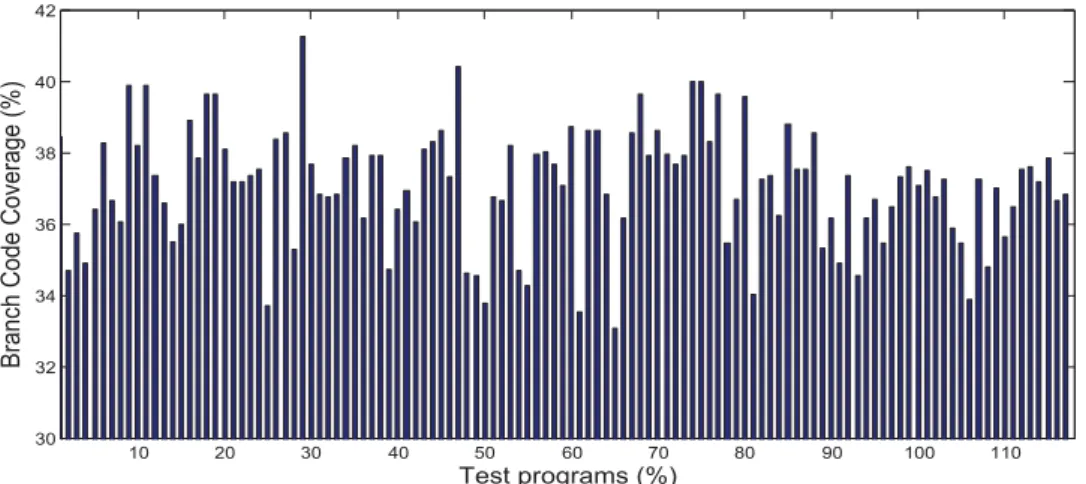
Branch Code Coverage (%)
Test programs (%)
Figure 2.7: Branch code coverage evaluation
Let us move to the branch coverage, which is more granular. Figure 2.7 shows an average branch coverage variation estimated between 33% and 41%. As for the statement code cov-erage, it does not represent correlation with the activity induced by test programs. These results may depend on the targeted module during the switching activity extraction process. We also consider the verification of the design functionality by evaluating our test programs in terms of Condition, Expression and Toggle coverage in Figures 2.8, 2.9 and 2.10. These criteria would detect the missing evaluations in the design. We recall that the X-axis in these figures corresponds to the evaluated functional test programs in an ascending order of their switching activities. 10 20 30 40 50 60 70 80 90 100 110 23 23.5 24 24.5 25 25.5 Test programs (%)
Condition Code Coverage (%)
2.3. Experimental Results 10 20 30 40 50 60 70 80 90 100 110 30 32 34 36 38 40 42 44 46 48
Expression Code Coverage (%)
Test programs (%)
Figure 2.9: Expression code coverage evaluation
10 20 30 40 50 60 70 80 90 100 110 40 45 50 55 60 65
Toggle Code Coverage (%)
Test programs (%)
Figure 2.10: Toggle code coverage evaluation
Similarly to the previous cases, we do not observe any correlations between the induced switching activity of the generated programs and code coverage. These results are unexpected. However, a possible explanation could be the following: The programs generation process [17] exploits the gate-level netlist of the microprocessor. It means that the switching activity is maximized at gate-level and this does not necessary lead to a high activity at RT-level. More-over, as cited in [23], statements in the Hardware Description Language (HDL) description may correspond to hundreds of gates and wires in the final design, which also could explain the obtained results.
2.3.3
Structural Coverage Evaluation Metrics
The last part of this comprehensive evaluation focus on the structural coverage of the considered test programs. As mentioned in the introduction, this study targets stuck-at and transition fault models. Please note that in order to identify any potential correlation between the switching activity and the structural fault coverage metrics, the functional test programs in the subsequent figures of this section are sorted in ascending order of their switching activity
Chapter 2. A Comprehensive Evaluation of Functional Programs for Power-Aware Test
like in Figure 2.5.
We started this evaluation, by estimating the stuck-at fault coverage of these test programs, using TetraMAX as a fault simulator. Definitively, we do not expect a higher coverage for the simple reason that these programs do not target structural coverage. In this experiment, we aim at measuring the impact of the switching activity in detecting stuck-at faults.
10 20 30 40 50 60 70 80 90 100 110 30 32 34 36 38 40 42 Test programs (%)
Stuck at fault Coverage (%)
Figure 2.11: Stuck-at fault coverage
A first impression given by Figure 2.11, does not really invalidate our hypothesis since stuck-at faults are not mandatorily sensitized when increasing the switching activity of the circuit. Stuck-at faults coverage achieved by functional test programs varies between 33% and 40% without any special monotony which confirms our expectation.
Refined analysis could be more expressive if we focus on the observability of stuck-at faults, which means the capacity of test programs to sensitize stuck-at faults. In this way, we separate sensitization issues from propagation ones and try an optimistic evaluation.
10 20 30 40 50 60 70 80 90 100 110 42 43 44 45 46 47 48 49
Not Observed Stuch at Faults (%)
Test programs (%)
Figure 2.12: Stuck-at fault observability
As we can observe in Figure 2.12, we get a slight variation between 42% and 47.5% of, sensitized but not observed, stuck-at faults. The slope of the trend line is close to zero, which
2.3. Experimental Results
invalidates any possible correlation with activity induced by the evaluated test programs. However the interesting thing is that a big amount of stuck-at faults is sensitized but not observed. 10 20 30 40 50 60 70 80 90 100 110 15 16 17 18 19 20 21 22 23 24 25
Transition fault Coverage (%)
Test programs (%)
Figure 2.13: Transition fault coverage
Therefore, if we proceed similarly to evaluate the transition fault coverage, achieved by the same functional test programs set, we obtain as depicted in Figure 2.13 a variation between 18.7% and 23.9% without any special monotony. However we measure a considerable per-centage of sensitized but not observed faults with the same tests set. This perper-centage can reach 65.1%, as depicted in Figure 2.14. Even if these results do not allow us to confirm a good correlation between structural coverage and circuit activity, we can anyway make one consideration. A large number of faults (i.e., stuck-at and transition) are sensitized but not observed. Thus, further investigation has to focus on how to improve the observability to increase fault coverage.
10 20 30 40 50 60 70 80 90 100 110 60 61 62 63 64 65 66
Not Observed Transition Faults (%)
Test programs (%)
Chapter 2. A Comprehensive Evaluation of Functional Programs for Power-Aware Test
2.4
Summary
In this chapter, we evaluated a set of test programs able to maximize the peak power consumption, thus characterized by higher switching activity, with respect to the code and structural coverage metrics. During this study, we analyzed different sub-metrics to exam-ine a potential correlation between the induced switching activity and the code or/and the structural coverages. The main goal is to propose a comprehensive test solution which deals with both verification and testing at the same time. First results, which are not expected, reject any correlation with the code coverage metric. However, we observed that many faults are sensitized but not observed by our functional programs. Only comparing the obtained fault coverage with the induced switching activity does not show any direct correlation in the observed trends. This necessitates further investigation into the occurrence of non-observable faults to have a more meaningful evaluation.
Before moving to any observability enhancement, which will be discussed in chapter 4, let us consider a more common situation where no information about the internal structure of the design are available. In such cases, it gets difficult to verify the effectiveness of the functional programs for in-field test. Next chapter deals with the factors required for in field test. Moreover, we also discuss and propose techniques for test program compaction for a better test coverage evaluation with lower test length and test time.
Chapter
3
An Effective Approach for Functional Test
Programs Compaction
Contents
2.1 Introduction . . . . 5 2.2 Evaluation Framework . . . . 8 2.3 Experimental Results . . . . 11 2.3.1 Experimental Setup . . . 11 2.3.2 Functional Coverage Evaluation Metrics . . . 12 2.3.3 Structural Coverage Evaluation Metrics . . . 142.4 Summary . . . . 17
I
N this chapter, we first investigate on increasing the fault coverage by merging together the functional test programs and then we compacted them while conserving the obtained fault coverage. Section 3.1 introduces the context of dealing with SBST strategy and their related constraints which lead us to focus on test program compaction techniques. Next, Section 3.2 introduces the targeted microprocessors and we detail herein the test program generation process for each one by using the µGP tool [18]. Then, Section 3.3 presents the fault coverage analysis by giving the main idea of the proposed compaction technique that is further detailed in Section 3.4. Section 3.5 analyzes the experimental results. Finally, Section 3.6 concludes this chapter.3.1
Introduction
With the incredible fast advances in very large scale integrated circuit technology, pro-cessors design become more and more complex. This complexity combined to the limited accessibility of the microprocessors internal logic, makes the testing task harder and then
3.1. Introduction
classical approach of deriving tests based on the gate level description of microprocessors inefficient. Many reasons could justify that. The size overhead of the design coupled with a lack of DFT techniques in some microprocessors, make the use of gate level in sequential ATPG impractical. Also some physical failures in integrated circuits result in logic behavior which can not be modeled by stuck-at faults. Moreover, the test generation using a sequential ATPG is time-consuming process. On the other hand, at-speed system testing and embed-ded cores in SOC, require faster and autonomous test methods which are resumed in the functional test properties. Functional test allows the execution of test programs at the same frequency which means testing the system at-speed. In addition, this kind of test is easier to implement and test programs, through low frequency interfaces, are rapidly accessible by the processors once uploaded in the memory. Last but not least, with functional test we gain a high flexibility (i.e., it could be adjusted for different targets) and a comprehensive test by means the functional test could cover the whole system including each single module and their interconnections. For these reasons, functional test is widely adopted and could be a complementary or alternate solution for the classical approaches, depending on whether it is adopted for end-of-manufacturing or in-field test.
In functional test, only the functional input signals of a circuit (or module) are stimulated and only functional output signals are observed. Therefore, functional test guarantees that the circuit is tested under normal conditions thus avoiding any over- as well as under-test [15].
For processor-based systems, the most efficient strategy for applying a functional test is called Software-Based Self-Test (SBST) [25]. This strategy is based on the execution of a set of functional test programs on the target processor. Although SBST solutions are usable by the manufacturer for post-production test and by the customer for incoming inspection and on-line test, they are particularly suited for the latter case when processor-based systems are considered (i.e., since it may be the only available option). For example, a dedicated functional test program (or a set of test programs) can be periodically executed during the mission time.
In this context, it is clear that the test length (i.e., how many programs) as well as the test time is a very important issue for this type of test (i.e., the size of the test set is large in the case of functional test generation compared to structural). Here, we distinguish the test application time from the test length since conversely to the test pattern application, there is no linear relationship between them and the reason could be simply explained if we look at the structure (i.e., content) of test programs. They include flow-control instructions (i.e, including loops, conditional execution, subroutines, and so on). In addition to that, SBST test solutions should be minimally intrusive in the system’s operation [26]. Indeed, functional test programs have to be as small as possible while achieving the highest fault coverage.
Some approaches have been proposed so far in the literature to deal with both the memory occupation and the test program length. Although all these approaches share the same title, test compaction process, two main classes of techniques can be identified: dynamic
compaction and static compaction. The first one acts during test generation. It can
usually achieve good results but at the cost of a high generation time. On the other hand, static compaction is applied after the test generation process. Even if it does not impact the generation time, it can lead to less compaction compared to dynamic compaction since it does
Chapter 3. An Effective Approach for Functional Test Programs Compaction
not allow any pattern regeneration.
In [27] a dynamic compaction method is proposed. It extracts from a functional test pro-gram an independent fragment (called a spore) whose iteration allows achieving a given fault coverage. The authors describe a method to identify the best sequence of spore activations that can achieve the same initial fault coverage, by resorting to an evolutionary approach. The method is effective, but could only be applied under strict constraints as, for example, the test of an arithmetic unit. In [28] authors propose an algorithm able to automatically compact an existing functional test program. Based on instruction removal and restoration solutions, they showed great compaction capabilities keeping in mind the computational costs. In [29] a new static compaction procedure was proposed to better fit in-field constraints for cores in embedded systems. By using an evolutionary-based strategy, authors were able to discrimi-nate which are the instructions in a given test program are not contributing on the testing goals.This procedure was applied to a set of test programs (i.e., generated using different approaches) targeting a couple of modules inside the minimips pipelined processor core.
The main goal of this chapter is to investigate the static test compaction of a given set of functional test programs. Which means that test compaction does not interfere with the test generation process, and compacts the test program after it is generated. The input is a functional test set composed of many functional test programs. The investigation aims at understanding and determining how to select the best functional test program candidates to obtain the smallest set having the best fault coverage. Conversely to [28] and [29], this approach is applied at test program level and not instruction level. By means, the entire functional test program could be removed or restored based on its contribution in the cumu-lative test coverage in a specific order. In other word, we consider the context in which we do not have any specific information about the test program itself, which is usually the case in practice, and we aim at compacting it while preserving the initial fault coverage with respect to a given fault model.
Moreover, we assume in this work that test programs are totally independent from each other in term of fault coverage. Hence, for each test program, we could compute the set of detected faults with a single fault simulation. Results carried out on two different micropro-cessors show that a 49% reduction in test length and a 28.7% reduction in test application time can be achieved.
3.2
Context and Background
In this work, to evaluate the effectiveness of the functional test programs compaction, we used two different processors having different architectures. The first processor, already described in Chapter 2, is the Intel mc8051 which represents a classical Harvard architecture, non-pipelined CISC architecture, with 8-bit Arithmetic Logic Unit (ALU) and 8-bit registers [30]. The second processor is the minimips, 5-stages-pipelined Reduced Instruction Set Computing (RISC) processor, with 32-bit ALU and 32-bit registers [31]. Both processors have been synthesized with the same industrial 65nm technology. Table 3.1 gives the main characteristics of the synthesized processors in terms of number of Gates, Flip-Flops, Primary Inputs and Primary Outputs.
3.3. Fault Coverage Analysis
Table 3.1: Mc8051 & minimips gate-level characteristics
Cores #Gates #FFs #Scan-Chains #PIs #POs #TFs
Mc8051 4307 576 1 65 94 30706
Minimips 8612 1785 1 38 67 79690
We started from two different functional test sets targeting two different microprocessors. Both tests have been generated using the µGP tool [32]. This tool, based on a genetic approach, is able to generate a population of functional test programs optimizing one or more constraints.
The first set of functional test programs, as presented in Chapter 2 has been generated in order to maximize the power consumption of the mc8051. Till now, we did not prove yet that functional programs maximizing power consumption can achieve important fault coverage. We just marked a high amount of not observed faults when fault simulating these functional test programs (see chapter 2). We will explore later how to deal with observability issue and then we may validate this assumption. On the other hand, the second test set has been generated to maximize the stuck-at fault coverage on minimips. Using the same µGP tool but constrained to maximize the stuck-at fault coverage, as already explained in chapter 2, an efficient test set of 110 functional test programs has been generated showing high stuck-at fault coverage figures.
3.3
Fault Coverage Analysis
As already described, the two sets of functional test programs have been generated by considering different targets (i.e., maximizing the power consumption and maximizing the stuck-at fault coverage). Therefore, the first part of our analysis is about the fault coverage achieved by those test sets. The considered fault models are the stuck-at and the transition fault models. This kind of analysis has been already presented in detail in chapter 2.
0 10 20 30 40 50 60 0 20 40 60 80 100 St u ck -A t F a u lt C o ve ra ge ( % ) Test Programs Stuck-At Fault Coverage (%)
Figure 3.1: Stuck-at fault coverage achieved by functional test programs generated for the minimips
Figure 3.1 plots the stuck-at fault coverage distribution achieved by the functional test programs generated for the minimips. All fault simulations have been carried out by using
Chapter 3. An Effective Approach for Functional Test Programs Compaction
a commercial tool [24]. Those functional test programs correspond to the last generation carried out by the µGP tool. As can be seen, the fault coverage varies significantly depending on the programs. Actually, the minimum fault coverage is 4.70% while the maximum is 52%. Table 3.2 reports the same analysis for both processors. For each one, we give the maximum and minimum stuck-at as well as transition fault coverage achieved by the functional test programs. Also, we do not forget to give more details about the minimum and maximum memory requirements and test time in columns 5 and 6. The last column reports the number of functional test programs generated for each processor.
Table 3.2: Functional test programs analysis
Metrics SAF (%) TF (%) Size (Bytes) Duration (Clock Cycles) Prog
Max 43.45 25.07 618 1.158 ∗ 103 Mc8051 Min 35.67 19.61 346 1.070 ∗ 103 117 Max 52.00 43.49 1540 19.61 ∗ 103 Minimips Min 4.70 1.02 32 21.5 110
As we can see for the minimips, and conversely to the mc8051, from one test program to another, we can have a huge difference in terms of memory requirement (i.e., from 32 bytes to 1540 bytes) and test application time (i.e., from 21.5 to 19615 clock cycles). This could be explained by the fact that these test programs were generated to enhance stuck-at fault coverage which does not require obligatory a high number of clock cycles. In fact there is no linear relationship between the stuck-at fault coverage and the required clock cycles among the generated test programs. We will investigate later the impact of this in the proposed test compaction methodology. The next analysis we made was about the redundant tested faults (i.e., faults detected by more than one functional test program).
Progi Progj Progj Progi Progi Progj c) b) a)
Figure 3.2: Test redundancy
Figure 3.2 shows the three possible cases of equivalent faults when considering two func-tional test programs i and j. For each program, we plot the set of detected faults defined as P rogi and P rogj. In the first case shown in 3.2.a), some faults are covered by both P rogi
and P rogj programs. In this case, the same faults are determined by the intersection between
detected fault sets. In the second case shown in 3.2.b), all faults covered by P rogj are also
covered by P rogi. In this case, P rogi is the superset of P rogj. Finally, in the last case shown
in 3.2.c), there is no relation between the two sets. The two programs detect different faults. The described cases can be formalized as follows:
3.3. Fault Coverage Analysis a) P rogi u P rogj Ó= ⊘ b) P rogi u P rogj = P rogj c) P rogi u P rogj = ⊘
In the next subsection, we describe how the three cases have been considered in order to deeply analyze the achieved fault coverage.
3.3.1
Fault Coverage Merging
The main idea behind Fault Coverage Merging is to understand whether or not it is possible to combine together functional test programs to achieve the highest fault coverage. The final goal is clearly to remove as many test programs as possible without impacting the fault coverage. Clearly, each program has to be fault simulated in order to compute the set of detected faults.
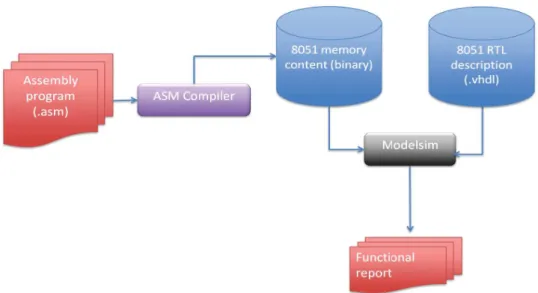
Figure 3.3: Flow for determining the set of detected faults
Figure 3.3 sketches the flow for determining the set of detected faults. Basically, each functional test program is simulated using Modelsim [22] in order to store the Input/Output activity into a VCD file. For this evaluation the RTL description of the microprocessor is used. The VCD file is then used as input for the fault simulator, which is TetraMAX [24]. The fault simulator requires the processor described at gate-level (i.e., the netlist). The result of the fault simulation of a given test program i, is a set of detected faults which is simply defined as follows:
Chapter 3. An Effective Approach for Functional Test Programs Compaction
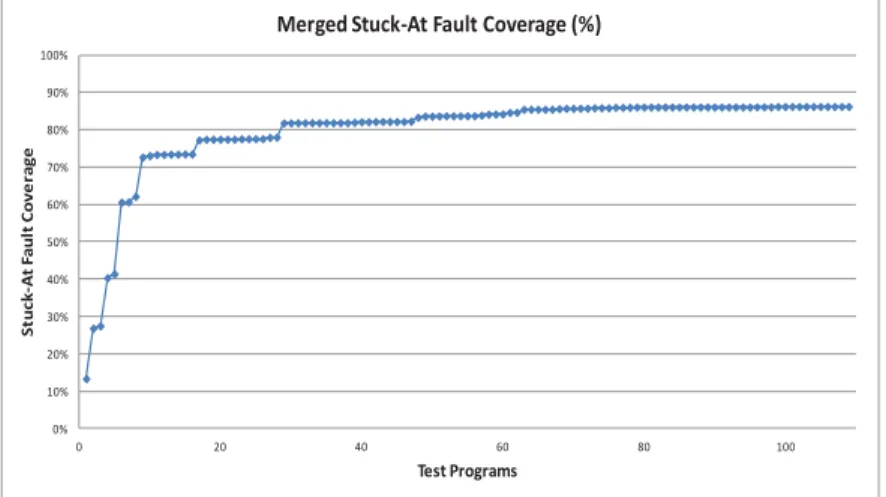
In the charts shown in Figure 3.4 and Figure 3.5, we plot the merged stuck-at and transition fault coverage respectively, obtained for the minimips. As can be seen in both curves, the fault coverage increases every time a functional test program is fault simulated. From a formal point of view, we see that the relations between the set of detected faults mostly have the same behavior as the cases shown in Figures 3.2.a and 3.2.c. In other words, many functional test programs detect different faults. The limit reached by the merged fault coverage is about 90% for the stuck-at faults and 80% for the transition faults. This is actually very good fault coverage for a functional test.
Another interesting property of the two curves is the fact that they are composed of steps. For example, for the stuck-at faults, we can notice that once the fault coverage reaches 70%, it remains constant for a while and then it directly ramps up to 79%. It means that after reaching 70% of faults, the next ten fault simulated test programs do not contribute to further improve it. Thus, their set of detected faults is completely included in the previous one. This is the case shown in Figure 3.2.b. In other words, those programs are redundant.
Results for the mc8051 have the same characteristics. The limit reached by the merged fault coverage is about 60% for stuck-at faults and 39% for transition faults. The difference in terms of fault coverage between the two processors is easily explained by the fact that the test set generated for the mc8051 maximizes the power consumption and not the fault coverage.
0% 10% 20% 30% 40% 50% 60% 70% 80% 90% 100% 0 20 40 60 80 100 St u c k -A t F a u lt Co ve ra ge Test Programs
Merged Stuck-At Fault Coverage (%)
Figure 3.4: Merged stuck-at fault coverage for the minimips
The most important result obtained by this analysis is the demonstration that test programs may easily be redundant. Those programs can be removed since they do not contribute to the overall fault coverage. An interesting property of merging the fault coverage is that the order of test programs execution impacts the number of redundant programs. Let us consider the following example. We have three test programs P1, P2 and P3. Those programs are characterized by the following DTs:
• DT1 = {f1, f2, f3, f5}
• DT2 = {f2, f4}
3.3. Fault Coverage Analysis 0% 10% 20% 30% 40% 50% 60% 70% 80% 90% 0 20 40 60 80 100 T ra n s it io n F a u lt C o v e ra g e ( % ) Test Programs Merged Transition Fault Coverage (%)
Figure 3.5: Merged transition fault coverage for the minimips
Let us now consider two different program execution orders: P1-P2-P3 and P3-P2-P1. For the first execution order, we start from the execution of P1 that detects the faults in DT1. Then, we execute P2. The overall detected faults is computed by the union between DT2 and DT1:
• DT2−1= DT2 t DT1 = {f1, f2, f3, f4, f5}
P2 is not redundant with respect to P1 because DT1 is not a superset of DT2. We finally execute P3 and we still compute the final set of detected faults.
• DT3−2−1 = DT3 t DT2−1 = {f1, f2, f3, f4, f5}
In this case the number of detected faults does not increase because the set DT2-1 is a superset of DT3. Thus, for this program execution order, P3 becomes redundant and thus, it can be removed. We come back now to the second execution order P3-P2-P1. We apply the same steps as we did for the first one:
• DT3−2= DT3 t DT2 = {f2, f4, f5}
• DT3−2−1 = DT1 t DT3−2 = {f1, f2, f3, f4, f5}
For the second execution order, we do not identify any redundant program because at each step we increase the set of detected faults. Obviously, the final fault coverage remains the same, irrespective of the order. To conclude, for the first execution order, we can apply only two test programs while for the second order, we must apply all the three programs.
In the next section, we will describe the proposed compaction technique based on the program execution order. The goal is to identify the execution order which is able to reduce as much as possible the functional test length.