UNIVERSITÉ DU QUÉBEC À MONTRÉAL
DEVELOPMENT OF A MINIA TURIZED PASSIVE AIR SAMPLER TO CHARACTERIZE THE EXPOSURE OF EMERGING CONTAMINANTS IN
BIRDS
MASTER THESIS PRESENTED
AS A PARTIAL REQUIREMENT
OF THE MASTER'S DEGREE IN ELECTRICAL ENGINEERING
BY ALI REZAEI
UNIVERSITÉ DU QUÉBEC À MONTRÉAL Service des bibliothèques
Avertissement
La diffusion de ce mémoire se fait dans le respect des droits de son auteur, qui a signé le formulaire Autorisation de reproduire et de diffuser un travail de recherche de cycles supérieurs (SDU-522 - Rév.0?-2011 ). Cette autorisation stipule que «conformément à l'article 11 du Règlement no 8 des études de cycles supérieurs, [l'auteur] concède à l'Université du Québec
à
Montréal une licence non exclusive d'utilisation et de publication de la totalité ou d'une partie importante de [son] travail de recherche pour des fins pédagogiques et non commerciales. Plus précisément, [l'auteur] autorise l'Université du Québec à Montréal à reproduire, diffuser, prêter, distribuer ou vendre des copies de [son] travail de recherche à des fins non commerciales sur quelque support que ce soit, y compris l'Internet. Cette licence et cette autorisation n'entraînent pas une renonciation de [la] part [de l'auteur] à [ses] droits moraux ni à [ses] droits de propriété intellectuelle. Sauf entente contraire, [l'auteur] conserve la liberté de diffuser et de commercialiser ou non ce travail dont [il] possède un exemplaire.»UNIVERSITÉ DU QUÉBE
C À MONTRÉAL
DÉVELOPPEMENT D'ÉCHANTILLONEURS D'AIR MINIATURISÉS ET
EMBARQUÉS
SUR DES
OISEAUX POUR LA CARACTÉRISATION DE LEUR
EXPOSITON À DES NOUVEAUX CONT
AMINANTS
MÉMOIRE
PRÉSENTÉ
COMME EXIGENCE PARTIELLE
DE LA MAÎTRISE EN
GÉNIE ÉLECTRIQUE
PAR
ALIREZAEI
REI'vŒRCIEI'vŒNTS
Je tiens à remercier mon directeur de recherche, Pr Ricardo Izquierdo, ainsi que mon codirecteur, Pr Jonathan Verreault pour leurs conseils et leurs suggestions qui m'ont été utiles durant tout mon mémoire.
Je remercie aussi madame Manon sorais, Dr Sujittra Poorahong et monsieur Mojtaba Mirzaei, Alexandre Robichaud, Dr Sujittra Poorahong, ainsi que les organisations suivantes pour leurs soutiens : UQAM, CoFaMic, TOXEN, A VITOX, RESMIQ, la Chaire de recherche du Canada, et le Fond de recherche nature et technologies.
Finalement, je tiens à remercier ma femme et ma mère, qui m'ont soutenu tout au long de ce périple, du début à la fin, des meilleurs moments aux plus difficiles.
TABLE OF CONTENTS
LIST OF FIGURES ... ix
LIST OF TABLES ... xiii RÉSUMÉ ... xv
ABSTRACT ... xvii CHAPTERI INTRODUCTION ... 1
1.1 Project description ... 1
1.2 Passive and active air sam piers ... 3
1.2.1 Passive air sam piers ... 4
1.2.2 Active air sam piers ... 9
1.3 Problematic and objectives ... 11
1.6 Methodology ... 13
1.5 Thesis presentation ... :.l4 CHAPTER II PASSIVE AIR SAMPLER CONCEPT DESIGNS AND SIMULA TI ONS ... 17
2.1 Design 1 ... 20
2.1.1 Pattern 1 ... 20
2.1.2 Design 1 siinulation ... 21 2.2 Design 2 ... 24
2.2.1 Pattern 2 ... 24
2.2.2 Design 2 simulation ... 26
2.3 Design 3 ... 29
2.3.1 Pattern 3 ... 29
2.3.2 Design 3 siinulation ... 31
vi
2.4.1 Pattern 4 ... 33
2.4.2 Design 4 simulation ... 36
2.5 Design 5 ... 39
2.5.1 Pattern 5 ... 39
2.5.1.1 Pattern 5-1 ... 39
2.5 .1.2 Pattern 5-2 ... 43
2.5.2 Design 5 Simulation ... .45
2.6 Design 6 ... 49
2.6.1 Pattern 6 ... 49
2.6.2 Design 6 sitnulation ... 54
2.7 PAS comparison and selection ... : ... 53
2.7.1 PASs's drag values ... 58
2. 7.2 PASs comparison and selection procedure ... 60
2.8 Resume ... 64
CHAPTER III PASSIVE SAMPLER FABRICATION AND TESTING ... 65
3.1 PAS fabrication ... 65
3.2 Adsorbents ... 68
3 .2.1 Polyurethane foam ... 68
3.2.2 Glass fiber filter (GFF) ... 70
3.2.3 Polydimethylsiloxane (PDMS) ... 70
3 .2.4 Graphene oxide ... 72
3.3 PAS onsite testing ... 72
3.4 Resume ... 75
CHAPTERIV EMBEDDED ELECTRONIC CIRCUIT ... .-... 77
4.1 Sensors and their utilization ... 77
4.2 Airspeed measurement electronic circuit ... 83
4.3 PAS concept design (modified to embed the sensors) ... 88
vii
4.5 Sensor validation and calibration ... 96
Summary and discussion ... 102
Conclusion ... 105
LIST OF FIGURES
Figure 1.1 : Flame and non-fla me retardant pa pers testing against fi re ... 00 oo•oo··· oo ... 2 Figure 1.2 : Birds flying around landfill and searching for food ... 3 Figure 1.3 : A usual passive air sampler schematic with one sample medium inside .. 5 Figure 1.4 : A usual passive air sampler schematic with two sample mediums inside. 6 Figure 1.5 : A real passive air sampler during sampling process ... 00. 6 Figure 1.6: A helmet used as a passive air sampler with an inside sampling medium 7 Figure 1.7: Flow-through sampler ... 8 Figure 1.8 : An active air sampler ... 10 Figure 2.1 : PAS first concept design ... 20 Figure 2.2 : 3D view of design 1 000000000000000000 00000000000000 0000000000 0000000000000000000000000000 0000 0000 00.21 Figure 2.3 : Volume Tetra angle non-structural mesh on design 1 - side viewoooooooooo 22 Figure 2.4 : Design 1 vectorial airflow result on PAS, side view, middle plane 00000000 23 Figure 2.5 : Design 1 vectorial airflow result on PAS, top view oooooooooooooooooooooooooooooooo 23 Figure 2.6 : Design 1 vectorial airflow result, top view, PAS body included oooooooooooo· 24 Figure 2. 7 : PAS second concept design oooooooooooooooo .. oooooooooooooooooooooooooooooooooooooooooooooooooo• 25 Figure 2.8 : PAS second concept design 3D view 00000000 00000000 oooooooo .. oooooooo .... oooo .. oooooooooo 25 Figure 2.9: Volume Tetra angle non-structural mesh on design 2, Top viewoooooooooooo27 Figure 2.10 : Design 2 vectorial airflow result, top viewoo .. oooo .. oooo .... oo .. oooooooooooooooooooooo 27 Figure 2.11 : Design 2 vectorial airflow result, 3D si de view, PAS body included oo• 28 Figure 2.12 : Design 2 vectorial airflow result, 3D top view, PAS body included 0000 28 Figure 2.13 : PAS third concept design oooooooooooooo .. oooo .. oooooo .. oo .. oooooo .. oo .. oooo .... oooooooooooooooo 30 Figure 2.14: PAS third concept design 3D view. (a) Bottom view. (b) Top viewoooo.30 Figure 2.15 : Volume Tetra angle non-structural mesh on design 3 -si de view .. oo .. oo 31 Figure 2.16 : Design 3 vectorial airflow resu lt, si de view .. 000000 00 oo .. 00 .... 0000 .... oooo .. oooo .... 32
x
Figure 2.17 : Design 3 vectorial airflow result, top view ... 32
Figure 2.18: Design 3 vectorial airflow result, 3D view ... 33
Figure 2.19 : PAS fourth concept design bottom part ... 34
Figure 2.20: PAS fourth concept design 3D view ... 34
Figure 2.21 : PAS fourth concept design top part ... 35
Figure 2.22 : PAS fourth concept design top part 3D view ... 35
Figure 2.23 :PAS fourth concept design parts positioning in 3D view ... 36
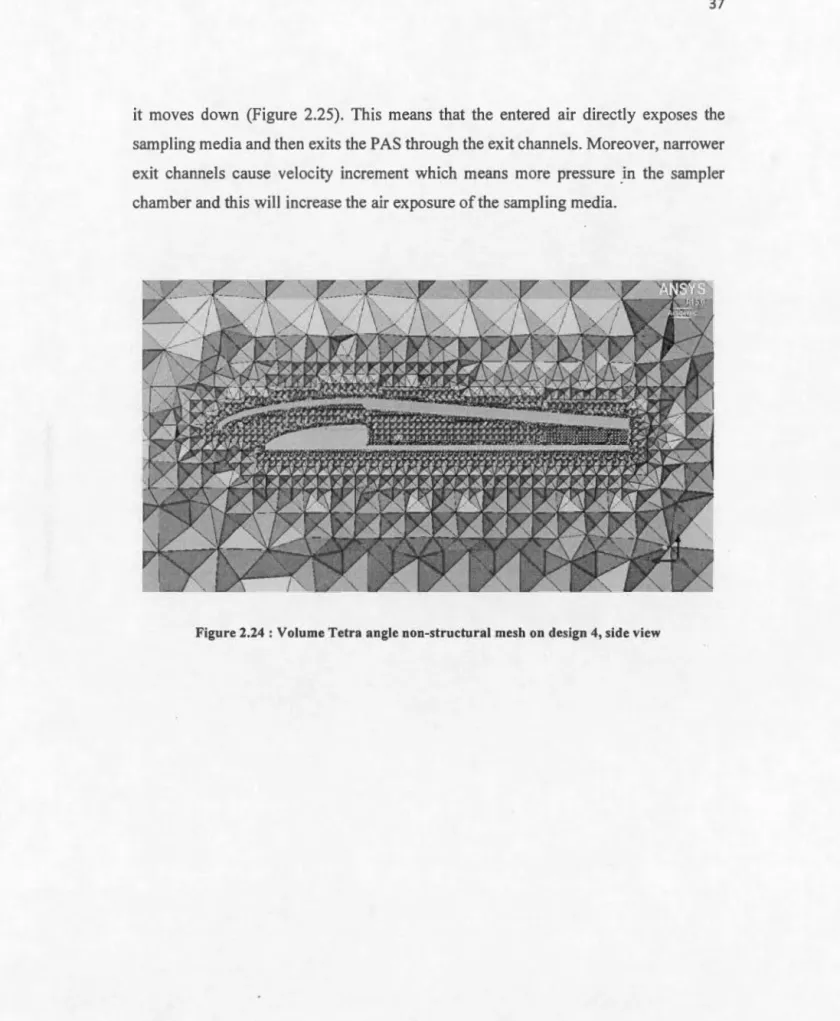
Figure 2.24: Volume Tetra angle non-structural mesh on design 4, side view ... 37
Figure 2.25 :Design 4 vectorial airflow result, side view ... 38
Figure 2.26: Design 4 vectorial airflow result, 3D view, PAS body included ... 38
Figure 2.27: Design 4 vectorial airflow result, 3D view, PAS body included ... 39
Figure 2.28: PAS fifth (5-1) concept design bottom part.. ... : ... .40
Figure 2.29: PAS fifth (5-1) concept design bottom part 3D view ... .41
Figure 2.30: PAS fifth (5-1) concept design top part ... .42
Figure 2.31 :PAS fifth concept design bottom part 3D view ... .42
Figure 2.32: PAS fifth concept design parts positioning in 3D view ... .43
Figure 2.33 :PAS fifth (5-2) concept design bottom part.. ... 44
Figure 2.34: PAS fifth (5-1) concept design bottom part 3D view ... 44
Figure 2.35 :PAS fifth concept design parts positioning in 3D view ... .45
Figure 2.36: Volume Tetra angle non-structural mesh on design 5, side view ... 46
Figure 2.37 :Design 5 vectorial airflow result, side view, supports included ... 47
Figure 2.38: Design 5 vectorial airflow result, side view, gap included ... 47
Figure 2.39 : Design 5 vectorial airflow result, top view, results on Z plane ... .48
Figure 2.40: Design 5 vectorial airflow result, 3D view, PAS body included ... .48
Figure 2.41 :PAS sixth concept design bottom part.. ... 50
Figure 2.42 : PAS sixth concept design bottom part 3D view ... 51
Figure 2.43 : PAS six th concept design top part ... 52
Figure 2.44 : PAS ixth concept design top part 3D view ... 52
xi
Figure 2.46 : Volume Tetra angle non-structural mesh on design 6, side view ... 54
Figure 2.47 :Design 6 vectorial airflow result, si de view, supports included ... 55
Figure 2.48 :Design 6 vectorial airflow result, side view, gap included ... 55
Figure 2.49 : Design 6 vectorial airflow result, 3D side view ... 56
Figure 2.50 :Design 6 vectorial airflow result, top view, results on Z plane ... 56
Figure 2.51 : Design 6 vectorial airflow result, top view, results on Z plane ... 57
Figure 2.52 :Design 6 vectorial airflow result, 3D view, PAS body included ... 57
Figure 2.53 : Experimentally measured Drag coefficients for certain shapes ... 59
Figure 3.1 : Accepted PAS fabricated with 3D prin ting technology ... 67
Figure 3.2 : Natural Tubular Teflon ribbon used to mount the PAS on the birds ... 68
Figure 3.3: Polyurthane foam ... 69
Figure 3.4 : PDMS mould for forming the uncured PDMS ... 71
Figure 3.5 : Mounted PAS on a bird, using the Teflon ribbon in bird's colony ... 74
Figure 3.6: Mean total mass (ng) of,Ll5PBDE, HBB, and ,L3Dec ... 74
Figure 4.1 : Pitot, Static and Pitot-Static tube example ... 80
Figure 4.2 : Differentiai pressure sensor. (a) Different packages and tube direction . 82 Figure 4.3 : Temperature-hum id sensor ... 83
Figure 4.4 : Schematic diagram of sensors and controllers ... 84
Figure 4.5 : Designed and adapted PCB to be installed inside the PAS ... 87
Figure 4.6 : A complete electronic board including ali components ... 87
Figure 4.7: Modified PAS concept design top part 4 side view ... 88
Figure 4.8 : Modified PAS concept design third part 4 side view ... 89
Figure 4.9 : Electronic components 3D diagram ... 89
Figure 4.10: Modified PAS concept design middle part 4 side view ... 90
Figure 4.11 : Modified PAS parts installation sequence ... 90
Figure 4.12: Modified PAS complete pack 4 side view, electronic parts included ... 91
Figure 4.13 : Complete and final modified PAS cross sectional eut ... 92
Figure 4.14: CFD simulation on complete PAS, results on Y plan ... 93
xii
Figure 4.16: CFD simulation on modified PAS, results on Z plan ... 95
Figure 4.17: CFD simulation on modified PAS, results on Z plan top view ... 95
Figure 4.20: Modified accepted PAS for embedding the active sensors ... 96
Figure 4.21 :PASCO 850 Universal anemometer ... 97
Figure 4.22 : Considered setup for validation and calibration the PAS sensors ... 98
Figure 4.23 : PAS preliminary and calibrated output results compared ... 99
Figure 4.24 : PAS preliminary and calibrated output results compared ... 1 00 Figure 4.25 :Temperature comparison graph ... 1 01 Figure 4.26 :Relative humidity comparison graph ... } 01
LIST OF TABLES
Table 2.1 : Pattern 's drag force cal cu lation ... 60 Table 4.1 : List of main electronic components ... 96 Table 4.2 : Design 7 drag force calculation ... 96
RÉSUMÉ
La protection de la santé humaine et de l'environnement est une préoccupation majeure
depuis plusieurs années. Cependant, l'augmentation spectaculaire du nombre de produits chimiques nocifs rejetés par les industries ainsi que le nombre croissant de produits de consommation qui contiennent des composés chimiques entraine des défis importants. Parmi ces produits chimiques, on retrouve une grande quantité de
contaminants organiques halogénés qui sont constamment rejetés dans les
écosystèmes. Ces contaminants peuvent ensuite s'accumuler dans les espèces sauvages, comme les oiseaux. Toutefois, il existe d'importantes lacunes dans les connaissances sur les sources alimentaires et non alimentaires de ces contaminants et c'est le cas en particulier pour certaines substances chimiques pour lesquelles aucune règlementation internationale n'existe. Par conséquent, une étude sur les sources atmosphériques de retardateurs de flamme halogénés (y compris les éthers diphényliques polybromés (PBDE)) est nécessaire. Afin de réaliser cette étude, deux échantillonneurs miniaturisés pouvant être portés par des oiseaux ont été développés pour la première foisll s'agit d'un échantillonneur d'air passif (PAS) ou uniquement un filtre est utilisé comme capteur et d'un deuxième ou des capteurs électroniques sont intégrés. Différentes architectures ont été conçues en utilisant des simulations de mécanique des fluides numériques (CFD) afin d'évaluer le flux d'air à l'intérieur et à l'extérieur du PAS et la façon dont la surface des absorbants sont exposées à 1' air qui y circule. Le dispositif a été fabriqué en utilisant une imprimante 3D et peut être équipé de différent absorbant. Il a par la suite été monté sur des goélands afin de retracer les sources de retardateurs de flammes dans la région de Montréal. Finalement, le dispositif retenu a été muni d'un capteur commercial afin d'obtenir des données complémentaires pour de meilleures analyses d'absorbant. Ce projet fait partie d'un projet global en collaboration entre des
xvi
MOTS-CLÉS :Échantillonneur d'air passif, Échantillonneur d'air actif, PAS, Adsorber, Simulation CFD, Retardateur de flamme, PBDE, Impression 3D.
ABSTRACT
Protection ofhuman health and the environment has been one major concern in recent years, however, the dramatic increase in the number of noxious chemicals produced by industries causes an important challenge. Among these chemicals, there is a group of organic contaminants, flame retardants, which are discharged into the wildlife environment and could become concentrated inside the bodie of different species in different ways. However, there is a lack of knowledge related to the dietary and non-dietary sources ofthese contaminants, especially for the type of chemicals for which is no international restriction. Therefore, an investigation on the atmospheric sources of flame retardants, both gas and particle phase (including Polybrominated diphenyl ethers (PBDEs)), can help us to have a better understanding about their effects on ecosystems. In order to address this investigation, for the ftrst ti me, a miniaturized bird-borne passive air sampler was developed. This project was a part of a global project undertaken in a collaboration between research groups from computer science and biology departments ofUQAM. In order to optimize the sampler, severa! patterns were designed and studied as a point of airflow, inside and outside the geometries, using computational fluid dynamic (CFD) simulation. Then, our colleagues from biology were responsible to select the most appropriate design based on their requirements. The design was fabricated using 3D printing technology, equipped with different kinds of sampling media and mount on a ring-billed gulls in order to track the sources offlame retardants in Montreal area. Finally, the approved passive air sampler was modified to be equipped with some commercial sensors in order to have complementary data for better adsorbents analysis.
KEYWORDS : Passive air sampler, Active air sampler. PAS, Adsorber, CFD simulation, Flame retardant, PBDE, 3D printing.
CHAPTER 1
INTRODUCTION
1.1 Project description
This thesis project is part of a more global project which is realized through a collaboration between research groups in microelectronics engineering and biology. The global project has the title: "Combining High-Resolution Biotelemetry and Passive Air Sam pl ing Techniques: A Novel Approach to Understand the Intra-Specific Variations in Emerging Contaminant Exposure in Birds" and concerns about the source of the pollution in environment and their effect on ecosystems. Severa) endangered species live close to the water sources where different sources of contaminants can be founded. Among those sources of contamination, a group of organic contaminants that can bioaccumulate in some species such as birds, are continuously releasing into ecosystems. Among ali those pollution, the flame retardant compounds, including the polybrominated diphenyl ethers (PBDEs), are a group ofchemicals that massively used in industries. These chemicals are added to different kinds ofproducts such as furniture, electronic components and boards, isolators to reduce the fire hazards (Figure 1.1).
2
Figure 1.1 : Flame and non-flame retardant pa pers testing against fire Retrieved from: http://www.rutlandplastics.co.uk/advice/plastics_additives_fr.html
A research study administered by a group (Canada Research Chair in Comparative A vian Toxicology) from the biology department of UQAM University, reported high accumulation of PB DEs and a series of other types of flame retardant compounds in tissues ofbirds living around Montreal. They proposed that the dietary of a ki nd ofbird (ring-bi lied gu lis) could be a reason that they expose to these types of chemicals besides the atmospheric pollution. As an omnivore species (Figure 1.2), these birds can be studied for environmental contamination related to dietary, in Montreal area. This can be accomplished by using these birds to fi nd the source of these Contaminants using an air sampling deviee mounted on them. Air sampling consists in capturing the contaminant from a volume of air, measuring the amou nt of captured contaminants and reporting the results as a concentration. In order to do so, the air is passed through a sampling medium (could be a variety type of absorbers) which captures the pollutants. Then, the amount ofpollutants captured in the sampling media is measured by various
3
analytical techniques. Finally, the volume ofsampled air is reported against the amount of pollution captured and this gives the concentration, which is expressed as milligrams per cu bic meter (mg/m3) or part per million (ppm). This process can be done by passive or active air sampling. Detailed information about this technique and related instruments will be provided in the following.
Figure 1.2 : Birds flying around land lill and searching for food Retrieved from: http://www.gettyimages.ca
1.2 Passive and active air samplers
There are two principal means of monitoring the pollution of the air, passive sampling and active sampling. ln the following section we will present various techniques and systems that have been reported for active and passive air sampling.
4
1.2.1 Passive air samplers
A passive air sampler (PAS) is a very simple deviee that does not need any pump and electrical parts. Generally, a passive air sampler consists of a housing and internai structure to hold different types of absorbers. The housing can be designed in different shapes and it will protect the internai parts of rain or direct sun light exposure. It also helps the intake air to have better circulation inside the housing in order to have maximum exposure to the absorbers. Depending on PAS applications, different types of internai structures can be designed to use different types of absorbers. This type of sampler can be installed wherever that air sampling is needed such as: offices, rooms, parking or outdoor places. In order to have enough sampling air Influence on the absorbers, the PAS can be maintained in a place from severa! days to severa! weeks. The time of sampling, depends on absorbers saturation time and application requirements. There are different types of design for PASs. One of the most reported one is made from two different sizes half spherical stainless steel housing (Figure 1.3) and installed in a way that they could cover the inside sampling media (Abdallah et Harrad, 201 0). The two housing parts are fixed on top of each other using a central long screw. The sampling media or any further mechanical parts can be installed inside the PAS by using this central long screw. Based on this design, the sampling air can enter the PAS through the existing gap between top and bottom housing parts. After lnfluencing through the sampling media or absorbers, the sampled air can come out from the embedded ho les at the bottom of the smaller housing part. Other roles ofthese two housings parts are: to protect the inside media from direct deposition of particulates, to reduce the effect of the fluid flow velocity (Hazrati et Harrad, 2007) and to protect the inside samplers from direct exposure to sun light for some applications where light protection is important.
Depending on the type of pollution that need to be studied, different kinds of absorbers can be used inside the PAS. As an example, the polyurethane foam (PUF) filters are
5
known to capture compounds in the vapor phase (Abdallah et Harrad, 2010) and glass fiber filters (GFF) are known to sample the particulate phases (Abdallah et Harrad, 2010) (Figure 1.4). Other types of materials such as Polydimethylsiloxane (PDMS) (Park et al., 2014) or Graphene oxide (GO) can a Iso be used as an absorber to check their functionality. In this PAS configuration, different kinds of absorbers can be used atone or coup led together (Abdallah et Harrad, 201 0). This can be do ne by using the long central screw to mount various absorbers. The usage of the long central screw also brings the advantage ofbeing able to do distance modification among the various PAS consisting of parts and installing the complete PAS for inside or outside usages (Figure 1.5).
ait· cit·culation PUF disk
FigUJ·e 1.3 : A usual passive air sampler schematic with one sample medium inside Rctrieved from: http://www.monairnct.eu/indcx-cn.php?pg=mcthods--passivc-air-sampling
6 PUF disk 14 cm
....
.
.
.
23 cm 18 cm GFF, 1um, 12.5 cm diameter Supporting perforated diskFigure 1.4: A usual passive air sampler schematic with two sample mediums inside (Abdallah et Harrad, 2010)
Figure 1.5 : A real passive air sampler during sampling process
7
In another study which was focused on two industrial sites (alloy industry and coke plant) the PAS was embedded in the worker's helmet (Bohlin et al., 2010) (Figure 1.6). In fact workers' helmets was modified in a way that it acts as a PAS. A small piece of PUF was deployed into their helmet and the workers carried them during working hours. The PUFs were exposed to the air and when they became saturated they were analyzed for extracting results.
FigUJ·e 1.6 : A helmct used as a passive air sampler with an inside sampling medium (Bohlin et
al., 2010)
In another study a different type of PAS cal led "flow through sampler" was presented (Xiao et al., 2007) (Figure 1.7). This different PAS was modified and adapted to highly increase the sampling rate of air without using a pump (Xiao et al., 2007) or any electrical deviee. This PAS consists of a horizontal tube that can force the air to blow through the absorbers and a vertical fin part (acts like aircraft rudder) that allow the PASto turn into the wind direction. In this way more air can blow though the sampling media and this will decrease the ti me of saturation of the media. This type of PAS is more suitable for applications with limited study ti me.
8 VortexWind Seneor ~---50 cm---~----~
r
or~~:.,=-1
10cm ... annular bypaaa . . lntake alrflow ·-~-·-Figure 1.7 : Flow-through sampler (Xiao et al., 2007)
The conventional type of PAS can be installed everywhere (in places su ch as offices, schools, cars, roofs, land fields, etc.), however, the PUFs can be exposed with different air velocity and this can affect PUFs sampling rate (Tuduri et al., 2006). A study with the title of"wind effect on sampling rate" (Tuduri et al., 2006) reports th at by exposing PUFs to PCB contaminated environment (PCB: polychlorinated biphenyl) in a wind
9
tunnel with a variety wind velocity, absorber sampling rate was increased inchmeal and after reaching a certain speed it increased sharply white the design of the housings could damp the wind effect (Tuduri et al., 2006). In this case calculating the wind speed around the PAS can helps to validate the
PUFs
analysis results.ln addition, understanding of air circulation, air velocity inside and outside a PAS and the way that sampling air expose to the PUF disks, could help better comprehension of the PAS's entire system functionality for better PAS design and better positioning of different types of absorbers (Tuduri et al., 2006). Also, two other studies present the computational fluid dynamic (CFD) simulation on PUF disk and typical PASto mode! the air circulation and velocity around and inside the PAS. Based on those CFD simulations, they proved that the uptake rate of absorbers are dependent on external wind speed. Also, varying the boundary conditions around the PUF disk will result in varying relations between absorbed pollution and wind speed (Thomas et al., 2006). Moreover, CFD simulation confirms the lntegrity of previous reports about increasing in sample rate due to the increase of the wind velocity. They also show that the increase in the sample rate also depends on ambient wind angle (May et al., 2011). Finally, the reported results, showing the advantage of proceeding to CFD simulation before building a new design.
1.2.2 Active air samplers
One of the most common active air samplers is shown on figure 1.8. This system uses a suction pump or fan to draw air to be sampled into a container. This container is equipped with different kinds of filters and absorbers, which depend on the active air sampler functionality. As it is clear from this description, this deviee consists of electrical and mechanical parts and they need enough power to work.
10
Figure 1.8 : An active air sampler
Retrieved from: http://www.biosci-intl.com/products/sas_l00_180.htm
Sorne studies were focused on a specifie gas using active air sensors. Based on the targeted gas characteristics, a type of material or combination of severa! layers of
different materials can be used to detect the specifie kind of gas molecules. These
materials change their electrical characteristics (resistivity, capacity, conductivity, etc.) when they enter in contact with those kinds of gas molecules and by measuring the
variation ofthese characteristics the target gas can be detected.
Active gas samplers could also be built using microfluidic techniques. By using
microfluidic deviees, it is possible to have severa! inlets and each inlet can be designed
for a special material such as water, air, gases, etc. From this point many new techniques can be used for gas detection. For example, it can be used to fabricate
"bubble-based gas sensor" (Bulbul et al., 2014) which mixes the liquid entering one channel with the gas entering from another channel in order to create small bubbles,
11
and using customized software the type of the entered gas can be detected. In another study, a "microfluidic gas centrifuge" was presented. It uses the gas molecular weight to separate a mixture of gases (Li et al., 2007).
Generally, in microfluidic deviees, a pump is required to inject the liquids or gases inside the fluidic channels. In those cases, a small micro pump can be integrated into the deviee in order to move the gas inside the channels (Martini et al., 2012). In this study, thermal variation was used to serve as the pumping system along the micro channels in order to guide the gas into the channels (Martini et al., 20 12).
Additionally, the fluidic channels can be used to guide the intended gas into the main chamber which is fabricated on top of a CMOS readout chip (Mu et al., 2012; Ward et al., 2012). The chip cou Id include an accrete chemiresistor (CR) array which is designed to am pl ify and condition the detected signal. The combination of CR arrays, CMOS chip and microfluidic techniques could be used to build a micro gas chromatograph (Mu et al., 2012; Ward et al., 2012).
1.3 Problematic and objectives
Ali the presented sam piers are too big compared with the medium size of a bird and it is not possible that they be mounted and carried by birds. We then need to modify the samplers design in order to adapt them to the birds.
As it is clear from previous sections, the active air sampler requires severa( electrical-mechanical parts and it is not suitable for our application. On the other hand, passive air sampling has severa( advantages compared with active air sampler. It is a low-cost technique which does not need any electrical parts. In this case, for this study a passive air sampler (PAS) can be a promising deviee to capture the halogenated flame retardants compounds.
12
This deviee will be used to passively capture PBDEs compounds and other types of flame retardants existing in air in both the vapor and particulate phases during the period of time (one, two and three weeks). The designs will be based on existing passive air sampler which is weil described by Abdallah and Harrad (May et al., 2011).
After fabricating and testing PAS deviee, it will be interesting to evaluate the possibility ofimplementing some electronics sensors in it, in order to collect more complementary data when it is under testing.
Since this project has been done in collaboration with the biology department, the first step to launch this project is to design the appropriate PAS. In this case the following objectives have been set in order to fulfill ail explanations above:
1- Miniaturize and validate a passive air sampler (PAS) that can be transported by a medium-size bird and trap both particle- and gas-phase halogenated flame retardant contaminants.
2- Design and fabricate a low power consumption electronic circuit that can operate during the passive air sampling period while it is embedded inside a
modified PAS in order to provide some complementary data for better adsorbents analyses.
13
1.6 Methodology
ln arder to build a deviee with the small size and weight needed for this application,
available practical microfabrication techniques will be evaluated and the most suitable one will be chosen by the final user (collaborators in the biology department) based on the bird's limitations.
The sampling housing can be fabricated by using the soft lithography technique. in this technique, first a mould could be made using the photo resist materials; then, by casting the polydimethylsiloxane (PDMS) on the mould, the main chamber and related channels will be formed and after cu ring process it can be peeled off from the mould for more manipulation (Qin et al., 2010). PDMS physical characteristics make it appropriate for this type of application (harsh weather environment) due to its resistant against thermal and physical shocks. Alternatively, the PAS chamber can be fabricated using 3D printing technology. Recently the 3D printing technology has seen massive development and the new printers can print walls as narrow as 0.5 mm and layers as thin as 50 micrometers. The size and design of the chamber can easily be modified and scaled by using both techniques. Before fabrication, different concept patterns will be designed and simulated to study the fluid flow circulation inside and outside the PAS and achieve the best fluid flow control. The concept designs will be done in a way that it could be equipped with different kinds ofabsorbers. This new deviee can be used for different toxicology and pollution monitoring application. It will be designed in a way that it could be carried by the medium size bird for passive air sampling monitoring. ln future it can be equipped with some sensors, specially designed for specifie compounds. This will change the role of this deviee from passive air sampler to active air sampler which can also send online reports or data to the laboratory.
14
ln this case, 3D design software (design Spark mechanical and Catia) were used in
order to design concept patterns. Then the computational fluid dynamic (CFD) test can
be done on designed patterns by using ANSYS FLUENT 15 to study the effects of the fluid flow (in our case it is air) on it. The pattern and its related results will be provided to the biology department in order to know if there are any weaknesses or critical problems on the design. In the event of any problem, the pattern will be modified or a
new pattern will be provided. This procedure will be repeated until a pattern that covers ali project requirements be achieved and it be approved by the biology department. The approved PAS will be fabricated by 3D printer in order to be mounted on the bird for
the first year of the stud y.
Following the first design, in order to equip the PAS with sorne sensors, the PAS would be redesigned and modified in a way that it respects the previous design while it could
carry electronic circuits including sensors. The new design will be fabricated and equipped with electronic circuits and adsorbents in order to be tested in fi led.
For the active part of the PAS, sensors and processors should be as small as possible
and also they should be selected from the ultra-low power category. The printed circuit board (PCB) and its related schematic will be designed by circuit maker software (from Altium design Co.), then it will be fabricated using PCB fabrication machine (LPKF
machine-LPKF Laser & electronics AG).
1.5 Thesis presentation
Based on the table of contents, in chapter 2, ali the concept designs will be presented including their CFD simulation results. Also, patterns' actual size, their 3D and line-dote design will be presented as separated and assembled views and finally the PAS
comparison and selection process will be presented which is based on CFD simulation
15
At the beginning of chapter 3, the PAS fabrication process, results and ali the necessary
condition that should be respected for fabrication, will be presented. Following this,
different types of adsorbents that were used and can be used with miniaturized PAS
will be introduced and following that the biological results ofthe PAS will be presented
including an image from filed work which shows a real 3D printed PAS mounted on a
bird and ready to release for tests.
In chapter 4, sensors that can be applied to the miniaturized PAS and the way that they can provide some complementary data will be presented. Then the accepted PAS will
be modified in a way that ail new components including sensors, printed circuit boards
and controllers are equipped inside the PAS. New simulation will be done on the new
design in arder to check PAS's functionality white the new active sensors are
embedded inside the PAS. In the following, the results of the active sensors will be
shawn and their comparison-validation with a pre-calibrated anemometer. Finally, in
CHAPTERII
PASSIVE AIR SAMPLER CONCEPT DESIGNS AND SIMULATIONS
Since this was the first time that a miniaturized PAS was designed and adapted to be installed on birds, severa! miniaturized PAS concept designs were made using DesignSpark Mechanical software (3D design software - Free Licence) and Catia (Dassault Systemes- Academie version at école de technologie supérieure (ETS)). On those designs we tried to consider severa( factors that could influence the performance of the PAS and also birds flying abilities. These factors which can also be considered as project limitations are: PAS aerodynamic shape, size and thickness (must be Jess than 45x35x20 mm), weight (must be less than 3% ofthe bird's total weight), PAS air inlet position and finally, the most effective way that the entered air can expose the sampling media. In this case, the idea of each design is based on the mentioned requirements which were provided by our collaborators from the biology department. For example, sorne designs would have the maximum sampling media active surface area, some would be more aerodynamic and some other could have direct air exposure. The computational fluid dynamic (CFD) simulation was done on designed patterns using ANS YS Fluent simulation software in order to understand how the designed PAS will behave before fabrication. Each design and its simulation results was proposed to our colleagues in the biology department in order to know the advantages and disadvantages of the design and getting suggestions to improving the design. At the end, the most appropriate design, the one who meets ali project requirements, as suggested by the group of the biol ogy department was fabricated and prepared to be tested on birds.
18
For CFD simulations, the 3D design file was exported as STereoLithography (STL) file and imported to the ANSYS software. In order to have the same simulating condition for ali patterns, same settings were used during ail simulation as following: Area definition:
In order to make a CFD simulation on an object, this object should be defined in an
area which is a 3 dimensional space. The area definition tool allows us to define this space by drawing some surfaces called walls. These walls would be a part of CFD
simulation which means that the simulation software will calculate the fluid flow effects on these walls which are not desired. In order to eliminate the effects of the walls on the main objects, this area should be defined as large as possible. In CFD simulations, usually, each area dimension is considered as fifteen times bigger than related dimensions on target object.
Objects material:
In CFD simulations, ali the designed objects (walls, main objects, fluids) should be assigned to a type of material which exists in software library. These materials can be fluids (air or chemical gazes), flexible (plastics, polymers, etc.) or rigid and no
n-flexible materials (such as aluminum). Since the final prototype of PAS will be fabricated from a hard plastic which is not flexible, it was defined as sol id-non-flexible
material in the simulation software. The flow material was defined as air with 15 m/s velocity since air will be used for normal sampling. The 15 m/s air velocity was defined based on the bird's maximum speed in order to study the PAS behaviour in the worst condition.
Meshing:
This step is the most important part of the simulation setting procedure since ali CFD equations will be calculated based on the designated mesh. ln the first step of the mesh
generation, a 2D mesh will be generated on ali surfaces. The size of the meshes that set in this step will affect the number of iterations during simulation. lt was tried to keep
19
the same size for ail designs in order to have the same simulation conditions. Then,
these 20 mesh should be converted to 30 mesh which is called volume mesh. In our case, tetra angel non-structural mesh was defined as volume mesh type because of its
easiness generation with a 1.2 exponential ratio. This ratio is related to mesh growing.
This means that on important surfaces where high accuracy is needed, the mesh size
will be as its default value (which will be determined by the user) and as saon as the
meshes starts to draw farther from the important surfaces, they grow by designated
ratio. This increase of the mesh size for certain areas will reduce simulation time.
Since the tluid tlowing on the PAS surfaces is the most important parameter of the
simulation, the prism mesh was defined only on abject surfaces. In this case the mesh
was defined as structural mesh with 1.2 exponential ratio since it gives more accurate
results compared with the tetra angle mesh.
Boundary condition:
The objective of these settings is to simulate the environmental conditions that will affect the PAS during real testing. Since the PAS will be tested during summer while
it is mounted on a bird, the air velocity is defined as 15 m/s. This speed is estimated to be equal to the bird's maximum speed. The temperature was defined as 25
o
c
andpressure was defined as being same as air pressure at sea leve!.
In what follows, various designs will be presented based on different ideas. CFO simulation will be done on each design in arder to study the tluid flow and also
calculating the drag force energy. These drag values will then use for PAS comparison and selection procedures. There will be a discussion about PAS selection and the way
20
2.1 Design 1
2.1.1 Pattern 1
The first pattern is based on birds forward flying direction. ln this design it was considered that having one wide air inlet can help to intake more air into the PAS and
this can be increased when the bird is flying. In this case, the PAS is designed with walls as thin as 5 mm. One in let and one outlet are considered with a size of23 x 3 mm for both of them (Figure 2.1). The deviee whole size is 27 x 27 x 5 mm.
a
b
r- - - -27mm- - - - ---l ·- - - - , - - - -23mm - - - ---1 27mm ..., 3mm 3mm,
-1 3mm~r·---rtJ
- ,....--...__l
~3 Sampling media place
i
Nt
l/1 3 3 -1-c
Figure 2.1 : PAS first concept design. (a) Front view with only one wide channel as the in let andoutlet. (b) Side view with two pressure-IJreali holes, bef01·e and after the sampling media. (c) Bottom view, the sampling media is placed in the middle of the PAS and can be exposed with air
in 2 di•·ections
Two exit holes are considered for this design. They are situated on each side of the PAS in order to reduce the air pressure applied to the sampling media when the bird is flying
21
The sampling media is positioned right in the middle of the PAS. This media has a width of 2 mm and there is a 25 mm length where the air can directly expose the sampling media (Figure 2.1 c, 2.2 a).
Figure 2.2 :3D view of design 1. (a) 3D bottom view. (b) Top view
2.1.2 Design 1 simulation
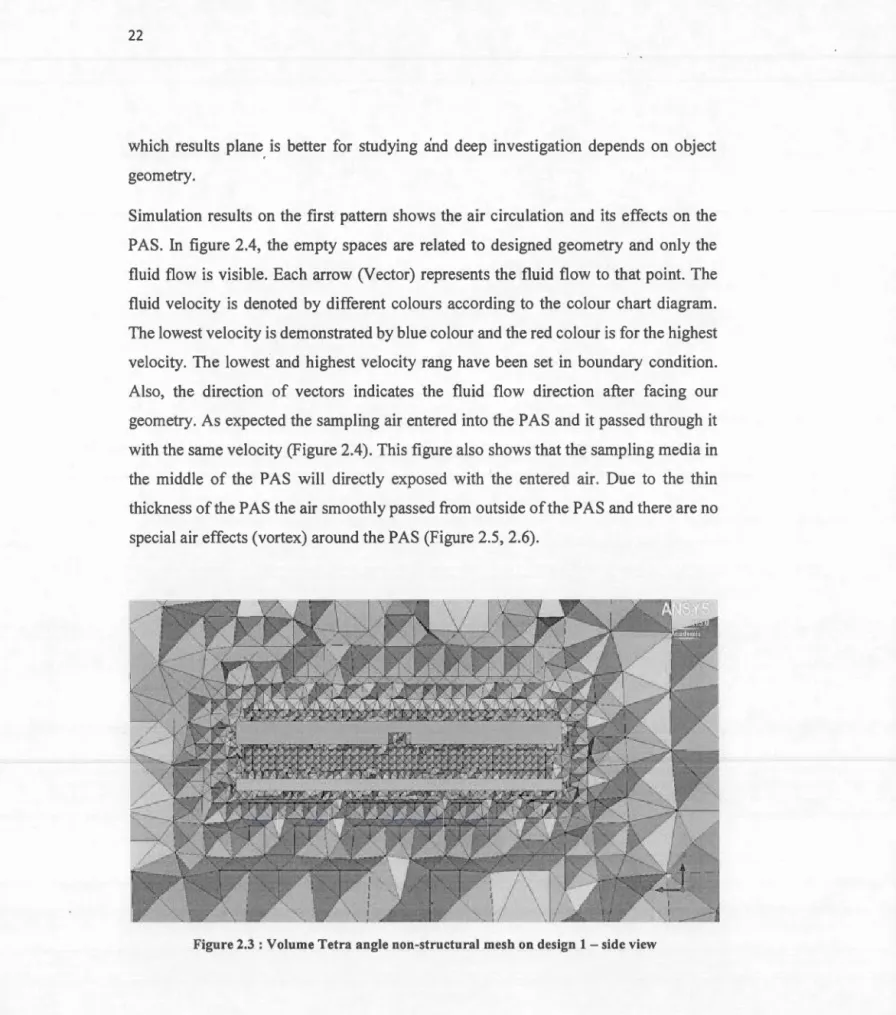
Simulation of the first design pattern was done from its generated mesh (Figure 2.3). CFD simulation will be done on each one of the tetra angels meshed (obvious as green three angles) and this means that the fluid will flow inside these green areas. The rest empty parts are the PAS' s body and the re is no fluid th at flows inside them as it can be seen on simulation results provided by ANSYS. When the simulation is done, a velocity vector will be provided instead of each tetra angel mesh. Each velocity vector would have direction which depends on object geometry. The results are provided as 3D views but, they should be shown on a plane for better analysis. There might be severa! different fluid velocity vector shown in each result output. These velocities are indicated as a legend on the right side of the output result with different co tours, so it would be easy to find the fluid velocity in ali parts of the design. These procedures are fixed for ali designs and the only thing that might be different is results plane. Choosing
22
which results plane. is better for studying and deep investigation depends on abject geometry.
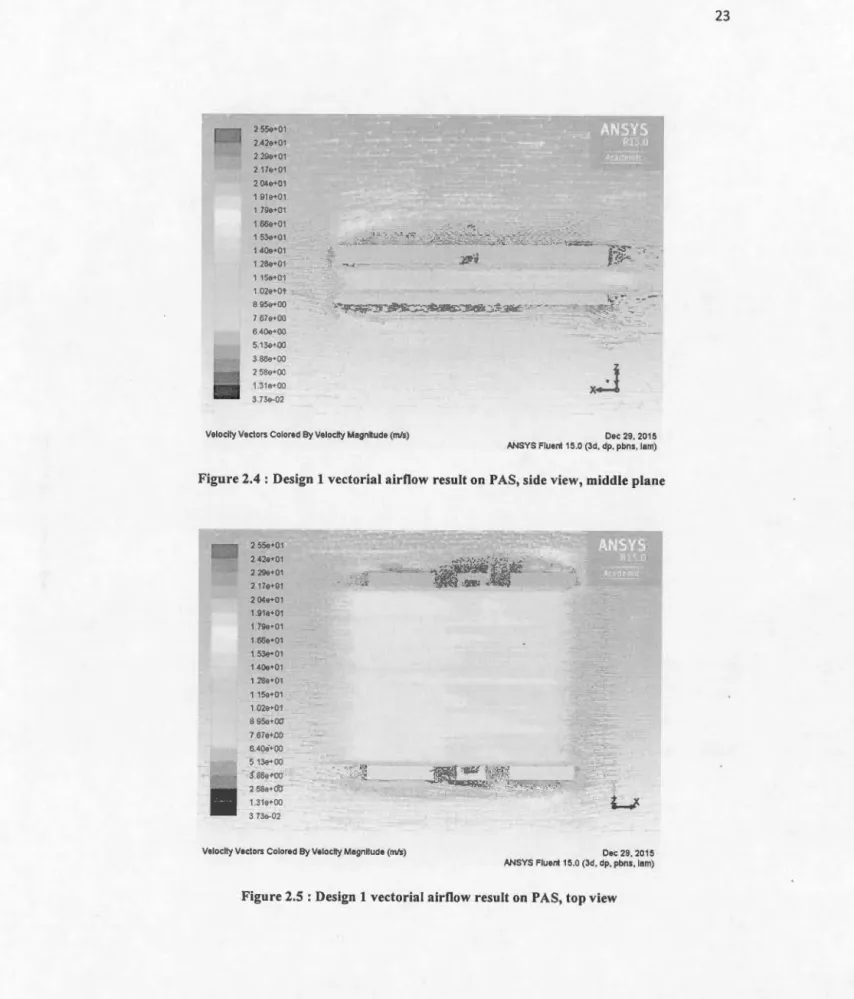
Simulation results on the first pattern shows the air circulation and its effects on the PAS. In figure 2.4, the empty spaces are related to designed geometry and only the fluid flow is visible. Each arrow (Vector) represents the fluid flow to that point. The fluid velocity is denoted by different colours according to the colour chart diagram. The lowest velocity is demonstrated by blue colour and the red colour is for the highest velocity. The lowest and highest velocity rang have been set in boundary condition. Also, the direction of vectors indicates the fluid flow direction after facing our geometry. As expected the sampling air entered into the PAS and it passed through it with the same velocity (Figure 2.4). This figure also shows that the sampling media in the middle of the PA will directly expo ed with the entered air. Due to the thin thickness of the PAS the air smoothly passed from outside ofthe PAS and there are no special air effects (vortex) around the PAS (Figure 2.5, 2.6).
2 5Se•01 2 42e+01 2 29e+01 2 17e•01 2 04e•01 1 91e•01 1 79&+01 1 66e•01 1 53e•01 1 40e+01 1 28e•01 ·'\ 1 15&+01 1 02e•01 8 95e•OO 7 67e•OO 640e+OO 5.13e•OO 3 86e•OO 2 58o+OO 1.31e•OO 3 73e-02
Veloclty Vectors Cotored By Veloclty Magnitude (m/s) Dec 29. 2015 ANSYS Fluent 15.0 (3d. dp, pbns, lam)
Figure 2.4 Design 1 vectorial airflow result on PAS, side view, middle plane
2 42e•01 2 29e+01 2 17e•01 2 04e•01 1 91e•OI 1.79e•01 1 66e•01 1 53e•01 1 40e+O 1 1 18e•01 1 1<ie•01 1 02e•01 8 95e+OO 7 67e+OO 6 40ei-QQ 5 '13e•OO 3 86e•oo 2 SSe•OO 1 31e+OO 3 73e-02
Veloclty Vectors Colored By Velo elly Magnitude (mis) Dec 29, 2015 ANSYS Fluenl15.0 (3d, dp, pbns. lam)
Figure 2.5 : Design 1 vectorial airflow result on PAS, top view
24 2 55e•OI 2.<2e+01 2 29e+01 2 17e+01 2 04e•OI 1 91e•01 1 79e•OI 1 66e•01 1 53e•OI 1 40e•01 1 28e+OI 115e+01 1 02e•01 8 95e+OO 7 67e•W 6 40e+OO 513e•W 3 86e•OO 2 58e+OO 1 31e+OO 3 13e-02
Ve\ocl\y Veel ors Colored By Veloclty Magnitude (mis) Dec 29. 2015 ANSYS Fluenl15.0 (3d. dp. pbns.lam)
Figure 2.6: Design lvectorial airflow result, top view, PAS body included
2.2 Design 2
2.2.1 Pattern 2
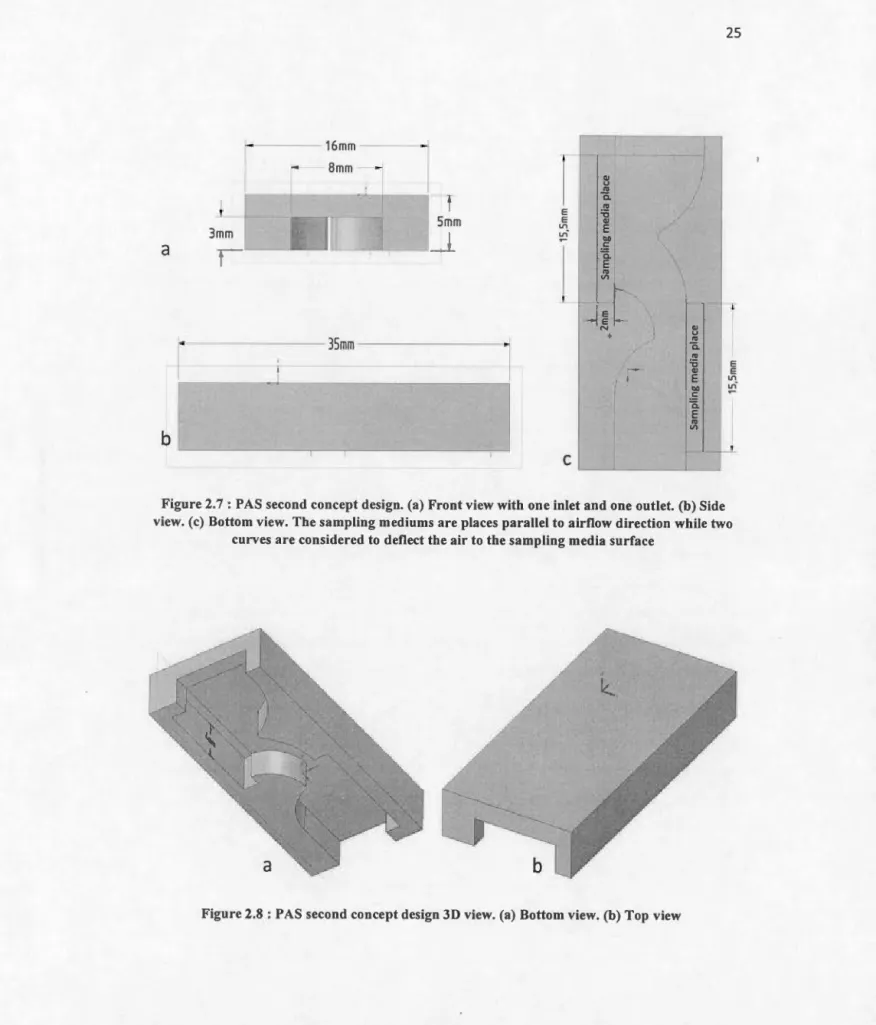
The second design (Figure 2.7) is similar to the first one except that it is narrower and
also the inside design is changed in order to improve the aerodynamic shape of the
design and prevent sampling media deformation from direct air exposure. The total size of the pattern is 35 x 16 x 5 mm, there is one inlet and one outlet for sampling air (8 x
3 mm) (Figure 2.7 a) and two sampling media can be placed inside the PAS with a 15.5
a
b
3mm 16mm Bmmt
Smm 1 - '-' •,., _ _ _ _ _ _ • - -35mm - - - ---ll
~----~--~---~---~ E E V) .,·c
25..
u "' ëi "' 'ë..
1
1
Vl~
Nê
..
•
u "' ëi "' 'ë..
E E E "' 'ao"'
.
.!: ëi E "' VlFigure 2.7: PAS second concept design. (a) Front view with one inlet and one outlet. (b) Side view. (c) Bottom view. The sampling mediums are places parallel to airflow direction white two
curves are considered to deflect the air to the sampling media surface
26
The sampling mediums are positioned in the same direction as the wind flow. In this case, strong wind cannot deform them or bring them out when the bird is flying (Figure 2.7). In order to maxim ize air exposure to the media, the inlet channel is made narrower in the middle of the chamber using a smooth curve. These curves should have two effects. First, it tight the air exit channel and this should increase air velocity due to the larger entry (means more volume of air) and narrower exit which makes the air flow strong enough to impact to the second media. Secondly, this curve should distract the
'
entered air to the first media in a way that it has the maximum impact to the sampling media surface (Figure 2.7, 2.8).
2.2.2 Design 2 simulation
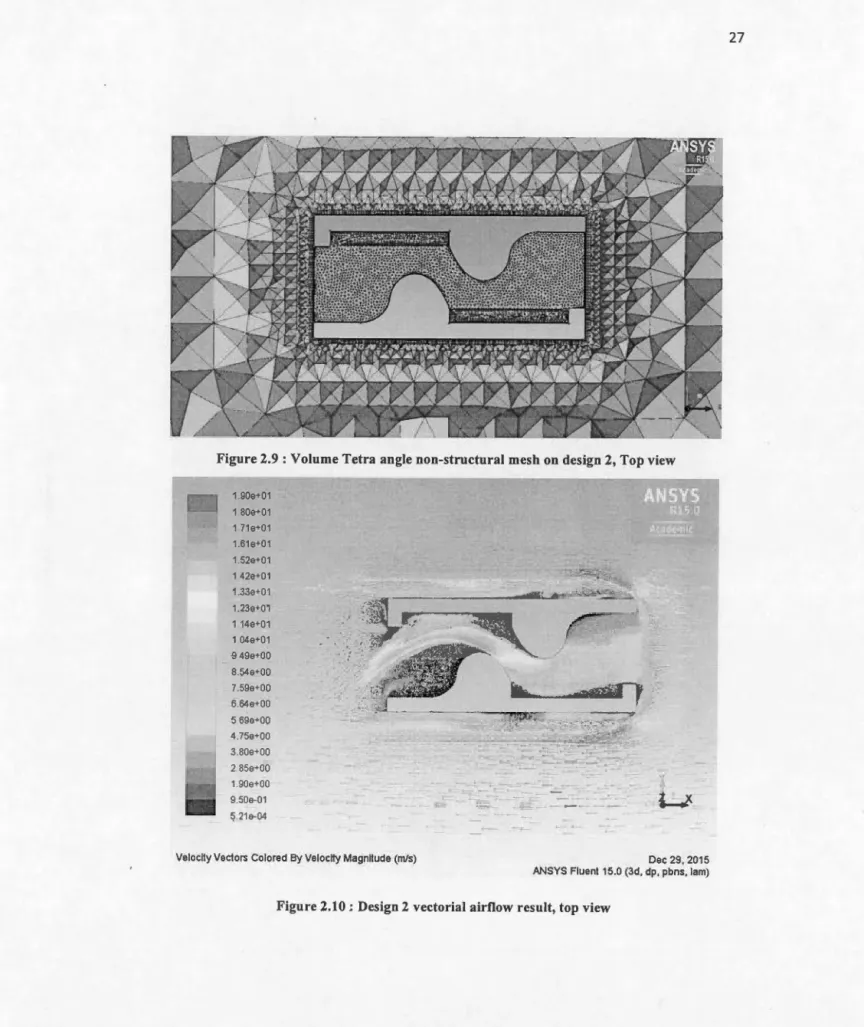
CFD simulation of pattern 2, clearly shows the air circulation inside the PAS and its exposure to sampling media. lt shows the reduction of the 15 m/s air velocity to approximately 4.5 m/s. The first sampling media is exposed by entering air which has the velocity of around 4.5 to 5 m/s (one third of the maximum speed). Then, the narrowed air path (due to the two implemented curve) accelerates the sampling air velocity to approximately 15 m/s (same as the outside wind speed). At this point, the sampling air velocity is high enough to expose to the second media and from there it can easily exit from the PAS (Figure 2.1 0).
Also, the 3D and overall views of simulation including the PAS body show that there is no special air vortex on the PAS outside body and the air smoothly passes through the PAS (Figure 2.11, 2.12).
Figure 2.9: Volume Tetra angle non-structural mesh on design 2, Top view 1 90e+01 1 80e+01 1 71e+01 1 61e+01 1.52e+01 1 42e+01 1 33e+O'I 1 23e+01 1 14e+01 1 04e+01 9 49e+OO 8.54e•OO 7 .59e+OO 6.64e+OO 5 69e+OO 4 75e•OO 3.80e•OO 2 85e•OO 1 90e+OO 9 50e-01 5.21e-04
Velocily Vectors Colored By Velocity Magnitude (m/s)
r
Dec 29, 2015 ANSYS Fluent 15.0 (3d. dp, pbns, lam)
Figure 2.10 .: Design 2 vectorial airflow result, top view
28 1.90e•01 1 80e•01 1 71e+01 1 61e•0·1 1 52e•01 1 42e•01 1 33e•01 1 23e+01 1 14e•01 1 04e•01 9 49e+OO 8.54e+OO 7 59e•OO 6 64e•OO 5 69e•OO 4 75e•OO 3.80e•OO 2.85e+OO 1 90e•OO 9 SOe-01 5 21e-04
Velocily Veclors Colored By Velocily Magnilude (mis)
z
x
Dec 29, 2015
ANSYS Fluenl 15.0 (3d, dp, pbns, lam)
Figure 2.11 :Design 2 vectorial airflow result, 3D side view, PAS body included 1 90e•01 1 80e•01 ·1 71e+01 1 61e+01 1 52e•01 1 42e•01 1.33e•01 1 23e+O 1 1 14e•01 104e•01 "*.;4 :ot•. 9 49e•OO ~: 8.54e•OO 7 59e+OO 6 64e•OO 5 69e+OO 4 75e•OO 3 80e+OO 2 85e•OO 190e•OO 9 SOe-01 5.21e-04
Veloclty Vectors Colored By Velocity Magnitude (m/s) Dec 29.2015
ANSYS Fluent 15.0 (3d. dp, pbns.lam)
29
2.3 Design 3
2.3.1 Pattern 3
As it was presented above, the first two patterns were designed with only one in let and one outlet. This means that the sampling air can only enter from one direction and their maximum efficiency is during bird flying time.
ln the third pattern design, it was tried to have more in lets and outlets from ali sides of the PAS. ln this case the sampling process would not dependent on birds flying direction and sampling air could enter into the PAS from ali direction (Figure 2.13). For this design, four hales were placed on top of the PAS in arder to hold four sampling media with circular shape, 2 mm thickness and 4.5 mm diameter (Figure 2.13). In this case, the active surface area would be of 3.5 x 2 mm.
To address these modifications, the PAS shape was changed to cube with dimensions of28 x 28 x 5 mm. Two inlet-outlet channels were introduced on each side ofthe PAS. Each one can act as an inlet or outlet depending on wind direction. Each inlet is connected to another inlet which is placed on the right side of the first inlet. The combination of these two in lets makes a channel with one in let and one outlet with 90 degree angle between them. ln this way, the channel can be used in two directions (Figure 2.14).
30
c
- .-28mm 3,5mmb ~======--Ï
1~
B
m
~
m
--~~~~1
~
----~
~---28mm---~l
9mm- - , 2,5mmFigure 2.13: PAS third concept design. (a) Bottom view. (b) Top view. (c) Front view (which is sa me for ali sides as it was designed symmetrically)
31
2.3.2 Design 3 simulation
Airflow simulations on design 3 shows the effects of the entering sampling air on the two front hales. As it is shawn on the figures 2.16 and 2.17, the air directly enter into the channels and due to the 90-degree tu rn, seme of it direct( y exit passing through the sampling media ho le due to the reflected flow and the rest come out through the channel (Figure 2.16, 2.17).
Moreover, simulation results show that a part of the sampling air that was come out through the channel and sampling media hole, enter into two back hales which was not expected during pattern design. This means that even with one direction airflow ali sampling media will be exposed to the air to be sampled (Figure 2.17, 2.18).
32 1 94&+01 1.84e•01 1 75e+01 1 65e•01 1 55e•01 1.46a•01 1 36e+01 1 26a•01 1 16e•01 1 07e+01 .. 9 ?Oe_+oo 8.13a•OO 7 76&•00 6 79e•OO 5 82e•OO 4 SSe+OO 3 88e•OO 291a+OO 1 94e•OO 9 71e-01 1.05e-03
Veloclly Veclors Colored By Veloclly Magnitude (mis) Dec 29, 2015
ANSYS Fluent 15.0 (3d. dp. pbns. lam)
Figure 2.16 : Design 3 vectorial aÎJ·flow result, side view
1 94e+01 1 84e+01 1 75e•01 1.65e+01 1 55e•01 1 46e•01 1 36e•01 1 26e•01 1 16e+01 1 07e•01
-
-9 70e+OO ·t__ 8 73e+OO 7 76e+OO 6 79e+OO 5.82e•OO 4 85e+OO 3.88e+OO 2.91e•OO 1 94e+OO g 71e-01 1 OSe-03Veloclty Vectors Colored By Veloclty Magnitude (m/s) Dec 29. 2015
ANSYS Fluent 15.0 (3d, dp, pbns. lam)
1 94e+01 1 84e•01 1 75e•01 1 65e•01 1 SSe•O 1 1 46e•01 1 36e•01 1 26e•01 '; 116e+01 1 07e+01 9 70e•OO 8 73e•OO 7 76e•OO 6 79e•OO 5 82e+OO 4 85e•OO 3.88e•OO 2 91e+OO 1 94e+OO 9 71e-01 1 OSe-03
Ve1oclly Vectors Colored By Velo elly Magnitude (m/s)
x
_j
Dec 29,2015
ANSYS Fluent 15.0 (3d, dp, pbns.lam) 33
Figure 2.18 :Design 3 vectorial airflow result, 3D view, PAS body included, result on Z plane
2.4 Design 4
2.4.1 Pattern 4
From the results of the three previous designs, we evaluate that there were some points that could be improved. For example, due to the wide inlets, it is possible that water easily penetrate into the PAS. A Iso, in the third design it is possible that sampling media be moistened in. rainy environments. Then, the fourth pattern was designed to reduce water penetration into the PAS and also to improve PAS aerodynamic shape.
The fourth pattern design consists of2 separated parts, bottom part and top part. There is a trapezius placed in the middle of the bottom part (Figure 2.19 d) that holds the sampling media with the maximum thickness of2 mm. At the front side of the bottom
34
part, there is a half-spherical curve (Figure 2.19 b) that: 1- intakes the sampling air,
2-prevents the water to come inside the PAS by increasing the thickness of the PAS entrance and 3-deflect the intake air to the sampling media surface. Also, two air exit channels were embedded in the back side of it (Figure 2.19 a, d).
a
b
Air exit channels
Figure 2.19 : PAS fourtl1 concept design bottom part. (a) Back view. (b) Side view. (c) Bottom
view. (d) Top view
35
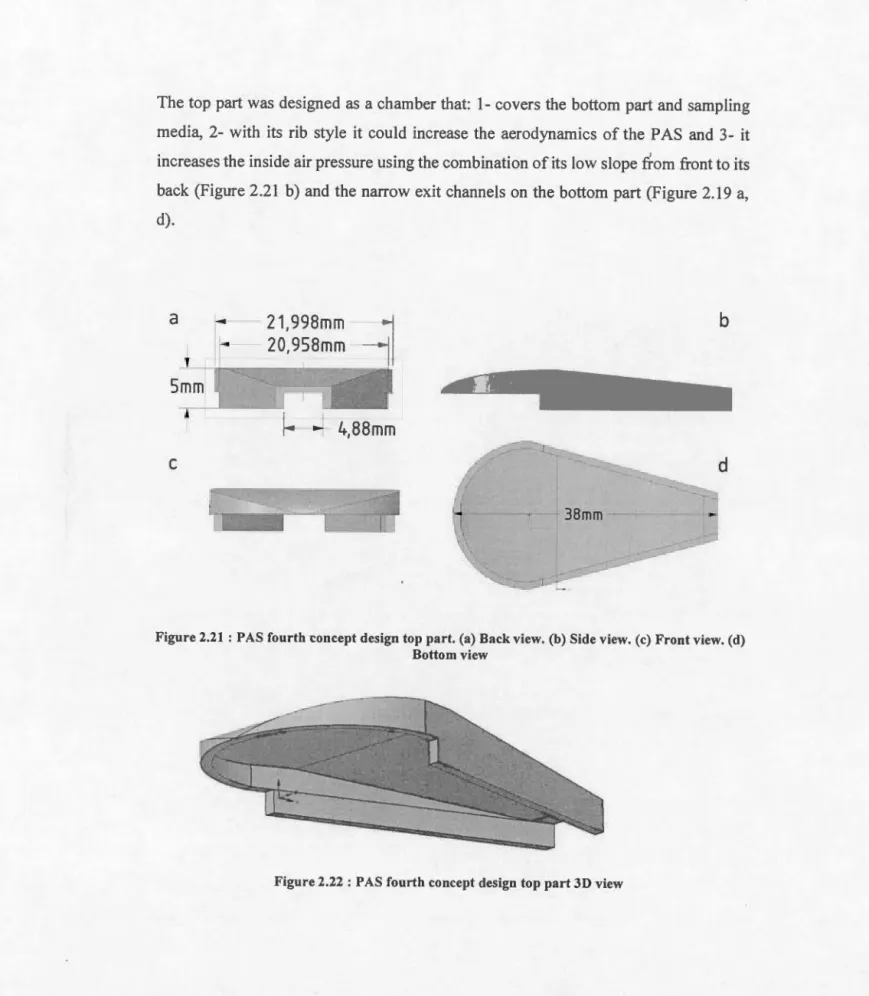
The top part was designed as a chamber that: 1- covers the bottom part and sampling
media, 2- with its rib style it could increase the aerodynamics of the PAS and 3- it
'
increases the inside air pressure using the combination of its low slope from front to its back (Figure 2.21 b) and the narrow exit channels on the bottom part (Figure 2.19 a,
d).
a
21,998mm
b
20,958mm
1.
--
4,88mm
c
Figure 2.21 : PAS fout·th ·concept design top part. (a) Back view. (b) Side view. (c) Front view. (d) Bottom view
36
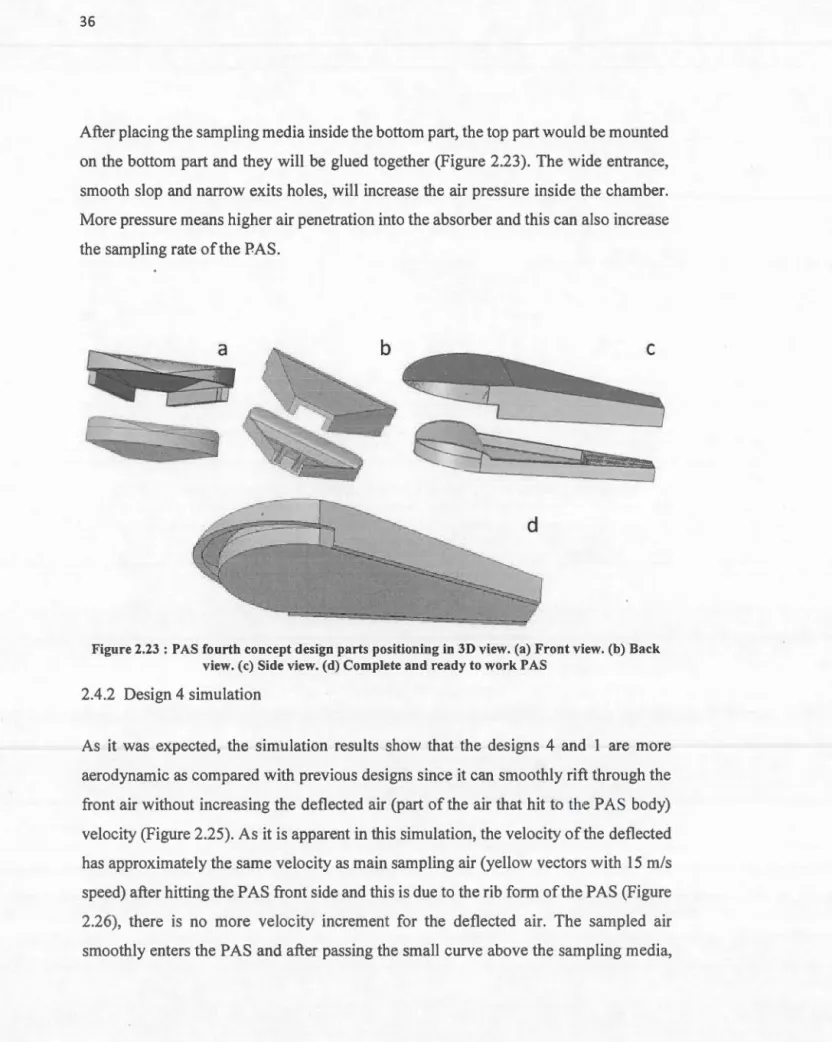
After placing the sampling media inside the bottom part, the top part would be mounted on the bottom part and they will be glued together (Figure 2.23). The wide entrance,
smooth slop and narrow exits hales, will increase the air pressure inside the chamber. More pressure means higher air penetration into the absorber and this can also increase the sampling rate of the PAS.
Figure 2.23 : PAS fourth concept design parts positioning in 3D view. (a) Front view. (b) Back
view. (c) Side view. (d) Complete and ready to wo•·k PAS 2.4.2 Design 4 simulation
As it was expected, the simulation results show that the designs 4 and 1 are more aerodynamic as compared with previous designs since it can smoothly rift through the front air without increasing the deflected air (part of the air that hit to the PAS body) velocity (Figure 2.25). As it is apparent in this simulation, the velocity of the deflected has approximately the same velocity as main sampling air (yellow vectors with 15 m/s speed) after hitting the PAS front side and this is due to the rib form of the PAS (Figure
2.26), there is no more velocity increment for the deflected air. The sampled air smoothly enters the PAS and after passing the small curve above the sampling media,
37
it moves down (Figure 2.25). This means that the entered air directly exposes the
sampling media and then exits the PAS through the exit channels. Moreover, narrower
exit channels cause velocity increment which means more pressure _in the sampler
chamber and this will increase the air exposure of the sampling media.
38 2 27e+01 2 16e+01 2 04e+01 1 93e+01 1.82e+01 1 70e+01 1.59e•01 1 47a+01 1 36e+01 1.2Se+01 1 13e+01 1 02e•01 9 OSe+ DO 7.94e+OO 6 81e+OO 5 67e•OO 4 54e+OO 3 40e+OO 2 27e•OO ·1 14e•OO 1 36e-03
Velocity Vec1ors Colored By Velocily Magnitude (mis)
x.J
Dec 29. 2015 ANSYS Fluent 15.0 (3d, dp. pbns, lam)Figure 2.25 : Design 4 vectorial airflow result, side view
2 27e+01 2 16e+01 2 04o+01 1 93e+01 1 82e•01 1 70e•01 1.59e•01 1 47e+01 1 36e•01 1 2Se•01 1 13e•01 1 02e•01 9 08e+OO 7 94e•OO 6.81e+OO 5 67a+OO 4 54e+OO 3 40e+OO 2 27e+OO 1 14e+OO 1 36e-03
Veloclty Vectors Colored By Veloclly Magnitude (mis) Dec 29,2015 ANS YS Fluent 15.0 (3d. dp. pbns. lam)
2.27e•01 2 16e+0'1 2.04e•01 1 93e+0'1 1 B2e+01 ·1 70e•01 1 59e•01 1 47e+01 · 1.36e+01 1 25e•01 1 13e+01 102e+01 9.08e+OO 7.94e+OO 681e•OO 5 67e•OO 4 54e•OO 3.40e+OO 2 27e+OO 1 14e•OO 1 36e-03
Ve1oci1y Vectors Co1ored By Ve1ocity Magnitude (m/s)
)
,
Dec 29, 2015
ANSYS Fluent 15.0 (3d, dp, pbns, lam)
Figure 2.27: Design 4 vectorial airllow result, 3D view, PAS body included
2.5 Design 5
2.5.1 Pattern 5
2.5 .1.1 Pattern 5-l
39
Pattern 5 was designed based on results from previous designs in order to have a PAS that will be able to: 1-intake as much air volume as possible from ali directions, 2- be
able to protect ali the inside media from direct exposure to water and sunlight, 3- have
a unique sampling media with larger active surface area instead of severa! small surface
media which helps us to have the same air exposure conditions on ali sampling media
for better analyzing, 4- be more aerodynamic and 5-protect sampling media from direct
40
ln the fifth design, the PAS pattern was changed to a circular shape (Figure 2.28, 2.30). lt consists of two separated parts like for design four. The sampling media would be placed at the center of the bottom part white 5 small (2 mm height) pins (Figure 2.28 a, 2.29) will support it and keep it high enough from the PAS floor for better air
circulation. Four 2.5 x 4 mm supports was considered to hold the top part. Under each
one of them, a channel was devised as an air exit ho le. 2 mm fi !let was used to curve the inside wall of the PAS for better air circulation under the sampling media.
1
12.288mm
1
a
Figure 2.28 : PAS firth (5-1) concept design bottom part. (a) Top view. (b) Bottom view. (c) Si de view
41
Figut·e 2.29: PAS fifth (5-1) concept design bottom part 3D view. (a) Wired view. (b) Shaded view. Note that tbe wired view is only provided for better imagination
The same shape was used to design the top part. The top part should be designed in such a way that it cou id be able to cover the bottom part and protect the inside media from high velocity air white letting some low velocity air be entered to the PAS. In this case the diameter of the top part should be designed larger than the bottom part (Figure 2.30 a, 2.28 a). This will create some empty spaces between both parts that will act as an air entrance. In order to protect sampling media from high velocity air, the height of the four supports were kept inside the top part (Figure 2.31). This will bring the bottom part (in arder to be glued together) insider to the top part and this makes some overlap between the two parts. To complete the PAS assembly, the bottom part must be glued to the four inside supports, located in the top part, using the HFR free glue (HFR: halogenated flame retardants) ensures that the sampling media is free from HFR contamination during the preparation process.
42
Alignment
Supports
Figure 2.30: PAS fifth (5-l) concept design top part. (a) Top view. (b) Bottom view. (c) Side view
b
Figure 2.32 : PAS firth concept design parts positioning in 3D view. (a) Ove•·all view before
gluing. (b) Complete and ready to work PAS
2.5.1.2 Pattern 5-2
43
While in design 5-1- the bottom-part fulfills most of the PAS requirements, still there could be some improvements. The ideas came from our collaborators in Biology
department, and it was related to the bird's feathers.
The complete PAS should be glued on a plastic substrate in order to be mounted on the
birds. However, due to its thin thickness, it is possible that bird feathers cover the PAS and prevent sampling air from entering into the PAS.
To solve the feather problem, the thickness of the bottom-part of the PAS 5-l increased. This will make the PAS high enough to prevent feathers to cover it. Also, in order to
44
drive out the possible entered water into the PAS, four more water exit holes were added to the bottom part (Figure 2.33, 2.34) to reduce the possible effects of.water on sampling media. After ali those modifications, the final PAS becomes 8 111111 thicker than the previous design (Figure 2.35).
9.5mm
c
l
Figure 2.33: PAS firth (5-2) concept design bottom pat·t. (a) Top view. (b) Bottom view. (c) Side view
45
Figure 2.35 : PAS fifth concept design parts positioning in 3D view. (a) Complete PAS bottom view, showing the air entrance gap between two parts. (b) Complete assembled PAS final
thickness. (c) Complete PAS overall 3D view. (d) 3D positioning of bottom and top part for
assembling
2.5.2 Design 5 Simulation
Since the bottom part of the design 5-1 was not acceptable due toits thin thickness, only the design 5-2 was simulated. The results are shown in figures 2.37, 2.38. As it can be seen on the figures, the sampled air enters the PAS with a velocity around 13 mis. After touching the top part (Figure 2.38), it reaches a smooth circulation inside the PAS with a velocity ranging between 1 and 5 mis (Figure 2.38, 2.39). Then, it cornes out from the PAS through the exit ho les situated around and at the bottom of the deviee. Also, we can see on figure 2.37 that the front exit ho le generates small turbulence under the sampling media. This effect should be avoided. As figure 2.37 shows, there is an
46
air turbulence where the two parts are connected due to the impact of the air into the blocked space. This might cause parts separation in high air velocity conditions. Moreover, the velocity of the air around the PAS is increased to 20 m/s after impacts
to the top and bottom of the PAS while the air impacting the left and right sides of the PAS has approximately the same velocity (Figure 2.38, 2.39).
Based on simulations results some modifications should be made on this PAS design
in arder to decrease the velocity of air entering the PAS, to reduce the turbulent effects on the front support, to remove the air turbulence under the sampling media due to the front exit hales and to prevent air velocity acceleration.
1 94e+01 1 84e+01 1 74e+O 1 1 65e+01 1 55e+01 1 45e+01 1 36e•01 1 26e+01 1 16e+01 1 07e+01 9 70e+OO 8 73a+OO 7 76e•OO 6 79e•OO 5 82e•OO 4 85e+OO 3 88e•OO 2 91e+OO 1 94e•OO 9 74e-01 5 27e-03 ~~ ~·~~~;{~;~:;~·:····~ Ir·~'
~~{:·
;
\1:~\~::~;.,
..
,;\
~
i~
'i(
~
;-.:~·] :t't$.~ :...Valocily Veel ors Colored By Veloclty Magnitude (mis)
!
.
::illl ,/.
.. ~ .. J\ir~..
Dec 29. 2015ANSYS Fluenl15.0 (3d. dp, pbns, lam)
Figure 2.37 : Design 5 vectol'ial airflow result, side view, supports included
1 94e+01 1 84e•01 1 74e+01 1 65e+01 1 55e•01 1 45e•01 1 36e•01 1 26e•01 1 16e+01
'
1 07e+01 _l 9 70a+OO 8 73e+OO 7 76e•OO 6 79e•OO 5 82e+OO 4 85e+OO 3 88e•OO 2 91e+OO 1 94e+OO 9 74e-01 5 27e-03Velocily Vectors Colored By Veloclty Magnilude (mis) Dec 29, 2015
ANSYS Fluent 15.0 (3d, dp. pbns, lam)
Figure 2.38 : Design 5 vectorial airflow result, side view, gap included
48 1 ,949+01 1 84e•01 1 74e•01 ·1.6Se•01 1 55e+01 1 45e•01 1 36e•01 1 26e+01 1 16e+01 1 07e•01 9 70e•OO 8 73e+OO 776e+OO 6 79e+OO 5 82e+OO 4 85e•OO 3 88e•OO 2 91e•OO 1 94e•OO 9 74e-01 5.27e-03
Veloclly Vectors Colored By Veloclly Magnitude (mis) Dec 29, 2015
ANSYS Fluen; ~5.0 (3d. dp, pbns, lam)
Figure 2.39 : Design 5 vectorial airflow result, top view, results on Z plane in the middle of the
PAS 1 94e+01 1 84e•D1 1 74e•01 1 65e•01 1 55e•01 1 45e•01 1 36e•01 1 26e•01 1 16e+01 1 07e•01 9 70e+OO 8 73e+OO 7 76e•OO 6 79e•OO 5.82e+OO 4 85e+OO 3 88e•OO 2 91e•OO 1 94e•OO 9 74e-O 1 5 27e-03
Veloclty Vectors Colored By Velocity Magnitude (mis) Dec 29.2015
ANSYS Fluen115.0 (3d, dp, pbns, lam)
Figure 2.40 Design 5 vectorial airflow •-esult, 3D view, PAS body included, results on Y and Z