OATAO is an open access repository that collects the work of Toulouse
researchers and makes it freely available over the web where possible
Any correspondence concerning this service should be sent
to the repository administrator:
[email protected]
This is an author’s version published in:
http://oatao.univ-toulouse.fr/24652
To cite this version:
Wang, Xuehang and Mathis, Tyler S. and Li, Ke and Lin, Zifeng
and Vlcek,
Lukas and Torita, Takeshi and Osti, Naresh C. and Hatter, Christine and
Urbankowski, Patrick and Sarycheva, Asia and Tyagi, Madhusudan and
Mamontov, Eugene and Simon, Patrice
and Gogotsi, Yury Influences from
solvents on charge storage in titanium carbide MXenes. (2019) Nature Energy,
4 (3). 241-248. ISSN 2058-7546
https://doi.org/10.1038/s41560-019-0339-9
G
rowing demand for fast-charging electrochemical energy stor-age devices with long cycle lifetimes for portable electronics has led to a desire for alternatives to current battery systems, which store energy via slow, diffusion-limited Faradaic reactions. The devices that fit these demands most closely are electrochemi-cal double-layer capacitors (EDLCs), also electrochemi-called supercapacitors, which can be fully charged within minutes with almost unlimited cyclability. However, the energy that can be stored via physisorption of ions at the pore walls of the porous carbons currently used in supercapacitor electrodes is much lower than the charge stored in battery materials, making them unsuitable replacements for many applications1. Replacing the carbon electrodes in supercapacitorswith pseudocapacitive materials results in devices with the potential for higher energy storage capabilities versus devices using EDLC-type materials2. Unlike the diffusion-controlled intercalation of
charge-storing ions into the crystal structure of battery materials, pseudocapacitive charge storage is defined by fast surface-confined redox reactions, which enable high-rate energy storage. The most prevalent mindset for designing energy storage systems is that the choice of electrode material is the dominant factor in determining the mechanism by which charge will be stored3,4. Bulky materials,
such as graphite, tin and silicon, are battery anode materials with diffusion-controlled intercalation5, where the insertion of ions into
the bulk of these types of material leads to phase transformations and requires a large overpotential as the driving force to overcome the intercalation energy barrier in the material lattice. Surface-functionalized two-dimensional (2D) materials, e.g. reduced gra-phene oxide6, allow for the insertion of ions between their layers
with relative ease, but mainly double-layer capacitive charge storage has been observed for these materials unless the electrode surface is modified by pseudocapacitive materials (metal oxide or sulfide nanoparticles, redox-active conducting polymers or organic mol-ecules) or if a redox-active electrolyte is used7,8. Materials with
intrinsic pseudocapacitive behaviour, such as RuO2, MnO2, Nb2O5,
conductive polymers and VN9–11, usually feature the presence of fast
intercalation tunnels or surface redox reactions. However, most of these materials, with the exceptions of costly RuO2 and VN, have
limited electronic conductivity, limiting the high-power capabilities of devices made using these materials.
MXenes, a class of 2D materials with values of electrical conduc-tivity up to 10,000 S cm−1, have shown potential as
pseudocapaci-tive electrode materials in acidic aqueous electrolytes12, where the
MXene Ti3C2 has demonstrated high volumetric capacitance, up to
1,500 F cm−3 (ref. 13). However, the small voltage window of
aque-ous electrolytes limited the maximum energy storage capability of these studies, leaving organic electrolytes as a better alternative for higher-energy applications. Before this study, limited intercalation, or no intercalation, was reported for Ti3C2 with organic electrolyte
systems using organic cations where moderate capacitance values were reported (70–85 F g−1 at 2 mV s−1)14,15. Another study reported
higher capacitance values (200 F g−1, or 80 F cm−3, at 0.2 mV s−1) for
half-cells with electrodes made from multilayer Ti3C2 and using a
typical battery electrolyte, lithium hexafluorophosphate in ethyl-ene carbonate/dimethyl carbonate16. Their further demonstration
of a hybrid Li-ion capacitor using a Ti2C negative electrode and a
battery-type material for the positive electrode shows the potential
Influences from solvents on charge storage in
titanium carbide MXenes
Xuehang Wang
1, Tyler S. Mathis
1, Ke Li
1, Zifeng Lin
2,3, Lukas Vlcek
4,5, Takeshi Torita
6,
Naresh C. Osti
7, Christine Hatter
1, Patrick Urbankowski
1, Asia Sarycheva
1, Madhusudan Tyagi
8,9,
Eugene Mamontov
7, Patrice Simon
2,10and Yury Gogotsi
1*
Pseudocapacitive energy storage in supercapacitor electrodes differs significantly from the electrical double-layer mecha-nism of porous carbon materials, which requires a change from conventional thinking when choosing appropriate electrolytes. Here we show how simply changing the solvent of an electrolyte system can drastically influence the pseudocapacitive charge storage of the two-dimensional titanium carbide, Ti3C2 (a representative member of the MXene family). Measurements of
the charge stored by Ti3C2 in lithium-containing electrolytes with nitrile-, carbonate- and sulfoxide-based solvents show that
the use of a carbonate solvent doubles the charge stored by Ti3C2 when compared with the other solvent systems. We find
that the chemical nature of the electrolyte solvent has a profound effect on the arrangement of molecules/ions in Ti3C2, which
correlates directly to the total charge being stored. Having nearly completely desolvated lithium ions in Ti3C2 for the
carbon-ate-based electrolyte leads to high volumetric capacitance at high charge–discharge rates, demonstrating the importance of considering all aspects of an electrochemical system during development.
1A. J. Drexel Nanomaterials Institute and Department of Materials Science and Engineering, Drexel University, Philadelphia, PA, USA. 2Materials Science
Department—CIRIMAT, Université Paul Sabatier, Toulouse, France. 3Department of Materials Science and Engineering, Sichuan University, Chengdu,
China. 4Materials Science and Technology Division, Materials Theory Group, Oak Ridge National Laboratory, Oak Ridge, TN, USA. 5Joint Institute
for Computational Sciences, University of Tennessee, Knoxville, Oak Ridge, TN, USA. 6Murata Manufacturing Co., Ltd, Nagaokakyo-shi, Kyoto, Japan. 7Neutron Scattering Division, Oak Ridge National Laboratory, Oak Ridge, TN, USA. 8NIST Center for Neutron Research, National Institute of Standards and
Technology, Gaithersburg, MD, USA. 9Department of Materials Science and Engineering, University of Maryland, College Park, MD, USA. 10Réseau sur le
that MXenes can have in these applications. These previous reports examined to some extent the mechanisms by which charge was stored in the MXenes that were used, and they showed variations in the interlayer spacing of the MXene during cycling, mention-ing that the intercalation of charge-stormention-ing ions was accompanied by the penetration of solvent molecules into the MXene interlayer spaces. However, these reports did not consider the effects that making changes to their electrolyte chemistry could have had upon the electrochemical responses of their systems.
In this study, we demonstrate that the choice of the electrolyte solvent plays a significant role in determining the Li-ion intercalation process for Ti3C2 MXene electrode in organic electrolytes. During
cycling using an electrolyte of lithium bis(trifluoromethylsulfonyl) amine (LiTFSI) in propylene carbonate (PC), the Li ions present in the interlayer space of the Ti3C2 are found to be fully desolvated,
leading to a charge-storage mechanism dominated by pseudoca-pacitive intercalation. Replacing the PC solvent with acetonitrile (ACN) or dimethyl sulfoxide (DMSO) leads to a drastic capacitance decrease due to Li ions pulling solvent molecules into the inter-layer spaces of Ti3C2. This result is contrary to expectations based
on carbon supercapacitor research, where ACN, with the highest ionic conductivity, should be the best solvent choice for a superca-pacitor electrolyte7. We show that properly matching the electrolyte
composition to the electrode material is essential for controlling the charge-storage mechanism and is necessary for achieving superior electrochemical performance.
Distinct charging processes for different solvent systems
To facilitate infiltration of the organic electrolytes into the layered Ti3C2, a macroporous Ti3C2 (Supplementary Fig. 1) was used as
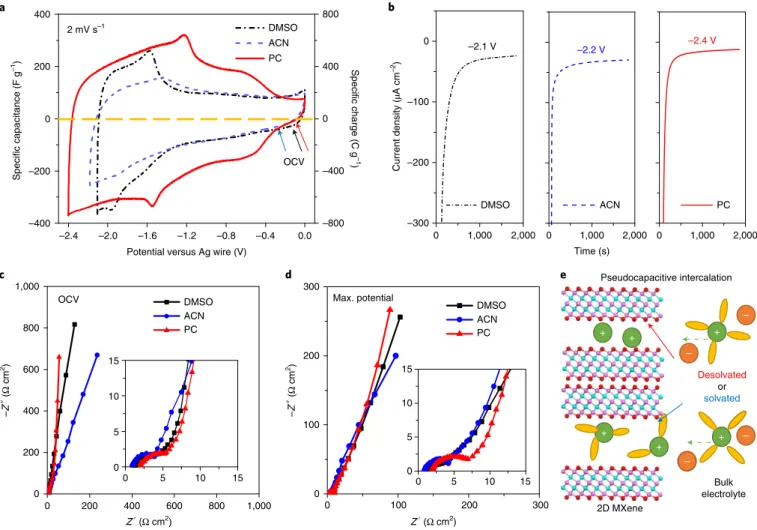
the working electrode material. Figure 1a shows a comparison of cyclic voltammograms (CVs) at 2 mV s−1 for macroporous Ti
3C2
electrodes tested in three 1 M LiTFSI organic electrolytes with different solvents, DMSO, ACN and PC. Electrodes cycled in the PC-based electrolyte showed higher Coulombic efficiency (96%), and a wider negative voltage window of 2.4 V when compared with the electrodes cycled in DMSO (2.1 V) and ACN (2.2 V). Chronoamperometry tests confirm a smaller steady-state leakage current value in the PC system (–12.5 µA cm−2) at –2.4 V versus Ag
when compared with the other two electrolytes (Fig. 1b). All three systems showed leakage current densities smaller than –30 µA cm−2,
indicating negligible contributions from any side reactions at their applied maximum voltage.
The discharge capacitance (charge delivered) at 2 mV s−1,
cal-culated by integrating the anodic scans of the CVs in Fig. 1a, is 130 F g−1 (273 C g−1), 110 F g−1 (242 C g−1) and 195 F g−1 (468 C g−1) in
LiTFSI–DMSO, LiTFSI–ACN and LiTFSI–PC, respectively. As the applied potentials are negative relative to the open-circuit voltage (OCV), lithium ion intercalation dominates the charging process. In general, ions with smaller size are beneficial for the electrical double-layer capacitance17. Partial or complete removal of the
solva-tion shell of ions inserted into micropores may also enhance capac-itance18. However, the choice of the solvent, which is not directly
involved in charge storage, seems less important for the charge-stor-age capability of the electrode. The solvents’ ionic conductivity is considered to profoundly affect the rate capability of the electrode, but no more consideration is given beyond that7. When compared
with a PC-based electrolyte, ACN-based and DMSO-based LiTFSI electrolytes have higher ionic conductivity19, which correlates to
better ion transport ability in the bulk electrolyte. Surprisingly, on the same macroporous Ti3C2, the PC-based electrolyte stores 71%
and 93% more charge than the DMSO- and ACN-based electro-lytes, respectively, demonstrating that the solvent of the electrolyte is capable of strongly influencing the electrochemical performance.
The shapes of the CVs, which reflect the charging mechanism4,20,
also show a strong dependence on the electrolyte composition used
with the Ti3C2 negative electrode. In the LiTFSI–DMSO
electro-lyte, the CV in Fig. 1a shows characteristics of capacitive-dominant behaviour in the potential range of OCV to –1.2 V versus Ag, with slowly increasing intercalative behaviour. Then, the charging process evolves into an intercalation-like mechanism below –1.2 V versus Ag, with visible redox peaks being seen. Galvanostatic charge–dis-charge (GCD) tests for the DMSO-based electrolyte also confirm two stages of charging (Supplementary Fig. 2). When LiTFSI–ACN was used as electrolyte, the CV showed the same initial features, that is capacitive-dominant behaviour at more positive potentials and a stronger intercalation feature at higher states of charging. However, when compared with the DMSO-based electrolyte, the electrochemical signature of the ACN system at higher states of charge (negative potentials) suggests sluggish electrochemical reac-tion kinetics, as can be seen from the lower current and the presence of broad peaks; this is also visible in the GCD tests, which show a nearly linear dependence of the potential on time.
In comparison, voltammograms of Ti3C2 in LiTFSI/PC
elec-trolyte show different features, with two pairs of symmetric peaks during cycling, indicating that the charging process is dominated by fast redox reactions associated with the intercalation processes. The contribution of electrical double-layer capacitance to the over-all capacitance is discussed in Supplementary Discussion 1. The cathodic intercalation process starts at about –0.3 V and expands gradually down to –1.5 V versus Ag. Below –1.5 V versus Ag, the process is similar to what was observed in the DMSO-based elec-trolyte. However, the higher current shows that there is improved electrochemical activity for the PC system. Interestingly, the redox peaks at about –1.5 V versus Ag are shifted to higher potential in the PC system when compared with DMSO. Also, the peak potential difference between the anodic and cathodic peaks (∆Ep) is lower
than that of DMSO: ∆Ep = 0.35 V and 0.5 V in PC- and
DMSO-based electrolytes, respectively. This suggests faster electrochemical reaction kinetics in the PC-based electrolyte.
Electrochemical impedance spectroscopy (EIS) measurements were performed for each of the three electrolytes at OCV and the maximum negative potential. The equivalent series resistance, taken from the real-axis intercept of the Nyquist plots in Fig. 1c, increases for the solvents used in this study in the following order: ACN, DMSO and then PC, in agreement with the trend of decreas-ing electrolyte conductivity19. At OCV, the Ti
3C2 electrode shows
typical capacitive behaviour in both DMSO- and PC-based elec-trolytes, with a small loop in the high-frequency region associated with interfacial impedance at the electrode/current-collector inter-face, followed by a sharp increase at low frequencies. The inset of Fig. 1c shows that there is a small region with a 45° slope in the mid-frequency range, indicating that there are similar ion diffusion limitations for the PC and DMSO systems at their resting poten-tials. In contrast, the EIS plot of the ACN system shows a deviation from ideal capacitive behaviour in the low-frequency region, with a nearly constant increase of both the imaginary and the real parts of the impedance21,22. This is evidence that the solvent in the ACN
sys-tem limits the accessibility and transport of lithium ions inside the porous structure of the Ti3C2 electrode, contrary to what would be
expected on the basis of the high ionic conductivity of ACN-based electrolytes. When the EIS spectra were recorded at the maximum negative potential of each system (Fig. 1d), all the Nyquist plots showed deviations from capacitive behaviour in the low-frequency region and slightly higher ion diffusion resistance (45° linear part) when compared with the spectra taken at OCV. These observations are consistent with the idea that the charge-storage mechanism of the Ti3C2 electrode is not a purely capacitive process.
Molecular arrangements of electrolytes in MXenes
To facilitate a more fundamental understanding of the distinct charging processes for the different solvent systems, in situ X-ray
study (10.6 Å, Supplementary Fig. 4). Notably, ex situ characteriza-tion, including Raman spectroscopy (Supplementary Fig. 5), X-ray photoelectron spectroscopy (XPS, Supplementary Figs. 6 and 7) and transmission electron microscopy (TEM, Supplementary Fig. 8), verified that the differences in electrochemical signature and in interlayer spacing changes for the three systems were not related to irreversible chemical changes occurring in the Ti3C2 during cycling
(For details see Supplementary Discussion 2).
When compared with the PC-based system with a larger stored charge but unchanged interlayer space, the expansion of the inter-layer space in both DMSO- and ACN-based systems indicates the co-intercalation of solvent molecules into the MXene electrode together with Li ions. Molecular dynamics (MD) simulations were performed to better understand the role the solvents have in influ-encing the interlayer spacing and electrochemical responses of Ti3C2 during cycling. The simulation suggests that about 1.3 DMSO
molecules per Li+ are needed to reproduce the large interlayer
spac-ing for the DMSO system (Fig. 2d). In the charged state, the elec-trolyte forms a structure in which the oxygen atoms of DMSO are oriented to interact with intercalated Li ions at the Ti3C2 electrode
surface, which results in the hydrophobic CH3 groups of the solvent
molecules being directed away from the electrode surface. This cre-ates a hydrophobic environment, illustrated in Fig. 2d, in between two layers of solvents within the interlayer space of the Ti3C2.
–2.4 –2.0 –1.6 –1.2 –0.8 –0.4 0.0 –400 –200 0 200 400 –800 –400 0 400 800 Specific charge (C g –1 ) Specific capacitance (F g –1)
Potential versus Ag wire (V)
DMSO ACN PC 2 mV s–1 0 1,000 2,000 ACN –2.2 V 0 1,000 2,000 PC –2.4 V –2.1 V 0 1,000 2,000 –300 –200 –100 0 Current density ( µA cm –2) Time (s) DMSO 0 100 200 300 0 100 200 300 0 5 10 15 Z′ (Ω cm2) –Z ″ (Ω cm 2) DMSO ACN PC Max. potential 0 200 400 600 800 1,000 0 200 400 600 800 1,000 0 5 10 15 0 5 10 15 0 5 10 15 –Z ″ (Ω cm 2) Z′ (Ω cm2) DMSO ACN PC OCV Pseudocapacitive intercalation 2D MXene + + + + + + – – – – Desolvated or solvated Bulk electrolyte OCV a c d e b
Fig. 1 | Macroporous Ti3C2 electrode with 1 M LiTFSI in DMSO, ACN and PC organic electrolytes. a, CV curves. The OCVs (marked by arrows) are −0.13 V
(black), −0.32 V (blue) and −0.12 V (red) versus Ag for DMSO, ACN and PC-based electrolytes, respectively. b, Chronoamperometry data collected at the applied maximum potentials. c, EIS data collected at the OCV. d, EIS data collected at the maximum negative potential versus Ag. The insets in c and d
show the magnified curves in the high-frequency range; they use the same units as in c and d. e, Schematic of a supercapacitor using 2D MXene (pink, Ti;
cyan, C; red, O) as negative electrode with solvated or desolvated states. Legend for the electrolyte: green, cation; orange, anion; yellow, solvent molecule.
diffraction (XRD) measurements were made to track the evolution of the interlayer space of the Ti3C2 electrodes during cycling (as illustrated
in Fig. 1e). The d-spacing for the DMSO system varied between 18.8 and 19.3 Å during cycling (Fig. 2a). During charging (cathodic polar-ization), the d-spacing increased from the minimum value of 18.8 Å to reach a maximum of 19.3 Å at –1 V, and then decreased to 19.0 Å for the fully charged state. The critical turning point from enlarge-ment to shrinkage of interlayer space occurring at –1 V versus Ag may be correlated to the onset of a state where a substantial number of Li ions have been intercalated. These intercalated Li ions will attract the MXene layers to each other, resulting in a reduced interlayer space23. Alternatively, some solvent molecules may be pushed out
from the interlayer space with the increasing number of ions between the MXene sheets. Upon discharging, this process was exactly reversed, indicating that the cycling process is highly symmetric for the DMSO system. In ACN, the d-spacing changes between 13.0 and 13.4 Å, where the maximum d-spacing is noticeably smaller than even the minimum d-spacing of the DMSO system. Additionally, a small invariable peak at 8.2° can be observed in the ACN system dur-ing cycldur-ing, which indicates that a minor proportion of the electrode material has a constant interlayer spacing of 10.7 Å (Supplementary Fig. 3). A unique situation occurred for the PC system, where the d-spacing of the Ti3C2 stayed constant at 10.7 Å during cycling as
Temperature-dependent quasi-elastic neutron scattering (QENS) measurements made using a neutron backscattering spectrometer show that the methyl group dynamics remains almost unchanged in the charged and discharged DMSO-based system, when compared with the bulk solvent (Supplementary Fig. 9a). This finding suggests that the methyl groups of the intercalated DMSO molecules are as free during charge–discharge as those of the bulk electrolyte, which strongly supports the notion of a hydrophobic environment being formed by the methyl groups. In this environment, any Li+ entering
the electrode has weakened electrostatic interactions with both the distant charged electrode surface and the hydrophobic CH3 groups,
which makes this environment an efficient tunnel for transport of lithium ions. This model environment fits well with the capacitive behaviour of the DMSO system in Fig. 1a,c.
With the smaller d-spacing of the ACN electrolyte system, the calculated ratio of Li+ to ACN molecules is only 1:0.5. This is a much
lower solvation level when compared with the DMSO-based system and allows for only a single layer of ACN solvent in between Ti3C2
layers (Fig. 2e). The smaller rod-like ACN molecules with a single hydrophobic CH3 group cannot easily form a continuous
hydropho-bic layer as in the case of DMSO, but rather tend to align parallel to the Ti3C2 surfaces. On the basis of QENS, the methyl dynamics
of ACN almost completely vanished in the charged and discharged samples, which contrasts with the fairly strong signal seen in the bulk ACN at 80 K (Supplementary Fig. 9b). Compared with the highly mobile methyl group in the DMSO, the very low mobility of the methyl group in ACN agrees with the simulated structure with-out a continuous hydrophobic layer. Such a solvent arrangement
–2 –1 0 0 1 2 3 4 5 6 7 10 12 14 16 –3 –2 –1 00 1 2 3 4 5 6 7 8 16 18 20 22 d-spacing (Å) Voltage (V) d-spacing (Å) Voltage (V) d-spacing (Å) Voltage (V) Time (h) Time (h) Time (h) –2 –1 0 0 1 2 3 4 6 5 7 8 8 10 12 14 Charged state ACN DMSO a d b e f c Charged Discharged Discharged Peak intensity Peak intensity Peak intensity PC 19.0 Å 13.0 Å 10.7 Å Li+ (DMSO) 1.3
Fast ion transport tunnel
Li+ (ACN) 0.5 0.46 Li+ per Ti 3C2 unit 0.37 Li+ per Ti 3C2 unit 0.93 Li+ per Ti 3C2 unit Li+ (PC) 0 Desolvated
Fig. 2 | d-spacing evolution during cycling and molecular arrangements. a, In situ XRD map of vacuum-filtered Ti3C2 in DMSO-based electrolyte. b, In
situ XRD map of vacuum-filtered Ti3C2 in ACN-based electrolyte. c, In situ XRD map of vacuum-filtered Ti3C2 in PC-based electrolyte. The right-hand
curves in a–c show the cycling process during XRD analysis. d, MD simulation result for DMSO-based electrolyte, showing a MXene/Li+/DMSO/fast ion
transport tunnel/DMSO/Li+/MXene structure. e, MD simulation result for ACN-based electrolyte, showing a MXene/Li+/ACN/Li+/MXene structure.
f, MD simulation result for PC-based electrolyte, showing a MXene/Li+/MXene structure. The magnified local molecular arrangements in d–f are shown
as schematics to the right of their MD simulation results. Legend for d–f: green, Li+; pink, Ti; cyan, C; red, O; teal, F; white, H; yellow, S; blue, N, with the size
of the lithium atoms increased for clarity in the simulated images. The MD simulations in d–f were performed on the basis of the experimental values of
low diffusion resistance could benefit from the high conductivity of the Ti3C2 electrode itself12, and possibly a partial breaking of the
Coulombic effect at high confinement25.
The distinct electrolyte arrangements between the Ti3C2 layers
for each solvent system not only influence the ionic transport, but also significantly influence the total amount of charge able to be stored by the electrode. The number of intercalated lithium atoms, calculated on the basis of the pseudocapacitive charge per gram of macroporous Ti3C2, turns out to be 0.93 per Ti3C2 unit for the
PC-based electrolyte, which is more than double that for the other electrolyte systems (0.46 and 0.37 for DMSO and ACN electrolytes, respectively). Unlike three-dimensional materials with fixed pore sizes, the expandability of the interlayer spacing of MXenes has been demonstrated during electrochemical cycling in both aque-ous and ionic liquid electrolytes26–28. Previously reported strategies
for increasing the charge-storage capabilities of 2D materials have focused on increasing their interlayer spacing to increase the acces-sible surface area and improve ion transport rates. This thought process holds true when comparing the electrolyte structure in the DMSO system, with the largest interlayer spacing in this study, which offers lower ion transfer resistance and higher capacitance than the ACN system. However, the highest capacitance is achieved in the fully desolvated PC system, which contrasts starkly with the DMSO system. Li ions that have been completely stripped of their solvation shell can attach strongly to both pore surfaces at the same time, which should be favourable for additional Li+ to enter the
interlayer spaces of the Ti3C2. This also helps explain why the
inter-calation-type electrochemical response starts at a potential very close to the resting potential in the PC-based electrolyte in Fig. 1a. For the other electrolyte systems, the presence of solvent molecules
0 2,000 4,000 6,000 8,000 10,000 0 20 40 60 80 100
Percentage capacitance retention
Cycle number –2.5 –2.0 –1.5 –1.0 –0.5 0.0 –200 –150 –100 –50 0 50 100 150 Capacitance (F g −1)
Potential versus Ag wire (V) 20th cycle 10,020th cycle 94% retention 100 mV s−1 –2.5 –2.0 –1.5 –1.0 –0.5 0.0 0.5 1.0 0.5 –400 –200 0 200 400 Specific capacitance (F g −1)
Potential versus Ag wire (V) Macroporous Ti3C2 Graphene–CNT 0 200 400 600 800 0 200 400 600 800 0 5 10 15 0 5 10 15 –Z ″ (Ω cm 2) Z′ (Ω cm2) OCV –0.5 V –1.0 V –1.6 V –2.4 V 0 –1 0 1 2 0.75 mg cm−2 1.5 mg cm−2 log[ ip (A g −1)] log[v (mV s−1)] ip = avb 2–1,000 mV s−1 1 2 3 b c e f d a b = 1 b = 0.5 –2.5 –2.0 –1.5 –1.0 –0.5 0.0 –400 –200 0 200 400 Specific capacitance (F g −1)
Potential versus Ag wire (V) 2–1,000 mV s−1 0 400 800 1,200 1,600 2,000 2,400 0.0 –0.5 –1.0 –1.5 –2.0 –2.5
Potential versus Ag wire (V)
Time (s)
0.5 A g−1
1 A g−1
3 A g−1
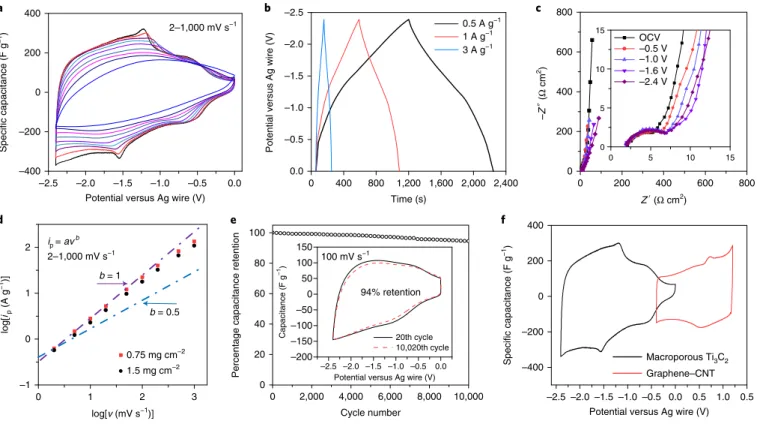
Fig. 3 | Electrochemical performance of the macroporous Ti3C2 in LiTFSI with PC solvent. a, Three-electrode CV curves: the scan rates from outer cycle to
inner cycle are 2, 5, 10, 20, 50, 100, 200, 500 and 1,000 mV s−1. b, Three-electrode galvanostatic charge–discharge curves with current densities of 0.5, 1 and
3 A g−1. c, Impedance spectra collected at different potentials for the LiTFSI–PC electrolyte. The inset shows the magnified curve in the high-frequency range.
d, Determination of the slope, b value, for the logarithm of anodic peak (discharge) current (ip) versus logarithm of scan rate (ν) from 2 to 1,000 mV s−1 with
mass loadings of 0.75 mg cm−2 and 1.5 mg cm−2. b = 1 indicates non-diffusion-limited capacitive storage and b = 0.5 means diffusion-limited processes.
e, Cycling stability at 100 mV s−1 for 10,000 cycles; the inset shows the CVs of the 20th cycle and the 10,020th cycle. f, Full cell fabrication: three-electrode
CV of the macroporous Ti3C2 MXene (195 F g−1, 410 F cm−3) and graphene–CNT composite electrodes (144 F g−1, 230 F cm−3) at 2 mV s−1.
within the Ti3C2 layers would severely hinder the mobility of lithium
ions during Li+ insertion/de-insertion, which agrees well with the
distorted CVs at high polarization (Fig. 1a) and deviations from capacitive behaviour at low frequencies on the EIS curve (Fig. 1c).
The modelled situation for the PC electrolyte system (Fig. 2f) again differs significantly from both the ACN and DMSO systems. The in situ XRD results show that the d-spacing for this system remains constant at 10.7 Å (an interlayer spacing of <2.9 Å) dur-ing cycldur-ing. This small interlayer spacdur-ing in the PC system cannot accommodate any solvent molecules with the intercalated lithium ions, meaning that the Li+ in between the Ti
3C2 layers should be
fully desolvated. The mean squared displacement measured by QENS shows that the PC molecules are less tightly confined than the ACN molecules (Supplementary Fig. 9c and Supplementary Fig. 10), despite the smallest interlayer space for the PC electrolyte. This agrees with there being no PC molecules residing between the Ti3C2 layers. As discussed in Supplementary Discussion 3, neither
solid-electrolyte interphase formation nor the solvent–ion interac-tion alone can explain the complete desolvainterac-tion of Li ions from the PC electrolyte. The combination of these factors, as well as the sol-vent–MXene interactions, is probably the reason for the observed behaviour. However, further studies of interactions in various ion–MXene–solvent systems are certainly needed. With such solvent-free Li ions in the interlayer spaces, the charging process in Ti3C2 in PC-based electrolyte appears to be very similar to the
Li+ intercalation process in a bulk material of a battery anode24.
However, unlike a real battery, the Ti3C2 electrode still showed
pseu-docapacitive features in its impedance spectra (Fig. 1c), due to the 2D structure of the Ti3C2 materials, which offers highly accessible
redox-active sites. Additionally, the pseudocapacitive feature with
sterically hinders the access of Li+, and Li+ can only be attached
to one of the interlayer surfaces, as the co-intercalated solvent molecules drive the Ti3C2 layers apart.
Full desolvation towards enhanced energy storage in MXene
A full electrochemical evaluation of a macroporous Ti3C2 electrode,
including rate capability, cycling stability and full cell performance, was conducted using the PC-based electrolyte to demonstrate the full capabilities of this system. In Fig. 3a, the two sets of reversible redox peaks in the CVs are visible for the anodic and cathodic sweeps with a small peak potential separation when cycling at 2 mV s−1,
indicating that this is a fast, non-diffusion-limited pseudo-interca-lation mechanism2,20,29. The nonlinear GCD curve without a plateau
(Fig. 3b) and the nearly vertical EIS curve in the low-frequency region for the charged states (Fig. 1c) further show that Ti3C2
stores charge pseudocapacitively. As the state of charge increases, the impedance spectra in the low-frequency region gradually devi-ate further from ideality, with the gredevi-atest shifts seen at –1.6 V and –2.4 V versus Ag. This fits well with the strong intercalation reactions that occur from –1.5 V versus Ag on the CV curve. The b value, which is used to distinguish between battery-like (diffu-sion-controlled) and supercapacitor-like behaviours14, was
evalu-ated on the basis of the current density at the highest peak for Ti3C2
electrodes. The b value of Ti3C2 MXene is very close to 1 in a large
range of scan rate from 2 to 1,000 mV s−1, as shown in Fig. 3d and
Supplementary Fig. 11a; this is characteristic of a non-diffusion-limited pseudocapacitive intercalation process.
The capacitance of the electrode (mass loading = 0.75 mg cm−2)
at 2 mV s−1 was calculated to be 195 F g−1 (410 F cm−3) over a voltage
window of 2.4 V. When the scan rate increases to 1,000 mV s−1, the
capacitance remains at 120 F g−1 (252 F cm−3), a capacitance
reten-tion of 61% relative to the value at 2 mV s−1, an impressive result
considering this is a 2D material in an organic electrolyte. Doubling the electrode mass loading results in a capacitance retention of 58% at 1,000 mV s−1, showing a weak dependence of the capacitance
retention on electrode thickness for the range of mass loadings used in this study (Supplementary Fig. 11b,c). The charge stored in the pseudocapacitive MXene electrode, or the capacity (mAh g−1), was
evaluated by using GCD curves (on the basis of Equation 2) at cur-rent densities from 0.5 A g−1 to 100 A g−1 (Supplementary Fig. 12).
The capacity of the macroporous Ti3C2 electrode was 145 mAh g−1
at 0.5 A g−1 (≈3.5 C rate) and 100 mAh g−1 at 100 A g−1 (≈700 C), or a
71% capacity retention. Supplementary Fig. 11d shows the volumet-ric capacitance at different scan rates in comparison with literature reports on materials with high volumetric capacitance in organic electrolytes, demonstrating the improvements that the macropo-rous Ti3C2 electrode material in the PC-based electrolyte has made
over previous studies. The cycling life of the electrode was tested with a voltage window of 2.4 V and a scan rate of 100 mV s−1. The
Ti3C2 electrode showed a good cycling stability of 94% capacitance
retention after 10,000 cycles (Fig. 3e). The stability of the Ti3C2
electrode was also evaluated using floating tests (Supplementary Fig. 13), which resulted in 96% capacitance retention after 120 h of floating with a slightly smaller (–0.01 A g−1) leakage current when
compared with the first loop. An asymmetric full cell was made with Ti3C2 as the negative electrode and a graphene–carbon nanotube
composite (graphene–CNT) as the positive electrode to further evaluate the Ti3C2 pseudocapacitive electrode in a practical manner
(Fig. 3f). The advantageous energy density versus power density of the full cell (Supplementary Fig. 14) demonstrates how getting the right combination of electrode material and electrolyte can improve the electrochemical performance of the final device.
Conclusions
We have demonstrated that correctly coupling organic electro-lytes with 2D Ti3C2 electrodes is dominant in determining the
electrochemical charge-storage mechanism. The choice of solvent has been proven to be capable of controlling ion transport and intercalation with distinct evolutions in the interlayer spacing. Remarkably, the PC–Ti3C2 system brings about efficient desolvation
during charging, resulting in high volumetric charge-storage capa-bility and fast charge transport. With minimized interlayer distance, maximized capacitance and good rate performance, this charging behaviour provides new insights for energy storage in 2D materi-als by efficiently coupling electrolytes and electrode materimateri-als. This study also demonstrates a rational design routine for coupling elec-trode materials with optimized electrolytes.
Methods
Preparation of Ti3C2 colloidal solution. Multilayer Ti3C2 was produced by etching
Ti3AlC2 MAX phase in a mixture of HCl and LiF, similar to the method reported in
our previous study30. In detail, 1 g of LiF was added to 20 ml of 9 M HCl solution,
followed by a slow addition of 1 g of Ti3AlC2 with stirring in an ice bath. After
etching at 35 °C for 24 h, the multilayer Ti3C2 was washed with deionized water by
centrifuging until the pH of the supernatant reached about 6. The sediment of the
centrifuge (multilayer Ti3C2) was collected and dried in a desiccator under vacuum.
The multilayer Ti3C2 was dispersed in deionized water before being bath sonicated
for 1 h with Ar bubbling and ice bath. After centrifuging of the sonicated solution
at 3,500 rpm for 1 h, the ‘few-layer’ Ti3C2 colloidal solution in water was collected as
the dark supernatant.
Preparation of vacuum-filtered Ti3C2 thin film. ‘Few-layer’ Ti3C2 colloidal
solution was vacuum filtered through a 25 μm thick Celgard 3501 polypropylene
membrane. The wet Ti3C2 film on the Celgard was collected and dried in vacuum
overnight at 80 °C. The vacuum-filtered Ti3C2 thin film, with a density of 2.6 g cm−3
(Supplementary Fig. 1c), was collected by peeling the thin film off the Celgard.
Preparation of macroporous Ti3C2. The polystyrene (PS) spheres were
polymerized from styrene as reported by Park et al.31. In brief, 100 mg polyvinyl
pyrrolidone and 102.6 mg ammonium persulfate were added to a 500 ml vial containing a solution of 230 ml ethanol and 30 ml deionized water. After stirring the mixture for 10 min at room temperature, 22 ml styrene monomer was added once with quick stirring at 70 °C. The polymerization process continued for 24 h at 70 °C in an oil bath, before it was ended by cooling the vial in an ice bath for 30 min. The PS spheres were collected by centrifuging and washing with deionized water and ethanol afterwards.
The ‘few-layer’ Ti3C2 colloidal solution was sonicated with PS spheres (the mass
ratio between PS and Ti3C2 was 3:1) for 10 min. The colloidal mixture solution was
vacuum filtered onto the Celgard and then vacuum dried in a desiccator overnight.
A free-standing Ti3C2–PS sphere film was peeled off from Celgard and annealed
at 450 °C for 1 h under an argon flow. After removing the PS by annealing, a
free-standing templated porous Ti3C2 was prepared (Supplementary Fig. 1a). The
macroporous Ti3C2 (Supplementary Fig. 1b) was obtained by further pressing the
templated porous Ti3C2 film on a PET film under 3 MPa. The resulting film has a
density of 2.1 g cm−3, slightly lower than conventional vacuum-filtered Ti3C2 films
(2.6–3.0 mg cm−2)32.
Preparation of graphene–CNT composites for positive electrode. Single-wall
CNTs (1 mg, Tuball) were first dispersed in ethanol by probe sonication for 1 h.
Then, 2 ml of 4.5 mg ml−1 graphene oxide aqueous solution (prepared according
to ref. 33) was added to the mixture and probe sonicated for another 30 min. The
mixture was further mixed with 70 µl ammonia solution (28 wt% in water) and 20 µl hydrazine solution (35 wt% in water) and heated at 95 °C for 1 h without stirring to produce a homogeneous black graphene–CNT dispersion. A
free-standing graphene–CNT film, with a density of 1.6 g cm−3, was obtained by vacuum
filtration and vacuum drying at 70 °C for 24 h.
Material characterization. The morphology of Ti3C2 MXene was observed using
scanning electron microscopy (Zeiss Surra 50VP). The MXene structure before and after cycling was confirmed via TEM (JEOL JEM-2100) operated at an accelerating
voltage of 200 kV. The Ti3C2 MXene electrode was mounted in epoxy and allowed
to cure for 24 h. TEM grids were prepared from epoxy-mounted samples using ultramicrotomy with a glass knife. Chemical compositions of the samples were further analysed by high-resolution XPS recorded with a Physical Electronics VersaProbe 5000 instrument equipped with a monochromatic Al Kα X-ray beam (hν = 1,486.6 eV). Peak fitting was carried out using CasaXPS Version 2.3.16
RP 1.6. Raman spectra were recorded with a Renishaw Raman InVia confocal
microscope. Laser excitation was 488 nm, grating 1200 gr mm−1, 5% of laser power.
A ×50 lens was used.
For ex situ neutron scattering experiments, multilayered Ti3C2 MXene was
rolled on to stainless steel mesh in a rolling machine and dried before being used as the supercapacitor electrode. The electrodes were cycled in a three-electrode cell
with activated carbon as the counter-electrode and LiTFSI–DMSO, LiTFSI–ACN and LiTFSI–PC as the electrolytes. For each electrolyte, one discharged electrode
and one charged electrode (at its maximum voltage as shown in Fig. 1a)
were directly dissembled from the cell, kept inside a Teflon-coated cylindrical aluminium sample holder to prevent a loss of charge during the measurement and sealed in helium atmosphere with indium inside a glovebox. Measurements of the temperature dependence of elastically scattered neutron intensity (all samples and an empty cell) were carried out using the high-flux backscattering spectrometer (HFBS) at the National Institute of Standards and Technology (NIST) Center
for Neutron Research34 by operating the instrument in fixed window mode.
The temperature scan was performed with heating from 20 to 320 K at a rate of
1 K min−1 under vacuum. The temperature was controlled using a closed-cycle
helium refrigerator. The intensities of all detectors (16 detectors in total) were combined to obtain the final elastic intensity for a sample.
In situ XRD was carried out on a Bruker D8 diffractometer using a
two-electrode Swagelok-derived electrochemical cell with Ti3C2 films as working
electrodes and YP-50 carbon films as overcapacitive counter-electrodes.
Vacuum-filtered Ti3C2 film electrodes with consistent flake alignment (Supplementary
Fig. 1c) were used for in situ XRD measurements. The flake size (100–200 nm)
and the d-spacing (~10.6 Å) of the vacuum-filtered Ti3C2 (Supplementary
Fig. 4a) were the same as those of the macroporous Ti3C2 (Supplementary
Fig. 4b) used in the section ‘Distinct charging processes for different
solvent systems’. The CVs and Nyquist plots for the vacuum-filtered Ti3C2
electrodes in the different electrolytes are comparable to the results shown
for macroporous Ti3C2 and are discussed in detail in the supplementary
information (Supplementary Fig. 15). A beryllium window (allowing X-rays to easily penetrate) was used as the current collector for MXene electrodes. XRD (Cu Kα, λ = 0.154 nm) patterns were collected during cyclic voltammetry
measurements with a slow scan rate of 0.5 mV s−1 to ensure that enough patterns
were recorded as well as small potential evolution (≈0.2 V) for each pattern. For MXene electrodes in 1 M LiTFSI in PC and ACN solvents, only the (002) peak located between 6° and 10° was selected for XRD analysis, while in 1 M LiTFSI in DMSO the (004) peak located around 9.8° was selected for XRD study due to the difficulty of collecting the (002) peak around 5°. The XRD patterns of three full cycles were recorded for each electrolyte to demonstrate that the changes in the electrodes’ interlayer spacing are consistent from cycle to cycle.
Electrode preparation. The working electrode was prepared by pressing the
vacuum-filtered Ti3C2 thin film or the macroporous Ti3C2 onto a 316L
stainless-steel mesh (100 mesh screen) under 8 MPa. The mass loading of the
vacuum-filtered Ti3C2 thin film is 0.9 g cm−2, and the macroporous Ti3C2 has a mass loading
of either 0.75 or 1.5 g cm−2. The counter-electrode is YP-50 activated carbon with
5% polytetrafluoroethylene (Sigma-Aldrich) binder added. The YP-50 activated carbon was rolled into a free-standing film and cut into disc-shaped electrodes before being pressed onto a carbon-coated aluminium foil current collector. A
free-standing graphene–CNT film with a mass loading of 2.25 mg cm−2 was also pressed
onto the carbon-coated aluminium foil current collector and used as the positive electrode for a full cell. All electrodes were dried under vacuum for at least 12 h at 80 °C before use.
All cells were fabricated in a glovebox with controlled atmosphere of
O2 < 0.1 ppm and H2O < 0.1 ppm (Vacuum Technologies). For a three-electrode
cell, one working electrode and one overcapacitive counter-electrode were separated by two layers of Celgard, with a silver wire reference electrode in between the two layers of separators. For a two-electrode cell, one MXene electrode and one graphene–CNT electrode were separated by one layer of Celgard. After the electrolyte was added, the cell was clamped and packaged in a polyethylene terephthalate bag. Following assembly, all cells were stabilized overnight before the electrochemical tests.
Electrochemical tests. All electrochemical tests were performed on a Bio-Logic
VMP3 potentiostat. Before the electrochemical tests, all electrodes were precycled 20 times to stabilize the performance (Supplementary Fig. 2b–d). Chronoamperometry tests were performed by applying a constant voltage to the three-electrode cell. The current responding to different constant voltages
was recorded for 30 min. The CVs were tested with scan rates from 2 mV s−1 to
1,000 mV s−1, and a GCD test was performed at current densities from 0.5 to
100 A g−1. The impedance spectroscopy was tested in a range of 10 mHz to 200 kHz
under potential amplitude from OCV to the maximum applied voltage. Cycling
stability was tested with a scan rate of 100 mV s−1, and 60 s resting time was set
between each cycles. The floating test, with five GCD cycles at 1 A g−1 followed
by 2 h maximum potential holding, was repeated for 60 loops, recording the capacitance during GCD cycling and the current responding (or current leakage) in the floating period of each loop.
Calculations for the electrochemical tests. The capacitance of a single electrode
(Csp) was calculated from the anodic scan of the CV curve on the basis of
∫ = − C i t mV (F g ) d (1) sp 1
Here, i is the current changed by time t; m is the mass of a single electrode and
V is the voltage window of the CV scan. The volumetric capacitance of a single
electrode is calculated on the basis of Cv = Csp× material density.
As the GCD curve is nonlinear, the capacity (mAh g−1) of a single electrode,
instead of the capacitance, is evaluated using
Δ
= .
−
C(mAh g )1 3 6I tm (2)
where I is the constant current applied to the cell and Δt is the discharging time. For the two-electrode cell, the capacitance of the full cell was evaluated on the basis of the CV curve:
∫
=
−
Cg,full cell(F g )1 m Vi td (3)
total cell
where mtotal is the mass of active material on both electrodes and Vcell is the voltage
window of the full cell. The volumetric capacitance of the full cell is calculated on
the basis of Cv, full cell = Cg, full cell × (mass of the active materials on both electrodes/
volume of the active materials on both electrodes).
The energy density of the full cell was estimated on the basis of the anodic scan
of the CV (ECV) and discharge branch of the GCD curve (EGCD), and
∫
Δτ = E i Vd (4) V V CV 0 max ∫
= E Ic t Vd (5) V V GCD 0 maxwhere Δτ in equation (4) is the charge–discharge time determined by the sweep
rate35, and the I
c in equation (5) is the constant discharge current density. V0 to
Vmax is the voltage window of the full cell. The average power density was further
evaluated on the basis of P = E/ Δt.
MD simulations. MD simulations in a charged state in the presence of the
different electrolytes were performed using the in situ XRD measured interlayer separation in the charged state and the charge stored per gram of macroporous
Ti3C2. The charge contributed by the formation of the electrical double layer is
excluded from the MD simulation, as cation–anion exchange and anion desorption
may also contribute to the double-layer capacitance36,37.
To investigate the microscopic origins of the solvent dependence of MXene capacitance in LiTFSI solutions, we used classical non-reactive MD simulations in the NPT ensemble (that is, at constant temperature and pressure). The reference
surface composition was set to that of the previously analysed HF10 system38, with
a mixture of O, OH and F terminal groups, where the relative fraction of O/OH
groups was varied to compensate for the Li+ charges by deprotonation. The number
of intercalated Li ions (excluding electrical double-layer capacitance) was fixed at the experimentally determined values of 0.37, 0.46 and 0.93 cations per MXene
unit (Ti3C2(O, OH, F)2) for ACN, DMSO and PC solvents on macroporous Ti3C2,
respectively. The amount of solvent within the pores was adjusted to reproduce the experimentally found interlayer separation determined by XRD. The exact amount of solvent was adjusted by performing multiple simulations equilibrated at P = 1 bar and T = 298.15 K with different numbers of solvent molecules and choosing the one whose resulting equilibrium lattice constant agreed most closely with the experimental value.
The interactions between MXene atoms were described by an in-house force field optimized to reproduce pair distribution functions generated in density functional theory (DFT)-MD simulations, and tested against experimentally
measured structural properties of pristine MXenes38. The force-field functional
form consisted of the Lennard-Jones potential, point charges, harmonic bonds and harmonic angles, with parameters listed in Supplementary Tables 1–3. For the interactions of pure DMSO and ACN solvents and their interactions with Li ions, we used a force field previously adjusted to study lithium solvation in
a DMSO–ACN mixture, with parameters given in the original literature39. The
cross-interaction parameters of size (σij) and energy (εij) between MXene and the
electrolyte solution (Li ions and solvents) were determined using the Lorentz– Berthelot combining rules:
σij=σ σi+2 j;εij= ε εi j (6)
where σi(j) and εi(j) are the size and energy parameters of the Lennard-Jones
potential for atom i (or j), respectively. Long-ranged Coulombic interactions were calculated using the Ewald method. The simulations were performed under a constant pressure of 100 kPa and temperature of 298.15 K, with the integration time step of 1 fs. The simulation box contained 5,314 MXene atoms forming two
independent plates, while the numbers of Li ions and solvent molecules varied according to the system. For the PC-based system, we tried to introduce a trace amount of PC molecules into the interlayer space in the simulation. We observed a sudden expansion of the d-spacing calculated by MD simulation, similar to the ACN system. This further confirm that the Li ions confined between MXene layers must be fully desolvated when using the PC-based electrolyte.
Data availability
The data that support the plots within this paper and other findings of this study are available from the corresponding author upon reasonable request.
Received: 12 September 2018; Accepted: 25 January 2019; Published: xx xx xxxx
references
1. Simon, P. & Gogotsi, Y. Materials for electrochemical capacitors. Nat. Mater.
7, 845–854 (2008).
2. Simon, P., Gogotsi, Y. & Dunn, B. Where do batteries end and supercapacitors begin? Science 343, 1210–1211 (2014).
3. Salanne, M. et al. Efficient storage mechanisms for building better supercapacitors. Nat. Energy 1, 16070 (2016).
4. Lukatskaya, M. R., Dunn, B. & Gogotsi, Y. Multidimensional materials and device architectures for future hybrid energy storage. Nat. Commun. 7, 12647 (2016).
5. Nitta, N., Wu, F., Lee, J. T. & Yushin, G. Li-ion battery materials: present and future. Mater. Today 18, 252–264 (2015).
6. Zhu, Y. et al. Carbon-based supercapacitors produced by activation of graphene. Science 332, 1537–1541 (2011).
7. Zhong, C. et al. A review of electrolyte materials and compositions for electrochemical supercapacitors. Chem. Soc. Rev. 44, 7484–7539 (2015). 8. Mourad, E. et al. Biredox ionic liquids with solid-like redox density in the
liquid state for high-energy supercapacitors. Nat. Mater. 16, 446–453 (2017). 9. Choi, D., Blomgren, G. E. & Kumta, P. N. Fast and reversible surface redox
reaction in nanocrystalline vanadium nitride supercapacitors. Adv. Mater. 18, 1178–1182 (2006).
10. Wang, G., Zhang, L. & Zhang, J. A review of electrode materials for electrochemical supercapacitors. Chem. Soc. Rev. 41, 797–828 (2012). 11. Augustyn, V., Simon, P. & Dunn, B. Pseudocapacitive oxide materials for
high-rate electrochemical energy storage. Energy Environ. Sci. 7, 1597–1614 (2014).
12. Anasori, B., Lukatskaya, M. R. & Gogotsi, Y. 2D metal carbides and nitrides (MXenes) for energy storage. Nat. Rev. Mater. 2, 16098 (2017).
13. Lukatskaya, M. R. et al. Ultra-high-rate pseudocapacitive energy storage in two-dimensional transition metal carbides. Nat. Energy 2, 17105 (2017).
14. Lin, Z. et al. Capacitance of Ti3C2Tx MXene in ionic liquid electrolyte.
J. Power Sources 326, 575–579 (2016).
15. Dall’Agnese, Y., Rozier, P., Taberna, P.-L., Gogotsi, Y. & Simon, P. Capacitance of two-dimensional titanium carbide (MXene) and MXene/carbon nanotube composites in organic electrolytes. J. Power Sources 306, 510–515 (2016). 16. Kajiyama, S. et al. Enhanced Li-ion accessibility in MXene titanium carbide
by steric chloride termination. Adv. Energy Mater. 7, 1601873 (2017). 17. Wang, X. et al. Geometrically confined favourable ion packing for high
gravimetric capacitance in carbon–ionic liquid supercapacitors. Energy
Environ. Sci. 9, 232–239 (2016).
18. Chmiola, J. et al. Anomalous increase in carbon capacitance at pore sizes less than 1 nanometer. Science 313, 1760–1763 (2006).
19. Brouillette, D., Perron, G. & Desnoyers, J. E. Effect of viscosity and volume on the specific conductivity of lithium salts in solvent mixtures. Electrochim.
Acta 44, 4721–4742 (1999).
20. Gogotsi, Y. & Penner, R. M. Energy storage in nanomaterials—capacitive, pseudocapacitive, or battery-like? ACS Nano 12, 2081–2083 (2018). 21. Segalini, J., Daffos, B., Taberna, P.-L., Gogotsi, Y. & Simon, P. Qualitative
electrochemical impedance spectroscopy study of ion transport into sub-nanometer carbon pores in electrochemical double layer capacitor electrodes. Electrochim. Acta 55, 7489–7494 (2010).
22. Taberna, P., Simon, P. & Fauvarque, J.-F. Electrochemical characteristics and impedance spectroscopy studies of carbon–carbon supercapacitors.
J. Electrochem. Soc. 150, A292–A300 (2003).
23. Okubo, M., Sugahara, A., Kajiyama, S. & Yamada, A. MXene as a charge storage host. Acc. Chem. Res. 51, 591–599 (2018).
24. Cabana, J., Monconduit, L., Larcher, D. & Palacin, M. R. Beyond intercalation-based Li-ion batteries: the state of the art and challenges of electrode materials reacting through conversion reactions. Adv. Mater. 22, E170–E192 (2010).
25. Futamura, R. et al. Partial breaking of the Coulombic ordering of ionic liquids confined in carbon nanopores. Nat. Mater. 16, 1225 (2017).
26. Come, J. et al. Controlling the actuation properties of MXene paper electrodes upon cation intercalation. Nano Energy 17, 27–35 (2015). 27. Jäckel, N. et al. Electrochemical in situ tracking of volumetric changes in
two-dimensional metal carbides (MXenes) in ionic liquids. ACS Appl. Mater.
Interfaces 8, 32089–32093 (2016).
28. Levi, M. D. et al. Solving the capacitive paradox of 2D MXene using electrochemical quartz-crystal admittance and in situ electronic conductance measurements. Adv. Energy Mater. 5, 1400815 (2015).
29. Brousse, T., Bélanger, D. & Long, J. W. To be or not to be pseudocapacitive?
J. Electrochem. Soc. 162, A5185–A5189 (2015).
30. Ghidiu, M., Lukatskaya, M. R., Zhao, M.-Q., Gogotsi, Y. & Barsoum, M. W. Conductive two-dimensional titanium carbide ‘clay’ with high volumetric capacitance. Nature 516, 78–81 (2014).
31. Park, S. H., Kim, J., Lee, W.-E., Byun, D.-J. & Kim, M. H. One-step synthesis of hollow dimpled polystyrene microparticles by dispersion polymerization.
Langmuir 33, 2275–2282 (2017).
32. Alhabeb, M. et al. Guidelines for synthesis and processing of two-dimensional
titanium carbide (Ti3C2Tx MXene). Chem. Mater. 29, 7633–7644 (2017).
33. Li, K., Liu, J., Huang, Y., Bu, F. & Xu, Y. Integration of ultrathin graphene/ polyaniline composite nanosheets with a robust 3D graphene framework for highly flexible all-solid-state supercapacitors with superior energy density and exceptional cycling stability. J. Mater. Chem. A 5, 5466–5474 (2017). 34. Meyer, A., Dimeo, R., Gehring, P. & Neumann, D. The high-flux
backscattering spectrometer at the NIST Center for Neutron Research.
Rev. Sci. Instrum. 74, 2759–2777 (2003).
35. Mitchell, J. B., Lo, W. C., Genc, A., LeBeau, J. & Augustyn, V. Transition from battery to pseudocapacitor behavior via structural water in tungsten oxide.
Chem. Mater. 29, 3928–3937 (2017).
36. Forse, A. C., Merlet, C., Griffin, J. M. & Grey, C. P. New perspectives on the charging mechanisms of supercapacitors. J. Am. Chem. Soc. 138, 5731–5744 (2016).
37. Forse, A. C. et al. Direct observation of ion dynamics in supercapacitor electrodes using in situ diffusion NMR spectroscopy. Nat. Energy 2, 16216 (2017).
38. Wang, H.-W., Naguib, M., Page, K., Wesolowski, D. J. & Gogotsi, Y. Resolving
the structure of Ti3C2Tx MXenes through multilevel structural modeling of
the atomic pair distribution function. Chem. Mater. 28, 349–359 (2015). 39. Semino, R., Zaldívar, G., Calvo, E. J. & Laria, D. Lithium solvation in
dimethyl sulfoxide–acetonitrile mixtures. J. Chem. Phys. 141, 214509 (2014).
Acknowledgements
The research was sponsored by the Fluid Interface Reactions, Structures, and Transport (FIRST) Center, an Energy Frontier Research Center (EFRC) funded by the US Department of Energy, Office of Science, and Office of Basic Energy Sciences. Access to the HFBS was provided by the Center for High Resolution Neutron Scattering, a partnership between the NIST and the NSF under agreement no. DMR-1508249. Certain commercial equipment, instruments or materials are identified in this paper in order to specify the experimental procedure adequately. Such identification is not intended to imply recommendation or endorsement by the National Institute of Standards and Technology, nor is it intended to imply that the materials or equipment identified are necessarily the best available for the purpose. J. Li and H. Wang from Drexel University are acknowledged for helping with material characterization. Y. Honda and Y. Soda from Murata Manufacturing Co. are acknowledged for helpful discussions and help with the characterization.
Author contributions
X.W. and Y.G. planned the study. X.W., T.S.M, Z.L. and T.T. conducted electrochemical testing. K.L. synthesized all MXenes, Z.L. performed the in situ XRD measurement and L.V. performed the MD simulation. C.H., P.U. and A.S. performed TEM, XPS and Raman investigations, respectively. N.C.O., M.T. and E.M. performed the neutron scattering. All authors contributed to writing the manuscript under supervision from P.S. and Y.G.
Competing interests
The authors declare no competing interests.
Additional information
Supplementary information is available for this paper at https://doi.org/10.1038/
s41560-019-0339-9.
Reprints and permissions information is available at www.nature.com/reprints.
Correspondence and requests for materials should be addressed to Y.G.
Publisher’s note: Springer Nature remains neutral with regard to jurisdictional claims in
published maps and institutional affiliations.