To cite this version : Zarati, Khaled and Duplaa, Sébastien and
Carbonneau, Xavier and Tantot, Nicolas
Engine performance and
surge margins optimization by means of nozzles variability
. 2015
In: 22nd ISABE Conference, 25 October 2015 - 30 October 2015
(October 25 - 30, 2015 Phoenix, USA, United States).
O
pen
A
rchive
T
OULOUSE
A
rchive
O
uverte (
OATAO
)
OATAO is an open access repository that collects the work of Toulouse researchers and
makes it freely available over the web where possible.
This is an author-deposited version published in :
http://oatao.univ-toulouse.fr/
Eprints ID : 13950
Any correspondance concerning this service should be sent to the repository
administrator:
[email protected]
Engine performance and surge margins optimization by means of nozzles variability
Khaled Zarati*, Sébastien Duplaa, Xavier Carbonneau, ISAE, Université de Toulouse Nicolas Tantot, SAFRAN-SNECMA
* Presently at SafranTech
1 Abstract
Overall trends for next generation aero-engines are oriented to more efficient architectures to ensure a reduction in fuel consumption and an improvement in expected ranges, emissions levels and operability. Engine manufacturers have investigated different ways to improve engine performance, for instance by using new materials, technologies or integration methods. Engine performance can also be improved though changes in thermodynamic cycle by means of variable cycle devices capable of better adapting it to flight conditions. Due to current design constraints, engines are optimized to best average performance for a specific mission type, yet not for all the operating points encountered throughout the missions. By adding a degree of freedom, the cycle can be further optimized during the entire mission potentially leading to additional fuel savings.
This paper presents an analysis of the impact of variable fan and core nozzle areas on the performance of a long range turbofan through a long range mission. By moving the operating points, these devices have a strong effect on engine operations and therefore on the Specific Fuel Consumption. Variations in Specific Fuel Consumption are evaluated as well as compressors surge margins, considered as important performance and operability parameters, throughout the same 14hours long range mission and for range of +/- 15% for the fan nozzle area and +/- 20% for the core nozzle area.
This study shows that optimization of the fan nozzle area on each mission point for minimum SFC can lead to fuel savings of up to 20kg (44lb) representing 0.05% of improvement. However, maximizing the surge margin by optimizing the variable fan nozzle permits an increase of up to 7% depending on the considered compressor. On the other hand, optimization of the core nozzle area on each mission point for minimum specific fuel consumption allows a reduction of 127kg (282lb) in fuel consumption, representing an improvement of 0.34% while having different effects on the engine compressors surge margins. Using the core area to maximize the surge margin provides an increase of up to 2% depending on the considered compressor with a side effect on specific fuel consumption. At this stage, the results from this study suggest that the amount of fuel savings obtained through the use of variable fan nozzle and variable core nozzle may not be sufficient to overcome the associated constraints such as added weight and integration aspects. However, a broader optimization
approach, involving all the design aspects and parameters could lead to different quantitative conclusions.
2 Nomenclature
A19: Fan nozzle area A9: Core nozzle area
BPR: Bypass ratio. Ratio of secondary mass flow to primary (core) mass flow
DP: Design point
HPC: High pressure compressor
IPC: Intermediate pressure compressor LPC: Low pressure compressor
LRTF: Long Range Turbofan OD: Off-design
SFC: Specific Fuel Consumption. Ratio of fuel flow by net thrust
SM: Surge margin
TRL: Technology Readiness Level Tt4: Combustor exit total temperature
Tt41: High pressure turbine inlet total temperature VCN: Variable Core Nozzle
VFN: Variable Fan Nozzle
3 Introduction
One of the main objectives of the joint efforts between airlines, aircraft manufacturers and engine manufacturers is to create new breakthrough aircraft with a real technology gap ensuring better performance and addressing the increasingly demanding safety and environmental constraints.
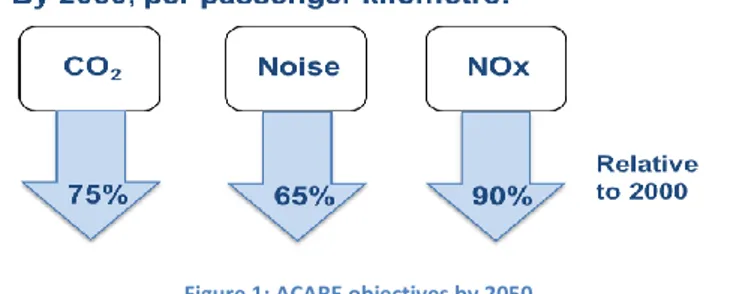
In order to consolidate and organize this common view, engine manufacturers, as major contributors in defining the future of aeronautics, have launched many cooperative European funded projects such as CLEANSKY, NEWAC, LEMCOTEC, E-BREAK and more recently ENOVAL, and have identified the need for more efficient engines and consequently investigated a large scope of promising engine concepts at the component and system levels. The objectives from this significant investment were clearly established by both the research and air traffic aeronautic associations. ACARE objectives by 2050 are presented below:
Figure 1: ACARE objectives by 2050
One can notice that two main goals, the CO2 and NOx
emission reductions, are directly linked to fuel consumption along with the combustion and combustor improvements. Furthermore, recurring fluctuations in fuel prices having an important economic impact on aviation constitute an additional argument for considering reduction in fuel consumption as a main research objective for the next generation of engines.
The fuel consumption is a global efficiency indicator for a specific mission; its reduction is a direct consequence of thermodynamic cycle improvements, originating either from component, system or integration enhancements. The engine cycles at the different operating points are fixed by the initial architecture design, itself constrained by mechanical, safety and integration aspects. Therefore, engineers are currently bound to look for a compromise over the complete engine flight envelop, to have the best performance and abide by the operating limitations. Variable cycle devices could allow active adaptation of the engine thermodynamic cycle over the mission, by adding one or more degrees of freedom. Many variable cycle devices have been identified in the past, some of them are already integrated in civil or more commonly in military engines. This paper deals with two specific devices, the variable fan nozzle area and the variable core nozzle area. The main purpose of our investigations is to evaluate this impact throughout a whole mission in terms of fuel consumption (or SFC since the thrust is set) and surge margins (as an important safety and operability indicator). It is important to mention that the aforementioned two variabilities will be independently studied.
The impacts of the variabilities on engine performance were studied on a Turbofan modelled with our simulation software, over a long range mission selected as our reference frame. The definitions of the models, the assumptions, limitations and the results are detailed in the next sections.
The studies presented in this paper have been performed within the frame of the Sub-Project 1, workpackage 1.2 of the FP7 EU-funded Level 2 E-BREAK project.
4 Presentation of PROOSIS software
PROOSIS is an object-oriented simulation software used to compute the performance of a large scope of complete or partial propulsion systems. It was developed under the VIVACE project (VI Framework Programme of the EU) and enhanced during the CRESCENDO project (VII Framework
Programme of the EU) for an industrial entry in service in 2008.
PROOSIS is based on libraries containing the components and models which are classified by thematic: mathematical equations defined in the Math library, Turbo library contains the basic components for a classic propulsion system (compressors, turbines, shafts, combustor, ports) and other more complex libraries containing special components such as electrical ones or complete powerplant architectures (Turbofans, Turboshafts) and specific methods (optimization or sensitivity for example). At component level, the models are coded in C++ from a basic representation of the element to a more complex one by taking into consideration many thermodynamic and operability effects. Depending on the studies, we should select the appropriate component. If a modification is made at a certain level, all the component “versions” that inherit from this level benefit from this modification. To create these components, thermodynamic and mechanical models are used to describe their operations and behaviors. Different effects are taken into consideration in a PROOSIS specific way such as the heat exchange and the cooling flows.
These components are associated in a schematic to create a whole architecture (two shafts turbofan for example) or a part of it (HP core, power shaft…). Once this schematic is compiled and the physical model defined and validated (selection of boundaries which depend on the architecture and the degrees of freedom, selection of the algebraic to perform the loops of calculations…), different studies can be done to create and evaluate the engine performance: design studies define the architecture, steady studies evaluate the performance and transient calculations explore the dynamic aspects.
Results are obtained by resolving steady or transient calculations using system resolving algorithms.
5 Presentation of the architecture and the variabilities
5.1 Choice of the architecture
A Three Shaft Long Range Direct Drive Turbofan architecture was selected to study the variabilities. This choice was motivated by the nature of the mission for this kind of engine. In fact, a long range mission is characterized by many different flight conditions (Mach number, altitudes, temperatures and pressures) which give more opportunities to the considered variability to be adjusted and to the cycle to be adapted, than a short/medium range mission. Additionally, the thrust and energy developed by this engine are very important, and the impact of the variabilities on the performance is expected to be noticeable for all the flight phases. For all these reasons, the three shaft long range direct drive Turbofan defined and described by engine manufacturers in E-BREAK workpackage 1.1 was selected as the baseline architecture for the study of variabilities.
Figure 2: Rolls-Royce Trent 1000 three shaft turbofan (Credit: Rolls-Royce plc)
Figure 2 shows a cutaway of a three shafts turbofan. The HP spool in red, IP spool in yellow and LP spool in blue have different rotational speed in order to optimize the airflow conditions at design and off-design and improve the operability and the overall performance of the engine. The additional intermediate pressure compressor is mounted on a separate shaft, running concentrically with the LP and HP shafts, and is driven by a separate IP turbine.
5.2 Variabilities and variable cycle devices
Regarding the variable cycle devices, many technologies have been identified as impacting the engine cycle and considered as an eventual tool to control its optimization. This paper describes two important variable cycle devices studied separately, the variable fan nozzle area and the
variable core nozzle area.
One important feature of these variabilities is their high TRL. In fact, the integration of the devices ensuring the variation of nozzle section can be seen as an accessible technology in a near future. The theoretical explanations of the impact of variable nozzle areas on cycles and performance are detailed in [1]. The purpose from this paper is not to demonstrate this impact and explain the phenomenon behind it but to present results of investigation of some configurations using variable fan and core nozzle areas.
6 Creation of the baseline architecture
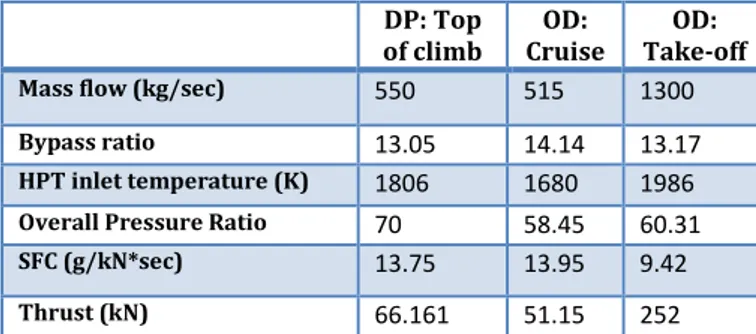
The engine manufacturer provided a description of the architecture in order to model it with the simulation software PROOSIS. Three points were considered to define the engine, one design point and two off-design points. Table1 describes the performance of the considered turbofan to have an idea about some parameter ranges.
DP: Top
of climb Cruise OD: Take-off OD:
Mass flow (kg/sec) 550 515 1300 Bypass ratio 13.05 14.14 13.17 HPT inlet temperature (K) 1806 1680 1986
Overall Pressure Ratio 70 58.45 60.31 SFC (g/kN*sec) 13.75 13.95 9.42 Thrust (kN) 66.161 51.15 252
Tableau 1: LRTF specification at design and off-design points
The first step in creating the powerplant architecture in PROOSIS consists in setting up a component assembly of the target architecture based on the available PROOSIS individual modules, called ‘schematic’.
It is important to note that a schematic does not represent a physical model or a calculation model. It describes the engine modular arrangement, and the functional links between components. Consequently one can imagine many studies with different driving parameters based on the same schematic.
Indeed, for a given architecture, different numerical models called ‘partitions’ can be used by varying the boundary variables. For the studies described in this paper, the thrust was considered as a boundary as it represents along with flight conditions the essential and imposed variables for the operations of the aircraft.
Finally, experiments and calculations are based on the defined partition. The values of the driving parameter in the present PROOSIS model, thrust, are specified in the different cases of simulations. However, a specific calculation is worth to be mentioned specifically in this paragraph: the design calculation. This calculation designs the engine geometries, performance map scaling factors and some pressure losses parameters to create the final engine model. Once the model is completely defined, the design values are used to describe the engine behavior and deduce the off-design performance.
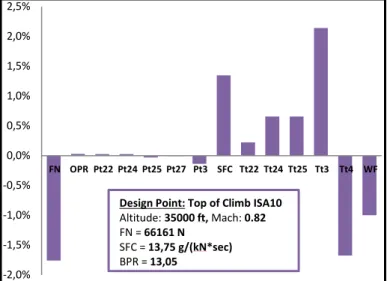
Due to some limitations of the model described in the next paragraphs, differences between computed performance at the three points and the original engine manufacturer data are observed. During design process, we tried, through the choice of design data and through loops of calculations, to find the best compromise between design and off-design performance in order to minimize the errors due to modelling assumptions. Hereafter the results of engine design relatively to the motorist inputs:
Figure 3: DP Top Of Climb performance relative to specifications
Figure 4: OD Cruise performance relative to specifications
Figure 5: OD Take-Off performance relative to specifications
7 Limitations of the model
Many limitations were identified during the creation of the model. They are due to a lack of information, mainly for confidentiality reasons, but also for physical representations of some phenomenon and hypotheses made on the component and the overall model. The main limitations are listed below.
- Secondary air system: the scheme as well as the values. It has an important impact on performance and especially on the fuel consumption.
- Pressure losses: in different stations of the engine, the pressure losses are set and impact the engine behavior at design but also at off-design.
- Performance maps of the compressors and turbines: this is the most important limitation as the performance at off-design are strongly linked to the maps. PROOSIS proposes generic maps which are scaled during the design calculation to match the overall engine design targets. Therefore, uncertainties introduced from the maps are both linked to the shape of the generic maps considered, and to the scaling process enforced. It is important to point out that the design process was considered in a multi-point approach. We remarked that, with the available performance maps and data, a good matching of design point calculation with engine manufacturer data (small errors to reference) gave poor off-design performance. For this reason, we looked for a compromise between all the operating points defining the engine. This leads to a necessary adaptation of the design point performance in order to improve the off-design behavior.
8 Description of the studies
The main purpose of the studies described in this paper is to evaluate the qualitative and quantitative impact of variable fan and core nozzle areas on the performance of the engine and particularly the fuel consumption and the surge margins for all the compressors.
Different studies were performed on this mission and are briefly described below:
- Demonstrate that the initial designed engine has the best performance throughout the mission for a classic turbofan: this verification shows that the reference engine, designed by the engine manufacturer, has, as expected, the best performance for a fixed cycle and geometry architecture in terms of fuel consumption. Consequently, it also proves that the eventual performance improvement would come from the cycle variabilities.
- Create a PROOSIS calculation to optimize the fan nozzle area, on each operating point, in order to have the minimum specific fuel consumption. As the thrust is imposed for the mission, this optimization is equivalent to a minimum fuel consumption optimization. Using these fan nozzle areas, we calculate the surge margins of each compressor to represent the surge margins for minimum fuel consumption configurations. - Create a PROOSIS code that optimizes the fan
nozzle area to maximize the surge margin for each compressor throughout the mission. We then calculate the resulting SFC and fuel consumption
-2,0% -1,5% -1,0% -0,5% 0,0% 0,5% 1,0% 1,5% 2,0% 2,5% FN OPR Pt22 Pt24 Pt25 Pt27 Pt3 SFC Tt22 Tt24 Tt25 Tt3 Tt4 WF
Design Point: Top of Climb ISA10
Altitude: 35000 ft, Mach: 0.82 FN = 66161 N SFC = 13,75 g/(kN*sec) BPR = 13,05 -2,5% -1,5% -0,5% 0,5% 1,5% 2,5% 3,5% -11% -9% -7% -5% -3% -1% 1% 3% 5% 7%
from these configurations to compare it to the previously described studies.
- Perform crossed representations of the results by plotting:
The minimum SFC versus the SFC of the reference engine versus the SFC of maximum surge margin configuration for each compressor. The purpose is to evaluate the maximum gain in SFC relatively to the reference as well as the cost in terms of fuel consumption of a maximization of surge margins for each compressor.
The maximum surge margins versus the reference surge margins versus the surge margin for minimum fuel consumption. The purpose here is to quantify the possible gain in surge margins and the impact of minimizing SFC in surge margins. We can also see the compressors different behavior regarding surge margins.
- For all these studies, core nozzle area is kept constant at its reference value. The same studies were then performed for a variable core nozzle area and a constant fan one.
Figure 6: Long range mission profile
Figure 6 shows the mission considered for all the studies described in this paper. A 13.6 hours long range mission is described by 261 operating points specifying the altitude, Mach number, outer air temperature, thrust and duration of each step. The last phases of descent and landing were not considered to avoid problems of simulation and convergence of the calculations with the engine running at idle condition, showing poor numerical robustness in such a preliminary design thermodynamical model (These two phases last 30 minutes, the initial mission duration was 14.1 hours).
9 Results from simulations 9.1 Fan bypass nozzle
9.1.1 Optimization of the SFC
Figure 7: Cumulated fuel consumption with constant fan nozzle area
As mentioned before, we first wanted to demonstrate that for the long range mission and with fixed geometry and consequently fixed cycle engines, the best performance in terms of fuel consumption is obtained with the reference engine (as it was designed with fixed nozzle areas) which will be used as baseline for further comparison. To do so, we calculated the fuel consumption of the LRTF throughout the mission under different configurations: the only thing that differentiates two configurations is the fan nozzle area. For a given configuration, this nozzle area is kept constant throughout the mission. Figure 7 shows the cumulated fuel consumption in kg for the last part of the mission for the different considered configurations (nozzle areas are represented in percentage of design). The red line represents the total fuel consumption obtained from the reference engine. This confirms that out of all the investigated configurations the initial engine design has the best performance in terms of fuel consumption for the whole mission so any eventual improvement can come only from the variabilities and not from further optimization of the design of fixed geometry engine.
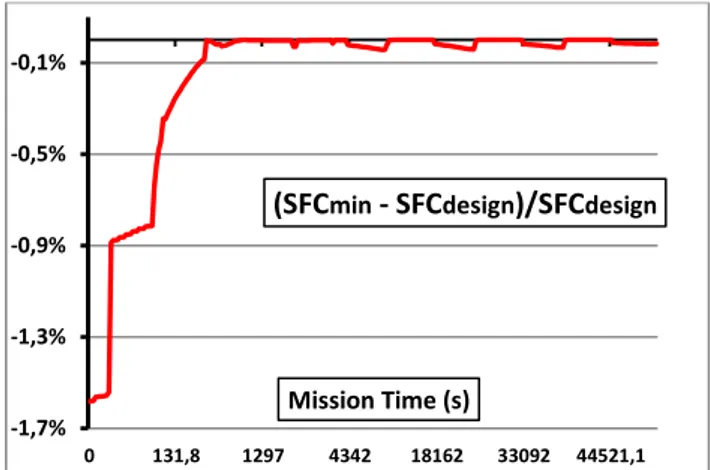
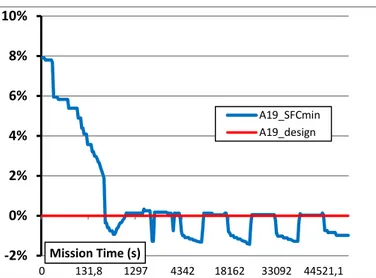
Figure 8: SFC optimization with fan nozzle area
Figure 8 shows the relative difference between the minimum SFC obtained by optimizing the fan nozzle area, and the reference SFC by. A specific PROOSIS code was developed to calculate, in each operating point of the
34000 36000 38000 40000 44015 44102 44228 45988,1 48467,1 Mission Time (s) -10% -8% -5% -3% 0% 3% 5% 8% 10% -1,7% -1,3% -0,9% -0,5% -0,1% 0 131,8 1297 4342 18162 33092 44521,1 Mission Time (s)
mission, the fan nozzle area that gives the minimum SFC for an imposed thrust. This SFC was compared to the reference one. The core nozzle area was kept constant for both studies.
We remark that the most important gain in SFC is obtained at take-off and that it is reduced with the climb. During the cruise, a small gain is observed during the climbing phases to change flight level.
These observations can be explained by the fact that the current engine was designed at top of climb so a certain fuel save was expecting at the “most different” operating conditions relatively to design in terms of altitude, Mach number, and required thrust. Take-off conditions represent the operating point for which the engine design has not been specifically optimized. The same reasons can be evocated for the climbing phases at cruise where the Mach number is reduced and the reached altitude is different from the design one, in case where altitude and Mach have an impact on performance.
Figure 9: Fan nozzle area optimization for minimum SFC
The previous results can be analyzed along with the variation of the optimized fan nozzle area for minimum fuel consumption. Figure 9 shows the relative difference between the optimized fan nozzle area and the fan design nozzle area.
Optimized fan nozzle area variation is qualitatively identical to the SFC variation with a maximum difference at take-off and a gradual reduction of these differences. At top of climb, design point, this difference is almost equal to zero. Therefore, as for SFC, -1% variation should be considered during the flight level changes to get the best SFC.
9.1.2 Surge margin optimization and studies comparison
In this section, emphasis is put on the surge margins of the four compressors. Three configurations related to the fan nozzle area were identified:
- The reference fan nozzle area.
- The optimized fan nozzle area for minimum fuel consumption.
- The optimized fan nozzle area for maximum surge margin for a certain compressor.
The following figures compare the surge margins assessed for each previously mentioned configuration and for each compressor (fan hub, fan bypass, IP compressor and HP compressor). All the surge margins are calculated at constant mass flow. The fan nozzle areas maximizing the surge margin for each compressor are presented in the next paragraph.
Figure 10: Fan Hub surge margin variations
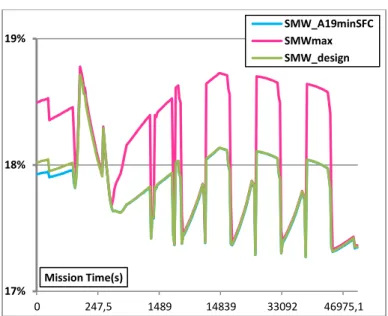
Figure 11: Fan Bypass surge margin variations
The analysis of the results for the fan hub shows that the reference surge margin is almost equal to the surge margin for minimum fuel consumption. If we optimize the fan nozzle area to maximize this surge margin, the maximum gain is of 1.5% to 2% for the whole mission.
These tendencies are different for the fan bypass with a maximum possible gain of 6.5% at take-off relatively to reference and 1.5% relatively to the minimum SFC configuration. During the cruise phases, this gain reaches an average of 6%. -2% 0% 2% 4% 6% 8% 10% 0 131,8 1297 4342 18162 33092 44521,1 Mission Time (s) A19_SFCmin A19_design 2% 4% 6% 8% 10% 12% 0 247,5 1489 14839 33092 46975,1 Mission Time(s) SMW_A19minSFC SMWmax SMW_design 10% 15% 20% 25% 0 247,5 1489 14839 33092 46975,1 Mission Time(s) SMW_A19minSFC SMWmax SMW_design
Figure 12: IP Compressor surge margin variations
Figure 13: HP compressor surge margin variations
Regarding the intermediate pressure compressor, the surge margins for the three configurations are almost the same for the take-off and climb. However, at cruise conditions the maximum surge margin configuration shows a 2% benefit over the reference and minimum-SFC-configuration surge margins.
For high pressure compressor surge margin variations, a similar behavior can be observed, the maximum surge margin benefit being reduced to +0.5%. In a different optic than maximizing the surge margin, the impact of these configurations on the SFC was studied. The fan nozzle areas that maximize the surge margin are used to calculate the SFC, which is then compared to the minimum and the reference SFC (original design without variability): the purpose is to evaluate the losses in terms of fuel consumption, relatively to reference and to the minimum consumed, if the surge margin of each compressor is maximized (in separate studies).
Figure 14: SFC variation for maximum Fan Hub SM relative to reference and minimum
The green line shows the difference between the SFC for maximum surge margin and the minimum SFC. The red line shows the difference between the SFC for maximum surge margin and the reference SFC. One can see that maximizing the surge margin of the fan hub has an important impact on SFC with more than 2% of losses at cruise.
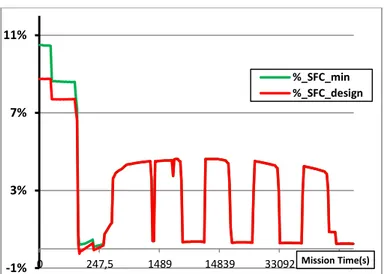
Figure 15: SFC variation for maximum Fan Bypass SM relative to reference and minimum
Regarding the fan bypass, an important remark can be done. At take-off conditions, the SFC for maximum surge margin is lower than the reference SFC. Moreover, this SFC is equal to the minimum. The red line indicates -1.7%, the green line is at 0%. This means that at this point, we can maximize the surge margin and at the same time minimize the fuel consumption which is of maximum interest for the engine operation, even if the take-off phase fuel burn share in the overall mission remains modest. At cruise conditions, the SFC increase are however more important, from 4% to 6%. 11% 13% 15% 17% 0 247,5 1489 14839 33092 46975,1 Mission Time(s) SMW_A19minSFC SMWmax SMW_design 17% 18% 19% 0 247,5 1489 14839 33092 46975,1 Mission Time(s) SMW_A19minSFC SMWmax SMW_design 0% 2% 4% 6% 8% 10% 12% 0 247,5 1489 14839 33092 46975,1 Mission Time(s) %_SFC_min %_SFC_design -2% 0% 2% 4% 6% 8% 10% 0 247,5 1489 14839 33092 46975,1 Mission Time(s) %_SFC_min %_SFC_design
Figure 16: SFC variation for maximum IPC SM relative to reference and minimum
Figure 17: SFC variation for maximum HPC SM relative to reference and minimum
The intermediate pressure compressor shows the same phenomena at take-off as for the fan bypass, namely a possibility for increasing the surge margin and at the same time reducing the fuel consumption.
The impact of maximizing the surge margin of the high pressure compressor is negative regarding SFC for the whole mission: from +9% to +10.8% at take-off and from +0.2% to +4% at cruise.
Important remarks must be pointed out after the previous analysis:
- The optimizations for minimum SFC and maximum surge margins and the calculation of the corresponding fan nozzle areas were done without any constraints on the other engine parameters (no constraints imposed on temperatures, no mechanical or aerodynamic limitations considered at this stage…)
- One important consequence can be mentioned from the previous remarks: the results in terms of maximizing surge margin for one compressor are obtained for specific fan nozzle areas, which are different and can be opposite to the fan nozzle areas maximizing the surge margin for another
compressor. In other words, the positive results observed for one compressor must be put into perspective as the considered fan nozzle area for these positive performance may not suit the operations of other compressors or overall performance. Hereafter, the fan nozzle areas ensuring the maximum surge margin for each compressor:
Figure 18: A19 for maximum surge margin on each compressor Opposite variations can be seen on figure18 which imposes the look for a compromise between the nozzle areas to satisfy the performance requirements and specification as well as the operability constraints.
To conclude, In terms of quantity, the saved fuel flow is of 20kg (44lb) for the mission representing a negligible improvement of 0.05% relatively to the reference consumption. Evaluating interest from a variable fan nozzle by just analyzing the fuel gain cannot be seen from these studies and assuming these hypotheses, especially as we neither consider the weight of the variable devices on the one hand, nor the indirect improvement that could be obtained from this technology by redesigning compressors to a set surge margin target, on the other hand. -5% 5% 15% 25% 35% 0 247,5 1489 14839 33092Mission Time(s) 46975,1 %_SFC_min %_SFC_design -1% 3% 7% 11% 0 247,5 1489 14839 33092 Mission Time(s) 46975,1 %_SFC_min %_SFC_design -12% -8% -4% 0% 4% 8% 12% 0 247,5 1489 14839 33092 46975,1 Mission Time(s) A19_maxSMW_FanHub A19_design A19_maxSMW_FanBypass A19_maxSMW_CmpI A19_maxSMW_CmpH
9.2 Core nozzle area
9.2.1 Optimization of the SFC
Figure 19: minimum SFC and fuel consumption relative to reference
Figure 19 shows the variation of the cumulated fuel consumption and SFC relatively to the design. The improvement in fuel save is more important than for the fan nozzle area with a different repartition of variation: less improvement at take-off but higher gain for the other longer flight phases. 0.34% fuel saving is obtained using a variable core nozzle area for a total amount of 127kg (282lb).
Figure 20: Core nozzle area for minimum SFC relative to reference
The figure 20 shows the optimized core nozzle area for minimum SFC. For all the simulated mission points, the core nozzle area is different from the design one. Knowing that the fan nozzle area for these studies is kept equal to design, we can conclude that the design value of core nozzle area of the reference engine is not optimized for minimum fuel consumption. Other constraints may have imposed the choice of this section area for reference engine, such as acoustics.
9.2.2 Surge margin optimization and studies comparison
Figure 21: Fan Hub surge margin variations
The figure 21 compares the fan hub surge margins at constant mass flow for different configurations: maximum versus reference versus minimum-SFC configuration surge margins. The differences between the three configurations are low, in an envelope of 1%. However, it can be noticed that minimizing the SFC increases at the same time the surge margin for the fan hub.
Figure 22: Fan Bypass surge margin variations
Same comments can be done for the fan bypass as the three curves are superimposed. The total gain is contained in less than 1% with an increase in surge margin relatively to reference if the SFC is minimized.
-0,5% -0,4% -0,3% -0,2% -0,1% 0,0% 1,1 259,8 1499 14852 33754 47223,1 Mission Time (s) Wmin-Wref SFCmin-SFCref -25% -20% -15% -10% -5% 0% 1,1 259,8 1499 14852 33754 47223,1 Mission Time (s) 4% 6% 8% 10% 1,1 259,8 1499 14852 33754 47223,1 Mission Time (s) SMW_A9_(SFC_min) SMW_design SMW_maximum 13% 14% 15% 16% 17% 18% 19% 1,1 259,8 1499 14852 33754 47223,1 Mission Time (s) SMW_A9_(SFC_min) SMW_design SMW_maximum
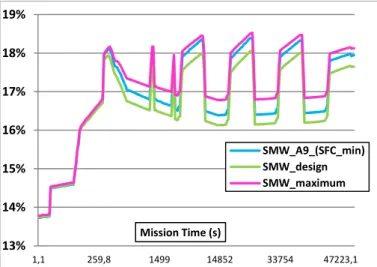
Figure 23: IPC surge margin variations
Figure 24: HPC surge margin variations
Intermediate pressure compressor surge margin variations show the same tendency for the whole mission with a gain of 1.5% when minimizing the SFC relatively to design. Almost 2% of surge margin increase can be obtained by optimizing the core nozzle area during the mission.
The variation of high pressure compressor surge margin is less important than the intermediate pressure one and ends up between +0.7% and + 1%. However, no general conclusions can be deduced for the law of variation as minimum-SFC-configuration and reference one have various behaviors.
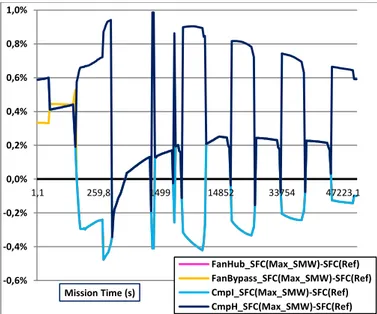
Figure 25: SFC for maximum SM relative to SFC reference for all compressors
Previous analysis demonstrates that the surge margin of the compressors can be improved by modifying the core nozzle area. This improves the operability of the engine but has a cost in terms of fuel consumption. As for the fan nozzle area, we quantified the impact on SFC of increasing the surge margin by comparing the SFC at max surge margin to SFC of the reference engine. Figure 25 shows the differences in SFC between the max surge margin configuration for each compressor and the reference one. The variations are almost the same for the fan hub, fan bypass and intermediate compressor. For all compressors, some phases of increase of fuel consumption are observed along with other phases of improvement of SFC. In other words, maximizing the surge margins by a mean of variable core nozzle area during some mission phases improves the SFC, keeping the same design fan nozzle area as the reference.
In terms of quantity, the saved fuel flow is equal to 128kg (282lb) for the mission representing 0.34% improvement relatively to the reference consumption.
10 Conclusion
This paper described the investigation of variable fan and core nozzle areas considered separately on a long range Turbofan. The goal was to study the impact on performance of these variable cycle devices and to evaluate their interest.
A number of operating parameters were investigated in these studies; the focus was made on fuel consumption, surge margin and their relationship. A positive impact has been observed on fuel consumption with a fuel saving of 20kg (44lb) representing 0.05% improvement for the fan nozzle area optimization and a quantity of fuel saved equal to 127kg (282lb) representing 0.34% reduction with a core nozzle area optimization. These modest fuel savings should be put in perspective with the additional weight associated with the variable nozzle actuation system, as well as the indirect negative snowball effects of integrating such
11% 12% 13% 14% 15% 16% 17% 18% 1,1 259,8 1499 14852 33754 47223,1 Mission Time (s) SMW_A9_(SFC_min) SMW_design SMW_maximum 17% 18% 19% 20% 1,1 259,8 1499 14852 33754 47223,1 Mission Time (s) SMW_A9_(SFC_min) SMW_design SMW_maximum -0,6% -0,4% -0,2% 0,0% 0,2% 0,4% 0,6% 0,8% 1,0% 1,1 259,8 1499 14852 33754 47223,1 Mission Time (s) FanHub_SFC(Max_SMW)-SFC(Ref) FanBypass_SFC(Max_SMW)-SFC(Ref) CmpI_SFC(Max_SMW)-SFC(Ref) CmpH_SFC(Max_SMW)-SFC(Ref)
feature in the overall powerplant control and command system. Considering all these aspects, the variable fan and core nozzle area concepts did not turn out to be relevant for minimizing fuel consumption at overall powerplant level. However, promising impacts on compressors operability through surge margins improvements in specific operating conditions have been identified, opening the path for taking a closer look into these devices during the engine design phase, where positive side-effects on other engine subsystems can arise.
More precisely:
- Adapting the nozzle areas has a significant impact on the surge margin of each compressor. Such an option can replace some control system features like flow discharge for preventing surge. The eventual mass reduction obtained by removal of the discharge valves should be taken into account in the design iteration loops.
- This study also shows that, at constant thrust, the nozzle area variation has a significant impact on the engine temperatures. More precisely, the combustor exit temperature Tt4 and the high pressure turbine inlet temperature Tt41 decrease by up to 50K. An adaptation of the secondary air system flowrates to these lower temperatures could then be imagined by reducing the flow re-injected at these stations. This cooling flow reduction has a direct impact on engine performance manifested through a reduction in SFC.
- It is also important to keep in mind that the nozzle variability study was applied to an engine that was initially designed without any variability (i.e. fixed cycle, fixed geometry). The nozzle variability was assessed at off-design conditions only with a small
impact at engine design point. Considering these supplementary degrees of freedom right from the cycle design phase would have, most likely, led to an improved engine performance at design point as well as at off-design conditions.
Preliminary investigations were performed aiming at redesigning the engine with the variabilities while keeping the same limits of operability and imposed thrust. These studies resulted in confirming the benefit of considering the variable devices right from the initial engine design phase. - Another outcome of the redesign study is the fact
that the gain introduced by such technologies depends on the engine characteristics and design cycles. The impact of variable cycle devices on engine performance varies with BPR, mass flow, cycle temperatures of the engine considered. In fact, future Ultra High Bypass Ratio turbofans will probably need to integrate variable fan nozzle area in order to be able to develop the best performance and meet the operability, the safety and the acoustic limitations for the entire flight envelope. Indeed, the acoustic signature reduction can justify the use of variable cycle devices mainly for the fan nozzle area. Changes in fan nozzle area have a direct impact on the exit total pressure and Mach, which, in turn, control the global engine acoustic signature. Reference [2] offers more details on this topic.
As a corollary to the above mentioned points, it can be ascertained that more detailed studies for specific turbofans (e.g. higher BPR turbofans), can be of real interest. For enhanced representativity, the simulations will need to integrate the following aspects: cooling adaptation, operability, variable cycle devices mass characteristics, acoustics, design cycles, health monitoring, etc.
11 Reference
[1] U. Michel, "The benefits of variable area fan nozzles on turbofan engines," 49th
Aerospace Sciences Meeting
including the New Horizons Forum and Aerospace Exposition, p. 17, 2011.
[2] R. P. Woodward, C. E. Hughes and G. G. Podboy, "Aeroacoustic analysis of fan noise reduction with increased
bypass nozzle area," In 11
th Aeroacoustics Conference (26 th Aeroacoustics Conference), p. 27, 2005,
July.
12 Acknowledgment
The studies described in this paper were performed for the four year project E-BREAK funded by the Seventh Framework Program of the European Commission under grant agreement n° 314366. The authors want to express their gratitude to the European Commission for this financial support.