OATAO is an open access repository that collects the work of Toulouse
researchers and makes it freely available over the web where possible
Any correspondence concerning this service should be sent
to the repository administrator:
[email protected]
This is an author’s version published in:
http://oatao.univ-toulouse.fr/25135
To cite this version:
Giacinti, Géraldine
and Raynaud, Christine
and Capblancq, Sophie
and
Simon, Valérie
Evaluation and prevention of the negative matrix effect of
terpenoids on pesticides in apples quantification by gas chromatography–
tandem mass spectrometry. (2017) Journal of Chromatography A, 1483. 8-19.
ISSN 0021-9673
Evaluation and prevention of the negative matrix effect of terpenoids
on pesticides in apples quantification by gas
chromatography-tandem mass spectrometry
Géraldine Giacinti
*
, Christine Raynaud, Sophie Capblancq, Valérie Simon
Laboratoire de Chimie Agro-industrielle (LCA), Université de Toulouse, INRA, INPT, Toulouse, France
ARTICLE INFO Keywords: Apples Pesticides Oleanolic acid Matrix effect GC/MS2 HPil.C 1. Introduction ABSTRACT
The sample matrix can enhance the gas chromatography signal of pesticide residues relative to that obtained with the same concentration of pesticide in solvent. This paper is related to negative matrix effects observed in coupled gas chromatography-mass spectrometry ion trap (GC/MS2) quantification
of pesticides in concentrated extracts of apple peel prepared by the Quick Easy Cheap Effective Rugged and Safe (QuEChERS) method. Jt is focused on the pesticides most frequently used on the apple varieties studied, throughout the crop cycle, right up to harvest, to combat pests and diseases and to improve fruit storage properties. Extracts from the fleshy receptacle (flesh), the epiderm (peel) and fruit of three apple varieties were studied by high-performance thin-layer chromatography hyphenated with UV-vis light detection (HPTLC/UV visible). The peel extracts had high concentrations of triterpenic acids (oleanolic and ursolic acids), reaching 25 mg kg-1, whereas these compounds were not detected in the flesh extracts ( <0.05 mg kg-1 ).A significant relationship has been found between the levels of these molecules and neg
ative matrix effects in GC/MS2• The differences in the behavior of pesticides with respect to matrix effects
can be accounted for by the physicochemical characteristics of the molecules (!one pairs, labile hydro gen, conjugation). The HPTLC/UV visible method developed here for the characterization of QuEChERS extracts acts as a complementary clean-up method, aimed to decrease the negative matrix effects of such extracts.
Gas or liquid chromatography techniques coupled with mass
spectrometry (MS or MS
0)are among the most powerful analyt
ical tools currently available for monitoring pesticide residues in
food. The use of mass spectrometry, particularly MS
0,has con
siderably improved the selectivity and sensitivity of the analysis.
However, such methods may underestimate or overestimate pesti
cide levels in complex samples, such as food products, due to matrix
effects. Such effects may result in significant differences in the sig
nais obtained for chromatographie standards prepared in solvent
and standards prepared in the matrix
[1-8)
. The chromatographie
signal is increased by positive matrix effects and decreased by neg
ative matrix effects. These effects may result from the adsorption of
analytes and matrix components in the injector, the detector and/ or
the chromatography column
[9)
.
Analysts have long focused on modifications to sample purifica
tion procedures as a means of compensating for the matrix effect.
The QuEChERS method
[ 10)
has been successfully used and adapted
for the extraction of pesticide residues from various types of food
sample, including fruits, such as tomato, pear, apple, orange, lemon,
guava, grape, avocado ... , vegetables, such as cabbage, carrot,
Iet-tuce, cucumber, onion ... , rice
[11 )
. cereal grains
[12)
, liquids and
beverages, such as fruitjuice, olive oil, honey
[ 13 )
... , and processed
products, such as potato chips, and crackers
[14-17)
. Alternative
methods have been developed, based on the addition of internai
labeled standards
[
18)
, calibration in the matrix
[19,20)
, the addi
tion of analyte protectants
(e.g.
sorbitol, -y-lactone-gulonic acid)
[20)
, or calibration correction factors
[8)
. Calibration correction
factors are added to both the standards and the sampi es. They inter
act strongly with the active sites of the system (silanols), thereby
minimizing matrix effects
[18,19)
. The gas chromatograph (load
ing of liners and precolumns) and the mass spectrometer (source
cleaning) should undergo regular maintenance, to ensure that the
sensitivity and reproducibility of the GC/MS method remain high
[19)
.
*
Corresponding author.E-mail address: [email protected] (G. Giacinti). http://dx.doi.org/ 10.1 Ol 6/j.chroma.2016.12.056
The matrix compounds most likely to interfere with gas chromatography analysis are lipids (e.g. waxes, triglycerides, phos-pholipids), pigments (e.g. chlorophylls, carotenoids, melanoidins) and other molecules with a high molecular weight (e.g. resins) likely to dissolve in the solvents used to extract the analytes of interest[9]. A tailing off or fade-out of peaks of interest on chro-matograms may be interpreted as a classic sign of a dirty detector. It must be noticed that tailing peaks can also occur when there is an interaction between the analyte and the stationary phase of the chromatographic column or because of unsuitable injec-tion parameters (insert, injecinjec-tion speed, temperature, volumes. . .) [21]. Apples matrices consist of diverse components, including sugars, proteins, lipids[22–27], polyphenols[27–30]triterpenic compounds, paraffins, and alcohols[31–40], which may interfere with the analysis and contribute to matrix effects.
Positive matrix effects are stronger for pesticide molecules with particular functional groups: organophosphates (-P = O), carbamates (–O CO NH–), hydroxy compounds (–OH), amino compounds (–NH–), imidazoles, benzimidazoles (-N = ) and urea derivatives (–NH CO NH–)[8,9]. Hydrophobic, non-polar com-pounds, such as persistent organochlorine contaminants, are less affected by positive matrix effects because they are less strongly adsorbed onto the liner surface. Organophosphates (e.g. chlorpyri-fos, pirimiphos), organochlorides (e.g., dicofol, captan), pyrethroids (e.g. fenvalerate, deltamethrin), azoles (e.g. tebuconazole, tri-adimefon), carbamates (e.g. carbaryl, pirimicarb), dinitroaniline derivatives (e.g. fluazinam, procymidone, trifluraline), amides (e.g. alachlor, butachlor), phenoxyacetic acid derivatives (e.g. 2,4-d-butylate, haloxyfop) and other compounds, such as piperonyl butoxide, chinomethionate, flutolanil, fluoroglycofen-ethyl, nitro-fen, and hexazinone, are also typically sensitive to positive matrix effects [19]. Giacinti et al. [1] recently demonstrated negative matrix effects for flonicamid, chlorpyrifos, boscalid, fludioxonil, pir-imicarb, and propargite in QuEChERS extracts of apple peel. They also demonstrated positive matrix effects for these compounds in flesh and fruit extracts. The analysis of pesticide residues by GC/MS2 in apple peel results in higher target-analyte concentrations, at lev-els above the limits of detection (LOD), and a greater transfer of matrix analytes to extracts than analyses of the whole fruit.
The aim of this study was to investigate the composition of var-ious QuEChERS extracts of peel/flesh/fruit, using an HPTLC method to determine the principal molecular markers of the apple matrix soluble in acetonitrile (sugars: fructose, glucose and sucrose, triter-penic acids, uvaol, paraffins C27-C29, phloridzin, primary fatty alcohols and polyphenols), (i) to identify the matrix compounds potentially responsible for the negative matrix effects in GC/MS2, observed for flonicamid, chlorpyrifos, boscalid, fludioxonil, prir-imicarb and propargite in peel extracts[1], and (ii) to propose a purification method for highly concentrated extracts for the limi-tation of these matrix effects.
2. Materials and methods
2.1. Target apple varieties
Three apple varieties (VARi) from among the most widely grown and popular in France were chosen for a previous study[1]. These varieties differ in terms of fruit color, composition, sensitivity to pests and ripening times. They were grown in various biotic and abiotic conditions and all trees were sprayed with commercial pesticide preparations according to the seasonal pest risk and the sensitivity of the variety concerned. The apples were collected from the orchard in August (VAR1), October (VAR2), or November (VAR3) and stored in a cold room at 4◦C until processing.
2.2. Selection of pesticides and matrix compounds
The matrix effects of six pesticides among the 11 selected by Giacinti et al.[1]were studied in GC/MS2here (Table 1). The matrix compounds likely to be present in the QuEChERS extracts of apples are also listed inTable 1.
2.3. Chemicals and materials
Chromasolv® for HPLC solvents were purchased from Sigma Aldrich (St Quentin Fallavier, France): ethyl acetate (≥97.7%), ace-tonitrile (≥99.9%), tetrahydrofuran THF (≥99.9%), hexane (≥97%) and isopropanol (99.9%). Chloroform HiPerSolv Chromanorm for HPLC and methanol id Reagent Ph. Eur. for HPLC-gradient grade were purchased from VWR (Strasbourg, France). Acetone Multisolvent®HPLC grade ACS ISO UV–vis Scharlau was purchased from Fischer (Illkirch, France).
Folin & Ciocalteu’s phenol reagent 2N was purchased from Sigma (St Quentin Fallavier, France) and sodium carbonate Acros Organics was obtained from Fischer (Illkirch, France).
The Pestanal analytical standards and the matrix analyti-cal standards (triterpenoids, primary fatty alcohols, paraffins, monosaccharides and polyphenols) were supplied by Sigma Aldrich (St Quentin Fallavier, France): boscalid (99.9%), captan (99.6%), chlorpyrifos (99.9%), dithianon (97.4%), flonicamid (91.9%), fludiox-onil (99.9%), pirimicarb (98.5%), propargite (99.5%), pyraclostrobin (99.9%), thiacloprid (99.9%), thiamethoxam (99.7%), oleanolic acid (≥ 97%), ursolic acid (≥ 90%), uvaol (≥ 95%), 1-hexadecanol C16-OH ReagentPlus (99%), octadecanol C18-OH ReagentPlus (99%), 1-eicosanol C20-OH (98%), 1-docosanol C22-OH (98%), 1-tetracosanol C24-OH (≥99%) and 1-hexacosanol C26-OH (≥97%), 1-octacosanol C28-OH (≥99%), 1-triacontanol C30-OH (≥98%), heptacosane C27 (≥98%), nonacosane C29 (≥98%), ␣-d-glucose (96%), D(−)-fructose (99%), sucrose (99.5%) and dihydrated phlorizin (≥98.5%).
The QuEChERS reagent (a mixture of MgSO4, sodium chloride, disodium citrate and disodium hydrogen citrate; Q-Sep kit 26235), and a mixture of MgSO4, primary secondary amine (PSA) and C18 (tubes 26221 + 26125), were obtained from Restek (Lisses, France). 2.4. Sample processing and preparation
The sampling procedure, extraction and purification by the QuECHERS method have been described in detail elsewhere[1]. In summary, the various samples (apple flesh, apple peel and whole apple) were ground and stored at −24◦C until extrac-tion. Homogenized samples (10 g) were subjected to extraction in 10 mL of acetonitrile with the QuEChERS Restek Q-SepTMsalts kit. The entire supernatant (volumes ranged between 8.5-9.5 mL) was transferred to the Restek dSPE Q-SepTMadsorbent kit (mix of one tube 26221–8 mL and two tubes 26125–1 mL each). Acetonitrile was removed by evaporation to dryness. The resulting dry extracts were then dissolved in 500L ethyl acetate for injection into the gas chromatograph. QuEChERS extracts were identified as follows: FRUITVAR1, 2 or 3; FLESHVAR1, 2 or 3 and PEELVAR1, 2 or 3, for the fruit, flesh and peel extracts of each apple variety, respectively. 2.5. Preparation of standards and calibration curves
2.5.1. Preparation of solvent-matched and matrix-matched pesticide standards for GC/MS2analysis
Pesticide standards were prepared as previously described [1]. Stocks were prepared at a concentration of about 100 ng L−1in ethyl acetate. Mixtures of standard stock solutions were diluted to give 80–8000 ng pesticide in 500L of ethyl acetate containing internal standards. Matrix-matched standards were obtained by spiking apple sample extracts from each variety.
Table 1
Pesticides and matrix compounds studied.
Molecule CAS No. Classification Chemical formula MW (g mol−1) Log Kow(1) Boiling point (◦C)
Boscalid 188425−85-6 Pesticide C18H12Cl2N2O 343.21 2.96 519.6 (1) Chlorpyrifos 39475−55-3 Pesticide C9H11Cl3NO3PS 350.59 4.7 377.4 (1) Flonicamid 158062−67-0 Pesticide C9H6F3N3O 229.16 −0.24 381.4± 52.0 (1) Fludioxonil 131341−86-1 Pesticide C12H6F2N2O2 248.19 4.12 382.6 (1) Pirimicarb 23103−98-2 Pesticide C11H18N4O2 238.29 1.7 326.2 (1) Propargite 2312−35-8 Pesticide C19H26O4S 350.47 5.7 441.8 (1)
Oleanolic acid 508−02-1 Triterpenic acid C30H48O3 456.70 6.47[41] 553.5 (exp) (1)
Ursolic acid 77−52-1 Triterpenic acid C30H48O3 456.70 6.43[41] 528.0 (1)
Uvaol 545−46-0 Triterpenic diol C30H50O2 442.72 8.10 500.7 (1)
Chlorogenic acid 327−97-9 Polyphenol C16H18O9 354.31 −1.01 439.5 (2)
Phlorizin 60–81−1 Polyphenol C21H24O10 436.41 1.50 506.9 (2)
Fructose 57−48-7 Monosaccharide C6H12O6 180.16 −1.46 474.1 (2)
Glucose 50–99-7 Monosaccharide C6H12O6 180.16 −3.24 (exp) 477.4 (2)
Sucrose 57−50-1 Disaccharide C12H22O11 342.30 −3.70 (exp) 683.3 (2)
Heptacosane 593−49-7 Paraffins C27H56 380.73 13.60 416.4 (2)
Nonacosane 630−03-5 Paraffins C29H60 408.73 14.58 442.2 (2)
1-hexadecanol 36653−82-4 Fatty alcohol C16H34O 242.44 6.73 322.5 (2)
1-octadecanol 112−92-5 Fatty alcohol C18H38O 270.49 7.72 343.1 (2)
1-eicosanol 629−96-9 Fatty alcohol C20H42O 298.55 8.70 370.4 (2)
1-docosanol 661−19-8 Fatty alcohol C22H46O 326.60 9.68 386.7 (2)
1-tetracosanol 506−51-4 Fatty alcohol C24H50O 354.65 10.66 412.8 (2)
1-hexacosanol 506−52-5 Fatty alcohol C26H54O 382.71 11.65 425.7 (2)
1-octacosanol 557−61-9 Fatty alcohol C28H58O 410.76 12.63 451.3 (2)
1-triacontanol 593−50-0 Fatty alcohol C30H62O 438.81 13.61 461.4 (2)
(1) Chemspider.com (estimé sur KOWWIN v1.67).
(2) Calculated from smiles codes in HSPiP 4th edition v4.1.07.
Apple sample extracts were prepared as described in Section2.4. Analyses were performed in an UltraTRACE gas chromatograph with a split/splitless injector, coupled to an ITQ900 ion trap mass spectrometer (Thermo Scientific, Courtaboeuf France). The same extracts were also analyzed with an HPTLC method.
2.5.2. Preparation of matrix compound standards for HPTLC/UV–vis characterization and terpenoid quantification
Stocks were prepared at a concentration of about 1 g L−1: monosaccharides, disaccharides and phloridzin in methanol, triter-penic acids, uvaol and paraffins in THF, and fatty alcohols in chloroform. They were analyzed simultaneously with the matrix-matched pesticide standards, by HPTLC.
2.6. Extraction of total waxes from apple peels
Apples were peeled off using a mechanical apple peeler. Peels were submitted to enzymatic digestion at 25± 5◦C during 24 h, in a citrate buffer 20 mM (pH = 4) and containing 16000 U L−1of cel-lulase (from Trichoderma longibrachiatum≥ 1 U L−1, Sigma Aldrich, St Quentin Fallavier, France) and 23600 U L-1of pectinase (aqueous solution of Aspergillus aculeatus≥ 3800 U L−1, Sigma Aldrich). Cit-ric acid anhydrous and sodium citrate were also purchased from Sigma Aldrich. Peels were then widely washed under demineral-ized water and freezed to−40◦C to be lyophilized in the Cryoivoire PILOT 27 (Cryonext, France). Finally, lyophilized peels were ground in an electric grinder. Total waxes were recovered by an extraction in chloroform/methanol (2:1, V/V) in a Soxhlet apparatus. After four complete cycles of solvents i.e. seven to eight hours, the extract was dried at 45◦C under vacuum. The total waxes were then ground into a fine powder using an electric grinder.
2.7. High-performance thin-layer chromatography coupled with UV–vis spectrophotometry
2.7.1. Chemicals and materials
Merck HPTLC silica gel 60F254 glass plates (20× 10 cm, with a 150–200m-thick layer) were purchased from Chro-macim (Moirans, France), HPTLC Nano-Sil NH2/UV254 glass plates
(10× 10 cm, with a 200 m-thick layer were obtained from Macherey Nagel (Hoerdt, France). Plates were prewashed with iso-propanol, dried in an oven at 120◦C for 20 min, and stored in a desiccator until use. NH2 plates were prederivatized just before samples application by dipping the first two centimeters of the plates in 2% formic acid (Sigma Aldrich, St Quentin Fallavier, France) in acetonitrile. The plates were allowed to dry at 50◦C during ten minutes.
The anisaldehyde-H2SO4 derivatization reagent was prepared by mixing 0.5 mL of anisaldehyde (98%; Sigma Aldrich, St Quentin Fallavier, France) with 50 mL of acetic acid (99%; Sigma Aldrich) and 1 mL of sulfuric acid (97%; Sigma Aldrich). The vanillin-H2SO4 derivatization agent was prepared by mixing 1–2 g of vanillin (99%; Alfa Aesar VWR, Strasbourg, France) with 100 mL of ethanol (99.8%; Sigma Aldrich) and 1 mL of sulfuric acid (97%; Sigma Aldrich). 2.7.2. HPTLC equipment and general procedures
Samples were applied to plates with the Autosampler ATS3 CAMAG (Muttenz, Switzerland). Ethyl acetate, methanol, chloro-form or THF was used as a rinsing solvent, according to the solvent used for sample dilution. The following parameters were used: predosage volume 1000 nL, surplus volume 5000 nL, retractation volume 100 nL, delivery speed between 150 and 200 nL s−1 depend-ing on the nature of the solvent, filldepend-ing speed 500 nL s−1, rinsing time 10 s, compression volume 300 nL, compression time 10 s, decom-pression volume 240 nL. The first application position X was set at 15 mm and application position Y at 10 mm. The distance between tracks was calculated automatically from the number of deposits. The spray application mode was used, with a band velocity of 5 mm s−1and a start delay of 50 ms. Band length was fixed at 4 mm. After migration, the plates were photographed with a digi-tal camera (8 megapixels, with 1.5m pixels, f/2.2) under a UV lamp functioning at a power of 4W, at 254 nm (BioBlock Scientific, France), and in daylight after derivatization.
For derivatization, the plates were dipped in a solution of anisaldehyde-H2SO4 or vanillin-H2SO4 with a TLC Immersion Device III CAMAG (Muttenz, Switzerland), at an immersion speed of 2 cm s−1, with an immersion time of 3 s. They were then dried in an oven at 100◦C for 8 min or 10 min respectively.
The plates were also scanned at 200 nm before chemical deriva-tization and at 500 nm after chemical derivaderiva-tization, in the TLC Scanner 3 SC3 CAMAG, with deuterium and tungsten lamps (Mut-tenz, Switzerland). The slit dimension was set to 4× 0.1 mm micro, the scanning speed to 5 mm s−1 and data resolution was set to 50m step−1. Remission and absorption were selected for the mea-surement type and mode, respectively. A second-order optical filter was used, and the detector mode and sensitivity were automatic.
The retardation factor Rf values were evaluated as the substance position with respect to the position of the solvent front measured from the sample application position.
The HPTLC autosampler and scanner, data acquisition and processing were controlled with WinCats 1.4.6.2002 Planar Chro-matography Manager from CAMAG.
2.8. Analysis and quantification of matrix analytes in apple extracts
Volumes of 0–10L of QuEChERS extracts and standards were applied to HPTLC silica gel glass plates with ATS3 as described in Section2.5.2. (Table S1 in the Supplementary material section). The spots were allowed to dry at room temperature for 30 min.
Migration was then carried out in a flat-bottomed glass chamber (24× 24 × 8 cm) saturated with 45 mL of a mixture of hexane, chlo-roform and methanol (3:6:1, v/v/v). The solvent front was 60 mm from the edge of the plates. The plates were allowed to dry at room temperature for 30 min, derivatized by a solution of anisaldehyde-H2SO4and then photographed and scanned as described in Section 2.5.2.
Triterpenoids (oleanolic and ursolic acids and uvaol) were quan-tified in the QuEChERS extracts by HPTLC-UV–vis at 500 nm, after chemical derivatization with anisaldehyde-H2SO4reagent. Triter-penoid contents (in g 100 g−1 of extract) were evaluated by comparing their peak areas with those for calibration curves plot-ted using Microsoft Excel:Mac (2011). The levels of all the other components were determined by studying the areas of their chro-matographic peaks on different densitograms.
2.9. Analysis of matrix analytes by the HTpSPE clean-up procedure of Oellig & Schwack[42]
Pesticide and triterpenic acid standards were applied onto HPTLC Nano-Sil NH2 and silica gel glass plates with ATS3 as described in Section2.5.2. The spots were allowed to dry at room temperature for 30 min.
Two-dimensional chromatography was performed in a flat-bottomed glass chamber (18× 15 × 3 cm). Acetonitrile (12 mL) was used as the first mobile phase to a migration distance of 75 mm. After drying, acetone (12 mL) was used as the second mobile phase, in the backwards direction to a migration distance of 46 mm. The plates were allowed to dry at room temperature for 30 min. They were then dipped in a solution of the derivatization agent, with the TLC Immersion Device III and dried in oven (8 min for anisaldehyde or 10 min for vanillin), photographed and scanned as described in Section2.5.2.
2.10. Determination of the total phenolic content of QuEChERS extracts by the method of Folin & Ciocalteu[43]
The total phenolic content of the QuEChERS extracts in ace-tonitrile was determined before concentration to dryness. These extracts were diluted in water (n = 4), with adjustment of the dilu-tion for the measurement of absorbances in the middle of the calibration curve. The calibration curve as obtained with six stan-dards of chlorogenic acid, with concentrations ranging from 0 to 100 mg L−1. Standards and samples (20L in each case) were
dis-pensed into the wells of a 96-well plate, together with 10L of Folin & Ciocalteu reagent. The plate was shaken for 10 s and 170L of 2.36% sodium carbonate in water was added. The plate was shaken and then incubated at 45◦C for 10 s every 15 min. After 45 min of incubation and shaking cycles, absorbance at 760 nm was read on a UV–vis SpectroStarNano spectrophotometer (Labtech).
The results are expressed in micrograms of chlorogenic acid equivalents per 100 g of fresh matrix.
2.11. Relationship between the matrix effect in GC/MS2and the amount of matrix compounds in the extracts
The matrix effect (%ME) was calculated from the slopes of the calibration curves obtained in solvent (Ss) and in matrix (Sm) (Table S2 in the Supplementary material section):
%ME = (Sm− Ss)/Ss× 100
The matrix effect values were then plotted against the peak areas on HPTLC densitograms. Finally, matrix effect values were plot-ted against total phenolic and triterpenoid contents, which were quantified for all QuEChERS extracts.
2.12. Statistical analysis
The software XLSTAT V 2015.2.01. (Addinsoft, Paris, France) was used to calculate the Pearson’s correlation coefficients (r).
3. Results and discussion
3.1. Study of the target matrix analytes in QuEChERS extracts of apples
Analytical conditions were established for separation of the tar-geted matrix analytes by functional group. The HPTLC plate was first scanned at different UV wavelengths. Five of the eight stan-dards were detected at 200 nm (seeFig. 1B). Sugars, paraffins and fatty alcohols do not absorb at 200 nm because they lack chro-mophores. Triterpenoids have few chromophores and they absorb only at 200 nm in the UV domain. Phlorizin moved to an Rf of 0.05. All the pesticides were retarted at the same Rf value, 0.52. The oleanolic and ursolic acids were overlapped at an Rf of 0.58, whereas uvaol was retarded at an Rf of 0.62.
The compounds on the HPTLC plate were then derivatized with anisaldehyde. Anisaldehyde was chosen for this step because it enhances the detection of triterpenoids, sugars and steroids. Triter-penoids appear as violet zones on a pink background (seeFig. 1A). Sugars give dark green zones, whereas phlorizin gives an orange zone. The track of paraffins shows light green zones at Rf = 0.42 and fatty alcohols give a white halo enclosed by a pink line at Rf = 0.75 in this system. Paraffins and fatty alcohols were not visible after derivatization with anisaldehyde as well as the pesticide mix-ture. The plate was scanned at 500 nm. Five of the eight standards were detected in these conditions: the sugar mixture, phlorizin, and triterpenoids (seeFig. 1C). The sugar mixture remained very close to the deposit line. Anisaldehyde derivatization did not enhance the detection of paraffins, alcohols or pesticides. Paraffins and fatty primary alcohols were detected after derivatization with primuline at Rf = 0.99 and Rf = 0.76 respectively (data not shown). Derivatiza-tion with anisaldehyde facilitated the qualitative and quantitative HPTLC analysis of the target matrix compounds in apple matrices spiked with pesticides, without interaction between these com-pounds and the pesticides themselves.
The separate study of flesh, fruit and peel QuEChERS extracts by HPTLC-UV–vis revealed the presence of triterpenic acids and uvaol, and many other matrix compounds (see Fig. S1 in the
Supplemen-Fig. 1. HPTLC (Silica Gel plates) profiles and densitograms for matrix analyte standards before (A) and after (B and C) derivatization with anisaldehyde reagent.
tary material section). Thirteen zones of matrix compounds (MCi) were detected on the densitograms for FLESHVAR1 and FLESH-VAR2, and 10 were detected on that for FLESHVAR3. Fourteen zones of MCi were detected for FRUITVAR1 and 15 each for FRUITVAR2 and FRUITVAR3. Sixteen zones of matrix compounds were detected for PEELVAR1, and 17 each for PEELVAR2 and PEELVAR3.
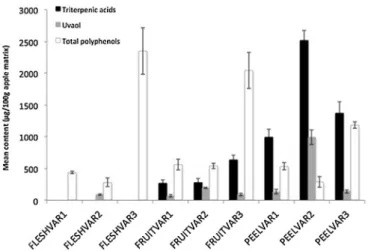
The densitograms differed in terms of the nature (some com-pounds detected and others not detected) and/or concentrations of the compounds identified (seeFig. 2A and B). On the basis of the Rf values of the matrix analytes standards, glucose and fruc-tose were detected in all samples. The compounds at Rf = 1 may be wax esters. Phlorizin and paraffins may have been present in the extracts. However, the principal difference between matrices observed was the presence of triterpenic acids in fruit and peel QuEChERS extracts and the absence of these compounds from flesh extracts ( < 0.05 mg kg−1, see Fig. 2B and Fig. S2 in the Supple-mentary material section). Triterpenoid concentration and total phenolic contents are shown in the histograms inFig. 3.
Triterpenic acid concentration was higher in peel than in fruit extracts. Peel extracts from VAR2 and VAR3 had triterpenic acid concentrations twice that for VAR1. Uvaol concentrations in VAR2 extracts were higher than those in extracts from the other two varieties. Indeed, this compound was detected in flesh and its con-centration in peel extracts from VAR2 were 10 times those in peel extracts from VAR1 and VAR3. Ursolic acid is one of the major cyclic components of the cuticular waxes of apples[38–40,44].
Total phenolic contents followed a pattern very different from that of triterpenoid content. The values are generally normalized by expression as gallic acid equivalents. However, the results in
Fig. 3are expressed as chlorogenic acid equivalents, because this compound is more prevalent in apples.
In VAR1, total phenolic content was similar for flesh, fruit and peel extracts, at about 5 mg chlorogenic acid equivalent per kg of matrix. In VAR2, the total phenolic content of the fruit extract was about twice that of the flesh and peel extracts. VAR3 had the high-est total phenolic content of all the varieties thigh-ested, about four to 10 times higher than those for the other varieties. In VAR3, total phenolic content was higher for the flesh extract than for the fruit and peel extracts. The total phenolic content of the peel extract was about half that of the flesh and fruit extracts.
As it is stated in the literature, the different extracts stud-ied here may not have contained the same polyphenols, with the polyphenol composition of the extract depending on the origin of the matrix. Indeed, the distribution of polyphenols in apple depends on the functional groups of these molecules. For exam-ple, flavonols and flavanols are found in the peel, whereas the phenolic acids are mostly located in the flesh. The core and seeds are richer in dihydrochalcones than the peel[45]. Expressing the results as chlorogenic acid equivalents may have resulted in the concentrations of some polyphenols being overestimated and those of others underestimated, depending on the absorbance of the complex they form with Folin & Ciocalteu reagent. However, the differences observed may reflect differences in anthocyanin con-tent. Anthocyanins are characteristic polyphenols responsible for the red color of some apple varieties, such as VAR1 and VAR3. Indeed, the peel of VAR1 and VAR3 yielded red and pink extracts, respectively. Apples from VAR2 markedly less red in color and their extracts were yellow-orange in color if oxidization occurred during
Fig. 2. HPTLC (Silica Gel plates) profiles (A) and densitograms at 500 nm (B) after the derivatization with anisaldehyde of QuEChERS extracts of apples from VAR1 (a), VAR2 (b) and VAR3 (c).
Fig. 3. Mean terpenoid and polyphenol concentrations (n = 5) in QuEChERS extracts from different apple matrices.
grinding, and greenish yellow otherwise. For all varieties, oxidiza-tion of the sample during grinding resulted the extract being more yellow in color. However, anthocyanins are particularly sensitive to oxidation. Nevertheless, after the SPE dispersive step of the QuECh-ERS extraction procedure, all the extracts were similarly yellow (see Fig. S3 in the supplementary material section).
It could be argued that the purification step, during which matrix analytes are likely to be adsorbed onto the stationary phases (PSA, C18, GCB), and the sensitivity of some molecules to oxidation may account for the pattern of total phenolic content observed.
3.2. Relationship between negative matrix effects in GC/MS2ion trap and co-injected matrix analytes
An analysis of the pesticide content of these extracts without normalization of the peak responses in GC/MS2 ion trap experi-ments showed that the extent of the matrix effect depended on the pesticide molecules (Table S2 in the Supplementary material section). Negative results were obtained for peel extracts, whereas positive results were obtained for flesh extracts. Statistical analysis revealed an impact of the nature of the apple matrix but no sig-nificant effect of apple variety. Fludioxonil and boscalid were the pesticides most sensitive to matrix effects[1].
The occurrence of a matrix effect reflects the nature and quanti-ties of analytes from the matrix co-extracted during the QuEChERS procedure. As the chemical compositions of the flesh and the peel of apples were different (See Section3.1.), it was therefore hypoth-esized that the negative matrix effects observed in peel extracts might reflect the presence, in sufficiently large quantities, of one or several molecules able to interfere with pesticides during hot splitless injection.
An HPTLC/UV–vis analysis of all the extracts led to the identi-fication of a large number of analytes (Section3.1. and see Fig. S1 in the Supplementary material section) likely to be involved in the observed matrix effects.
To examine the relationship between the MCi matrix data containing peak area responses for the nine apple matrices and the matrix effect data for each pesticide, Pearson correlation coefficients were calculated. A strong significant correlation was observed (p-values < 0.05) between all the pesticides and the con-tent of oleanolic and ursolic acids (-0.833 < r <−0.954; see Table S3 in the Supplementary material section).
3.3. Relationship between the negative matrix effect observed in GC/MS2and triterpenic acid contents
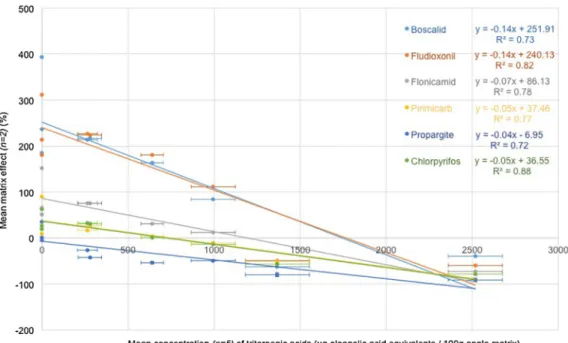
Matrix effect values were plotted against triterpenic acids con-tent (See Fig. 4) A linear relationship was observed between matrix effect and triterpenic acids content for each pesticide (0.72 < R2< 0.88).
Matrix effects are known to be controled by a number of fac-tors simultaneously. In hot splitless injection, for example, many compounds of different volatilities may accumulate, leading to interference resulting in a globally positive or negative matrix effect. In flesh extracts, in which no triterpenic acids were detected, matrix effects were generally positive and very strong for fludiox-onil and boscalid (between 200 and 400%). These effects were much weaker (between 50 and 100%) for flonicamid, pirimicarb and chlorpyrifos. Propargite is a particular case, for which the matrix effect is always negative, regardless of the nature of the matrix. In VAR2 and VAR3, the values are really closed to zero, meaning that the matrix effect for this compound was almost non-existent in these flesh extracts.
Thus, flesh extracts probably contain compounds that enhance the chromatographic signal in GC/MS2 in the absence of triter-penic acids. It has been stated in the literature that compounds like sorbitol can act as analytes’ protectants during hot splitless injec-tion[20]. Sugars are the main components of flesh. It is likely that analytes from flesh matrices could enhance the pesticides’ chro-matographic responses and cause a positive matrix effect.
In 1993, Erney et al.[3,46]were the first to identify “matrix-induced chromatographic response enhancement” in analyses of organophosphates in milk and butter extracts. They claimed that, when standards are injected in solvents, analytes could be adsorbed onto the active sites of the injector and column, or degraded by cat-alytic thermodecomposition at these sites (presence of metals and free silanols on the glass liners). When standards are injected in matrix, the matrix compounds block these sites, globally enhanc-ing the standard signals. The matrix effect thus results from the analytes co-extracted from the matrix, generally in larger amounts than the analytes of interest. The smallest amounts (ultratraces) of co-extracted analytes are associated with the most positive matrix effects. Quantitative data may be unreliable if calibration curves are not prepared in matrix extracts.
At the same time, the number of new active sites increases, because of the progressive accumulation of non-volatile com-pounds in the inlet liner and in front of the column. This could lead to a decrease in the chromatographic signal, referred to by Hajslova & Cajka as “matrix-induced diminishment”[6]. These two phenom-ena occur almost simultaneously, and it is therefore impossible to exert any real control over the formation of new active sites due to the accumulation of non-volatile analytes. Kowalski et al.[7] recently showed that pesticide molecules could react with matrix compounds and degrade during hot splitless injection, and even during extraction steps in some cases.
Apple peel contains large amounts of cuticular lipids. The soluble waxes protecting the cuticle consist of long-chain (n = 20-40 carbon atoms) molecules and terpenoids, of various degrees of volatility (Table 1). These molecules can accumulate in the inlet liner and create active sites capable of reacting with pesticides, decreasing the amount of pesticide reaching the mass detector. The propensity of each pesticide to interact with the active molecules may result in matrix effects of various strengths.
3.4. So what happens during hot splitless injection to suppress the pesticide signal during co-injection with triterpenic acids?
In gas phase, a proton transfer reaction can occur between a compound HA which can be deprotonated, and a compound B,
Fig. 4. Linear regression between the matrix effect and triterpenic acid content in the different apple matrices.
which can be protonated. The gas phase acidity (GA) of HA is the free energy change for the reaction HA→ A−+ H+. The gas phase basicity (GB) is the free energy of the reaction BH+→ B + H+[47–49].
Triterpenic acids are reactive species because of their carboxylic acid group COOH, whose proton can undergo a proton transfer reac-tion. Boscalid (I), chlorpyrifos (II), flonicamid (III), fludioxonil (IV) and pirimicarb (V) contain nitrogen involved in different amino groups that could behave as bases. Pesticides (I) to (V) contain het-erocyclic amines: (I) to (III) have a pyridine ring, (IV) a pyrrole ring and (V) a pyrimidine ring. (I), (III) and (V) have an amide group. (III) and (IV) have a nitrile group. Propargite has no basic amino groups (See Fig. S4. in the Supplementary material section).
The relationship between the matrix effect on boscalid and flu-dioxonil and triterpenic acid content is the strongest of all the six pesticides (similar slopes a =−0.14, see Fig. 4). The relation-ship between the matrix effect on pirimicarb and triterpenic acid content is similar to that for chlorpyrifos (a =−0.05) and less pro-nounced than for flonicamid (a =−0.07). Finally, propargite is less sensitive to matrix effects: the slope of the linear regression for the relationship between the matrix effect on propargite and triter-penic acid content was lowest for this compound (a =−0.04).
Most GB values for nitrogen compounds are available in the literature [50,51] but not for the targeted pesti-cides. It was observed that gas phase basicity increases from nitriles < amines < amides < pyroles < pyrimidines < pyridines. The nature, position and number of substituants on the nitrogen function greatly modify the gas basicity values. Substituants act on protonation by the electrostatic effects and the resonance of electrons[49]. There are globally two kinds of substituants in the gas phase: the ones that participate to charge stabilization (alkyl groups, aromatic cycles) and those that destabilize the charges in the protonated forms (halogens) [50]. It has been observed that para-substituants are more influent than meta and ortho-substituants.
Propargite, that does not contain nitrogen, is the less basic of all the six pesticides and does not highly interact with triterpenic acids. Pesticides containing pyridine cycles (boscalid, chlorpyrifos and flonicamid) are expected to have the most important GB values. The GB value of pyridine is 898.1 kJ mol−1. It decreases to 862 kJ mol−1 in p-trifluoromethylpyridine. Boscalid is then expected to have the
most important GB value whereas chlorpyrifos the least. In fludiox-onil, the preferred site of protonation could be the cyano nitrogen atom. The protonated form is highly stabilized by the pyrrole and the aromatic rings. This could explain the high reactivity of the fludioxonil with the triterpenic acids.
Following the injection of highly concentrated extracts, the chromatographic system becomes dirty, suppressing the ion sig-nal. Efficient cleaning is thus required, with replacement of the inlet liner and the pre-column (and/or the removal of several centime-ters at the start of the column, particularly if it is not preceded by a pre-column) and cleaning of the ion volume and the detector source. Merely cleaning the detector does not restore sensitivity: signal suppression seems to occur mostly upstream, in the chro-matograph. Marked fouling of the inlet liner has been observed, with successive injections of highly concentrated extracts leading to a greenish-yellowish deposit within the glass liner. Thus, if injec-tions of highly concentrated extracts are required to highlight the amounts of pesticides in more representative samples, as demon-strated in a previous study[1], then effective clean-up techniques for extracts are essential.
3.5. Purification of apple peel QuEChERS extracts by HPTLC, to minimize negative matrix effects in subsequent GC/MS2ion trap analysis
A recently developed clean-up concept in the multi-residue analysis of pesticides based on planar solid phase extraction fol-lowed by chromatographic analysis[42]could be used to purify extracts. Oellig & Schwack used thin-layer chromatography (TLC) to separate pesticides from matrix compounds and to focus them into a sharp zone, followed by extraction of the target zone through TLC–MS Interface before chromatography. Their method was used to analyze a QuEChERS extract of peel from organic VAR1 apples with a standard mixture of target pesticides, both on HPTLC NH2 plates and on TLC Silica foils (Data not shown). Overlapping of pes-ticides with some matrix compounds at Rf = 0.68 was observed, regardless of the nature of the stationary phase. Further investi-gations were then undergone.
On HPTLC NH2 plates prederivatized with 2% formic acid in acetonitrile, triterpenic acids were retarded at Rf = 0, far away
Fig. 5. Densitograms at 200 nm of pesticide and triterpenic acid standards on (A) HPTLC NH2plates after prederivarization with formic acid (2% in acetonitrile), (B) HPTLC
NH2plates without prederivatization and (B’) HPTLC Silica Gel plates without prederivarization, based on the HTpSPE clean-up method developed by Oellig & Schwack[42].
from boscalid, chlorpyrifos, flonicamid, fludioxonil and boscalid, all retarded at Rf = 0.68 as well as tetrahydrophtalimid, the metabolite of captan (seeFig. 5A). It is worth noticing that captan and dithi-anon were not retarded at the same Rf that of the other pesticides. In this analysis, the signal of captan showed two peaks at Rf = 0 and Rf = 0.9 and dithianon three peaks at Rf = 0, Rf = 0.35 (tailing peak) and Rf = 0.9. On HPTLC NH2plates without prederivatization, triterpenic acids, captan and dithianon were all retarded at Rf = 0 whereas the other pesticides were retarded at Rf = 0.68 (seeFig. 5B). Prederivatization did not change the densitrographic profile, any-way the oleanolic acid turned into a well-defined Gaussian-like peak. On HPTLC Silica plates, all standards were retarded at Rf = 0.68 (SeeFig. 5B’).
The method developed by Oellig and Schwack well separates triterpenic acids from boscalid, chlorpyrifos, flonicamid, fludiox-onil and pyraclostrobine. As the negative matrix effects observed in GC/MS2seem to be due to the presence of large amounts of triter-penic acids, it is an effective method to purify highly concentrated peel extracts. The main drawback is the lack of recovery of captan and dithianon, two pesticides out of the 11 mostly used to treat apple orchards in South West of France[1]. Using Silica plates did not solve the problem by overlapping all the compounds.
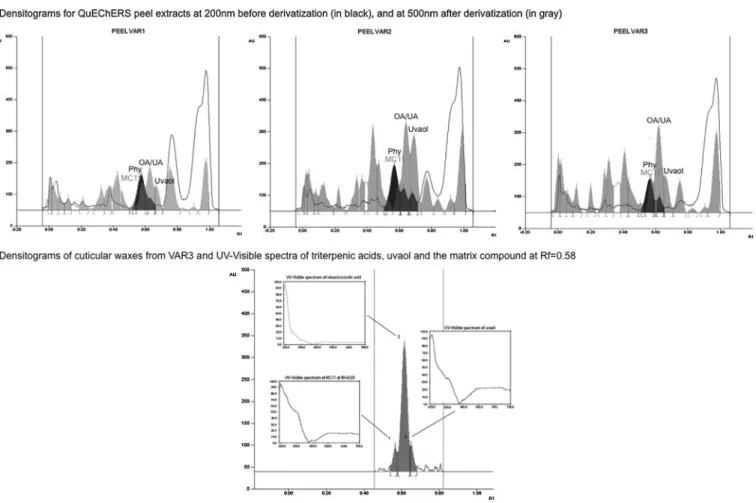
The HPTLC method optimized in this study for the analysis of matrix compounds and the quantitation of the triterpenoids (seeFig. 6A), separated pesticides (Rf = 0.58) and triterpenic acids (Rf = 0.62). All the eleven previous studied targeted pesticides
Fig. 6. Densitograms of QuEChERS extracts of peel spiked with pesticide standards before and after chemical derivatization, at 200 nm (in gray) and 500 nm (in black) (A) and HPTLC/UV–vis characterization of terpenoids in apple cuticular waxes (B).
overlapped at Rf = 0.58 and were detectable only before chemi-cal derivatization at 200 nm, whereas the triterpenic acids were also detectable at 500 nm, after chemical derivatization with the anisaldehyde-H2SO4 reagent. Derivatization highlighted another zone of matrix compounds MC11 at the same Rf as pesticides (see Fig. S1 in the Supplementary material section) on the densitograms of peel extracts (seeFig. 6A). This zone was also detected in the cuticular waxes (seeFig. 6B). UV spectra were registered for the three zones of matrix compounds in cuticular waxes from apples of VAR3: MC11 at Rf = 0.58, triterpenic acids at Rf = 0.62 and uvaol at Rf = 0.66 (seeFig. 6B). After derivatization, MC11 was detected as a purple spot on a pink background with a Rf very close to those of triterpenoids, particularly triterpenic acid. Moreover, a study of its UV spectrum, with only onemaxat 200 nm, as for the terpenoids studied, suggested that his molecule might also be a terpenoid. The correlation between MC11 and the calculated matrix effects in GC/MS2was not significant (p > 0.05, see Table S3 in the Supple-mentary material section).
This method does not provide the same separation efficiency between pesticides and triterpenic acids as the one of Oellig and Schwack, anyway it separates pesticides and triterpenic acids allowing at the same time the recovery of captan and dithianon, two pesticides widely used in French apple orchards. Used as a purifica-tion step before hyphenated HPTLC/GC/MS2ion trap techniques for example, it would help to minimize matrix effects occurring during pesticides analysis in highly concentrated QuEChERS extracts from apple samples.
4. Conclusion
The previously published GC–MS2method[1]was successfully extended to the identification of matrix analytes in QuEChERS extracts of fruit, flesh and peel, through HPTLC analysis of the major molecular markers representative of each type of matrix. Peel extracts are characterized by particularly high levels of oleanolic and ursolic acids (10–25 mg kg−1). There is a relevant relation-ship between negative matrix effects and the concentration of these acids. According to gas phase acid-base chemistry, the pes-ticides can react as proton acceptor and the triterpenic acids as proton donor. Boscalid and fludioxonil were the pesticides found to interact most with triterpenic acids. They are more basic than floni-camid, pirimicarb, chlorpyrifos and propargite, due to the nature of their nitrogen protonable site and the substituants involved in the stabilization of the charges of the protonated species. The higher concentrations of triterpenic acids in peel extracts suppress the signal, this effect being less marked for flonicamid, pirimicarb, chlorpyrifos and propargite.
The proposed HPTLC method involves the overlapping of pes-ticides combined with their separation from most of the matrix compounds, including oleanolic and ursolic acids in particular. Thus, the combination of this method with a TLC/MS Interface could result in a more efficient clean-up of QuEChERS extracts before GC analysis. This method could be transposed to purification on columns or by flash chromatography.
Acknowledgements
This work was undertaken within the framework of a FUI project, INNOPOM, funded by BPI France and the Conseil Régional Midi-Pyrénées.
Appendix A. Supplementary data
Supplementary data associated with this article can be found, in the online version, athttp://dx.doi.org/10.1016/j.chroma.2016.12. 056.
References
[1] G. Giacinti, C. Raynaud, S. Capblancq, V. Simon, Matrix-matching as an improvement strategy for the detection of pesticide residues, J. Food Sci. 81
(2016) T1342–T1350,http://dx.doi.org/10.1111/1750-3841.13296.
[2] V.P. Shah, K.K. Midha, J.W.A. Findlay, H.M. Hill, J.D. Hulse, I.J. McGilveray, G. McKay, K.J. Miller, R.N. Patnaik, M.L. Powell, A. Tonelli, C.T. Viswanathan, A. Yacobi, Bioanalytical method validation—a revisit with a decade of progress,
Pharm. Res. 17 (2000) 1551–1557,http://dx.doi.org/10.1023/
A:1007669411738.
[3] L. Silvestro, I. Tarcomnicu, S. Rizea, Matrix effects in mass spectrometry combined with separation methods — comparison HPLC, GC and discussion on methods to control these effects, in: A.V. Coelho (Ed.), Tandem Mass
Spectrom.−Mol. Charact, InTech, 2013 (accessed March 24, 2016)http://
www.intechopen.com/books/tandem-mass-spectrometry-molecular- characterization/matrix-effects-in-mass-spectrometry-combined-with-separation-methods-comparison-hplc-gc-and-discussi.
[4] B.K. Matuszewski, M.L. Constanzer, C.M. Chavez-Eng, Strategies for the assessment of matrix effect in quantitative bioanalytical methods based on
HPLC–MS/MS, Anal. Chem. 75 (2003) 3019–3030,http://dx.doi.org/10.1021/
ac020361s.
[5] F.A. de Sousa, A.I. Guido Costa, M.E.L.R. de Queiroz, R.F. Teófilo, A.A. Neves, G.P. de Pinho, Evaluation of matrix effect on the GC response of eleven pesticides
by PCA, Food Chem. 135 (2012) 179–185,http://dx.doi.org/10.1016/j.
foodchem.2012.04.063.
[6]J. Hajslova, T. Cajka, Gas chromatography in food analysis, in: Handb. Food Anal. Instrum., Taylor & Francis Group, LLC, 2008.
[7] J. Kowalski, M. Misselwitz, J. Cochran, Investigation of Matrix Compounds Responsible for Enhanced Degradation of Organochlorine, Organophosphorus, Organonitrogen and Carbamate Pesticides During Hot GC Splitless Injection of
QuEChERS Extracts of Canola Seed, 2013http://www.rafa2013.eu/BoA.html.
[8] C.F. Poole, Matrix-induced response enhancement in pesticide residue analysis by gas chromatography, J. Chromatogr. A 1158 (2007) 241–250,
http://dx.doi.org/10.1016/j.chroma.2007.01.018.
[9] J. Hajslova, J. Zrostlikova, Matrix effects in (ultra)trace analysis of pesticide residues in food and biotic matrices, J. Chromatogr. A (2003) 181–197,http:// dx.doi.org/10.1016/S0021-9673(03)00539-9.
[10]M. Anastassiades, S.J. Lehotay, D. Stajnbaher, F.J. Schenck, Fast and easy multiresidue method employing acetonitrile extraction/partitioning and dispersive solid-phase extraction for the determination of pesticide residues in produce, J. Aoac Int. 86 (2003) 412–431.
[11] D. Steiniger, J. Butler, E. Phillips, Multi-residue pesticide analysis in rice by a modified QuEChERS extraction and ion trap GC/MSn analysis Thermo Scientific Technical Note: 10239 (2009).
[12]D. Shelly, C.A. Perman, Multiresidue analysis of cereal grains using a modified QuEChERS method with GC-TOFMS and UPLC-MS-MS analysis, Trade Publ. (2010) 34.
[13] D. Paradis, Méthode d’analyse dans le miel de trois familles d’insecticides (nicotinoïdes, pyréthrinoïdes et pyrazoles) par chromatographies en phase gazeuse et en phase liquide couplées à la spectrométrie de masse en tandem.: application à l’ étude de contamination de ruches., Aix-Marseille, 2012.http:// www.theses.fr/2012AIXM4058(accessed July 5, 2016).
[14] J.A.C. Guedes, R.O. de Silva, C.G. Lima, M.A.L. Milhome, R.F. do Nascimento, Matrix effect in guava multiresidue analysis by QuEChERS method and gas chromatography coupled to quadrupole mass spectrometry, Food Chem. 199
(2016) 380–386,http://dx.doi.org/10.1016/j.foodchem.2015.12.007.
[15] A. Wilkowska, M. Biziuk, Determination of pesticide residues in food matrices
using the QuEChERS methodology, Food Chem. 125 (2011) 803–812,http://
dx.doi.org/10.1016/j.foodchem.2010.09.094.
[16] J. Fenik, M. Tankiewicz, M. Biziuk, Properties and determination of pesticides in fruits and vegetables, TrAC Trends Anal. Chem. 30 (2011) 814–826,http:// dx.doi.org/10.1016/j.trac.2011.02.008.
[17] C. Lesueur, P. Knittl, M. Gartner, A. Mentler, M. Fuerhacker, Analysis of 140 pesticides from conventional farming foodstuff samples after extraction with
the modified QuECheRS method, Food Control. 19 (2008) 906–914,http://dx.
doi.org/10.1016/j.foodcont.2007.09.002.
[18] H. Kwon, S.J. Lehotay, L. Geis-Asteggiante, Variability of matrix effects in liquid and gas chromatography?mass spectrometry analysis of pesticide residues after QuEChERS sample preparation of different food crops, J. Chromatogr. A
1270 (2012) 235–245,http://dx.doi.org/10.1016/j.chroma.2012.10.059.
[19] Y. Wang, H.-Y. Jin, S.-C. Ma, J. Lu, R.-C. Lin, Determination of 195 pesticide residues in Chinese herbs by gas chromatographyâD mass spectrometry using analyte protectants, J. Chromatogr. A 1218 (2011) 334–342,http://dx.doi.org/ 10.1016/j.chroma.2010.11.036.
[20] G.C.R.M. Andrade, R.M.O. Freguglia, R.P.Z. Furlani, N.H. Torres, V.L. Tornisielo, Determination of pesticide residues in tomato using dispersive solid-phase extraction and gas chromatography/ion trap mass spectrometry, J. Braz.
Chem. Soc. 22 (2011) 1701–1708,
http://dx.doi.org/10.1590/S0103-50532011000900012.
[21]K. Grob, Split and Splitless Injection in Capillary GC (with Some Remarks on PTV Injection), 3rd edition, Wiley-VCH Verlag GmbH, 1993.
[22]M. Colin-Henrion, De la pomme à la pomme transformée: impact du procédé sur deux composés d’intérêt nutritionnel. Caractérisation physique et sensorielle des produits transformés, Université d’Angers, Ecole Doctorale d’Angers Sciences agronomiques, 2008.
[23]G. Campeanu, G. Neata, G. Darjanschi, Chemical composition of the fruits of several apple cultivars growth as biological crop, Not. Bot. Horti Agrobot. Cluj-Napoca. 37 (2009) 161–164.
[24]J. Wu, H. Gao, L. Zhao, X. Liao, F. Chen, Z. Wang, X. Hu, Chemical compositional characterization of some apple cultivars, Food Chem. 103 (2007) 88–93.
[25] J.A. Marlett, N.W. Vollendorf, Dietary fiber content and composition of different forms of fruits, Food Chem. 51 (1994) 39–44,http://dx.doi.org/10. 1016/0308-8146(94)90045-0.
[26] P. Massiot, A. Baron, J.F. Drilleau, Characterisation and enzymatic hydrolysis of cell-wall polysaccharides from different tissue zones of apple, Carbohydr.
Polym. 25 (1994) 145–154,http://dx.doi.org/10.1016/0144-8617(94)90198-8.
[27]I. Travers, Influence des conditions pédoclimatiques du terroir sur le comportement du pommier et la composition des pommes à cidre dans le Pays d’Auge, Université de Caen, 2002.
[28]C. Verdu, Cartographie génétique des composés phénoliques de la pomme, Université Nantes Angers Le Mans, 2013.
[29]R. Veberic, M. Trobec, Herbinger, M. Hofer, D. Grill, F. Stampar, Phenolic compounds in some apple (Malus domestica Borkh) cultivars of organic and integrated production, J. Sci. Food Agric. (2005) 1687–1694.
[30]T. Dugé de Bernonville, Caractérisations histologique, moléulaire et biochimique des interactions compatible et incompatible entre Erwinia amylovora, agent du feu bactérien, et le pommier (Malus x domestica), Université d’Angers, 2009.
[31]G. Bianchi, Plant waxes, in: Waxes Chem Mol. Biol. Funct., THe Oily Press, Glasgow, 1995, pp. 175–222.
[32]A. Szakiel, C. Paczkowski, F. Pensec, C. Bertsch, Fruit cuticular waxes as a source of biologically active triterpenoids, Phytochem. Rev. 11 (2012) 263–284.
[33]J.-P. Garrec, C. Henry, L. Le Maout, Cires epi- et intracuticulaires: Etude de leur separation de leurs caracteristiques chimiques et de leurs rôles respectifs dans la perméabilité cuticulaire, Environ. Exp. Bot. 35 (1995) 399–409.
[34]C. Buschhaus, R. Jetter, Composition differences between epicuticular and intracuticular wax substructures: how do plants seal their epidermal surfaces? J. Exp. Bot. 62 (2011) 841–853.
[35]T. Shepherd, D.W. Griffiths, The effects of stress on plant cuticular waxes, New Phytol. 171 (2006) 469–499.
[36] X. Dong, J. Rao, D.J. Huber, X. Chang, F. Xin, Wax composition of ‘Red Fuji apple fruit during development and during storage after 1-methylcyclopropene treatment, Hortic. Environ. Biotechnol. 53 (2012) 288–297,http://dx.doi.org/ 10.1007/s13580-012-0036-0.
[37]G. Bonnier, Revue Générale de Botanique, Librairie Générale de l’Enseignement, 1963.
[38] A.M.S. Fernandes, E.A. Baker, J.T. Martin, Studies on plant cuticle, Ann. Appl. Biol. 53 (1964) 43–58,http://dx.doi.org/10.1111/j.1744-7348.1964.tb03779.x. [39]P.E. Kolattukudi, Natural waxes on fruit, Inst. Biol. Chem. Wash. State Univ.
Pullman. 2 (1984) 3–7.
[40]T.K. McGhie, S. Hudault, R.C.M. Lunken, J.T. Christeller, Apple peels, from seven cultivars, have lipase-inhibitory activity and contain numerous ursenoic acids as identified by LC-ESI-QTOF-HRMS, J. Agric. Food Chem. 60 (2012) 482–491.
[41] C. Bérangère, N. Caussarieu, P. Morin, L. Morin-Allory, M. Lafosse, Rapid analysis of triterpenic acids by liquid chromatography using porous graphitic carbon and evaporative light scattering detection, J. Sep. Sci. 27 (2004)
964–970,http://dx.doi.org/10.1002/jssc.200401764.
[42]C. Oellig, W. Schwack, Planar solid phase extraction-A new clean-up concept in multi-residue analysis of pesticides by liquid chromatography-mass spectrometry, J. Chromatogr. A. 1218 (2011) 6540–6547.
[43]V.L. Singleton, J.A. Rossi, Colorimetry of total phenolics with
phosphomolybdic-phosphotungstic acid reagents, Am. J. Enol. Vitic. 16 (1965) 144–158.
[44]N.P. Morozova, E.G. Sal’kova, Study of the composition of apple cuticle, Prikl. Biokhimiya Mikrobiol. 2 (1966) 232–238.
[45] M.A. Awad, A. de Jager, L.M. van Westing, Flavonoid and chlorogenic acid levels in apple fruit: characterisation of variation, Sci. Hortic. 83 (2000)
249–263,http://dx.doi.org/10.1016/S0304-4238(99)00124-7.
[46] D.R. Erney, A.M. Gillespie, D.M. Gilvydis, C.F. Poole, Explanation of the matrix-induced chromatographic response enhancement of organophosphorus pesticides during open tubular column gas chromatography with splitless or hot on-column injection and flame photometric detection, J. Chromatogr. A. 638 (1993) 57–63,http://dx.doi.org/ 10.1016/0021-9673(93)85007-T.
[47] C.R. Moylan, J.I. Brauman, Gas phase acid-base chemistry, Annu. Rev. Phys.
Chem. 34 (1983) 187–215,http://dx.doi.org/10.1146/annurev.pc.34.100183.
001155.
[48] R. Shimshi, X. Wang, R.J. Cross, M. Saunders, Dynamics of the gas-phase acid-base reaction, J. Am. Chem. Soc. 117 (1995) 9756–9759,http://dx.doi. org/10.1021/ja00143a020.
[49] G. Bouchoux, Gas-phase basicities of polyfunctional molecules Part 1: theory
and methods, Mass Spectrom. Rev. 26 (2007) 775–835,http://dx.doi.org/10.
1002/mas.20151.
[50] E.D. Raczy ´nska, J.-F. Gal, P.-C. Maria, Enhanced basicity of push–pull nitrogen bases in the gas phase, Chem. Rev. (2016),http://dx.doi.org/10.1021/acs. chemrev.6b00224.
[51] G. Bouchoux, M. Eckert-Maksic, Gas phase basicities of polyfunctional molecules Part 5: Non-aromatic sp(2) nitrogen containing compounds, Mass Spectrom. Rev. (2016),http://dx.doi.org/10.1002/mas.21511.
Table S1
Analytical parameters for the characterization of matrix compounds and the quantification of
terpenoids in QuEChERS extracts by HPTLC/UV-Visible
*ME = matrix effect
Sample
Volume (µL) used
for characterization
Volume (µL) used to
investigate the
ME*/matrix compounds
relationship
Volume (µL) used
for terpenoid
quantification
QuEChERS extracts FRUITVAR1, 2 & 3
(n=5)
10
1
4
QuEChERS extracts FLESHVAR1, 2 & 3
(n=5)
10
1
10
QuEChERS extracts PEELVAR1,
QuEChERS extracts PEELVAR2 & 3
(n=5)
10
1
2
1
Pesticide mixture (0.2 mg L
-1)
10
-
-
Oleanolic acid (1 g L
-1)
5
1
0 – 1.5
Uvaol (1 g L
-1)
5
1
0 – 1.5
Ursolic acid (1 g L
-1)
5
-
-
Paraffins C27 and C29 (0.5 g L
-1each)
5
-
-
Primary fatty alcohols (0.125 g L
-1each)
5
-
-
Sugar mixture (1 g L
-1each)
5
-
-
Table S2
Matrix effect values evaluated without normalization of chromatographic peak area (from a
previous study by Giacinti et al., 2016, [1])
Active
agent
FLESH
VAR1
FLESH
VAR2
FLESH
VAR3
FRUIT
VAR1
FRUIT
VAR2
FRUIT
VAR3
PEEL
VAR1
PEEL
VAR2
PEEL
VAR3
Flonicamid
168
68
48
72
69
23
27
-73
-50
136
64
54
79
81
38
-3
-53
Pirimicarb
98
25
5
20
17
-2
-6
-78
-49
81
28
14
13
37
9
-16
-53
Propargite
35
7
-6
-25
-42
-57
-35
-91
-80
36
-5
-3
-27
-43
-50
-63
-80
Chlorpyrifos
59
29
16
30
24
-8
-3
-78
-57
66
24
23
34
37
9
-24
-56
Fludioxonil
315
214
176
208
222
177
135
-60
-52
308
212
184
244
226
183
89
-47
Boscalid
418
246
183
202
219
146
96
-40
-71
370
228
188
225
213
182
73
-53
Table S3
Pearson correlation coefficients between matrix effects and matrix compounds MCi levels (areas of peaks) measured in the nine studied apple extracts (The coefficients in bold are significant).
Variables Flonicamid Pirimicarb Propargite
Chlorpyrifos-ethyl Fludioxonil Boscalid
Sugar
mix/Phlor Fru/Phlor MC1 MC2 MC3 MC4 MC5 MC6 MC7 MC8 MC9 MC10 MC11 OA/UA Uvaol MC12 MC14 Etsers/paraffins
Flonicamid 1 Pirimicarb 0.990**** 1 Propargite 0.913*** 0.917*** 1 Chlorpyrifos-ethyl 0.987**** 0.970**** 0.897*** 1 Fludioxonil 0.977**** 0.960**** 0.866** 0.988**** 1 Boscalid 0.987**** 0.978**** 0.921*** 0.969**** 0.976**** 1 Sugar mix/Phlor -0.572 -0.591 -0.714* -0.579 -0.603 -0.647 1 Fru/Phlor -0.549 -0.536 -0.736* -0.583 -0.597 -0.614 0.772* 1 MC1 -0.243 -0.224 -0.329 -0.297 -0.345 -0.334 0.694* 0.789* 1 MC2 0.232 0.196 0.041 0.160 0.180 0.261 0.179 0.357 0.287 1 MC3 0.651 0.613 0.582 0.573 0.551 0.619 -0.062 -0.299 0.022 0.301 1 MC4 0.470 0.413 0.219 0.520 0.485 0.421 0.079 0.130 0.051 0.590 0.169 1 MC5 0.127 0.138 -0.190 0.163 0.240 0.141 -0.073 0.216 -0.224 0.265 -0.285 0.478 1 MC6 -0.025 -0.066 0.059 -0.104 -0.165 -0.081 0.321 0.232 0.611 0.180 0.503 -0.187 -0.739* 1 MC7 -0.307 -0.329 -0.383 -0.297 -0.375 -0.431 0.857** 0.520 0.667* -0.085 0.187 0.076 -0.336 0.498 1 MC8 -0.182 -0.291 -0.367 -0.175 -0.190 -0.219 0.507 0.514 0.367 0.590 0.108 0.508 0.053 0.418 0.368 1 MC9 -0.489 -0.451 -0.512 -0.559 -0.536 -0.451 0.401 0.718* 0.580 0.551 -0.401 -0.042 0.089 0.139 0.003 0.278 1 MC10 0.337 0.355 0.402 0.325 0.264 0.336 -0.447 0.030 0.107 0.359 -0.140 0.391 0.048 0.042 -0.406 0.075 0.288 1 MC11 -0.543 -0.562 -0.576 -0.544 -0.540 -0.610 0.724* 0.457 0.566 -0.312 -0.020 -0.423 -0.350 0.495 0.746* 0.235 0.078 -0.647 1 OA/UA -0.834** -0.834** -0.954**** -0.856** -0.833** -0.861** 0.815** 0.845** 0.526 0.090 -0.369 -0.217 0.111 0.158 0.510 0.431 0.577 -0.403 0.666 1 Uvaol -0.635 -0.691* -0.720* -0.647 -0.613 -0.605 0.695* 0.616 0.387 0.503 -0.247 0.097 0.009 0.212 0.314 0.708* 0.663 -0.212 0.386 0.732* 1 MC12 0.383 0.306 0.150 0.454 0.462 0.304 0.131 0.032 0.212 0.040 0.217 0.475 0.186 0.152 0.295 0.411 -0.354 -0.083 0.295 -0.118 -0.035 1 MC14 0.657 0.610 0.436 0.630 0.605 0.622 0.039 0.100 0.244 0.798** 0.537 0.842** 0.227 0.183 0.062 0.479 0.079 0.419 -0.364 -0.299 0.079 0.429 1 Esters/paraffins -0.790* -0.757* -0.854** -0.820** -0.828** -0.829** 0.692* 0.922*** 0.669* 0.097 -0.519 -0.195 0.081 0.173 0.420 0.320 0.738* -0.036 0.508 0.904*** 0.592 -0.213 -0.268 1