Open Archive TOULOUSE Archive Ouverte (OATAO)
OATAO is an open access repository that collects the work of Toulouse researchers and
makes it freely available over the web where possible.
This is an author-deposited version published in :
http://oatao.univ-toulouse.fr/
Eprints ID : 19737
To link to this article : DOI:10.1016/j.jnucmat.2018.01.013
URL :
http://dx.doi.org/10.1016/j.jnucmat.2018.01.013
To cite this version :
Gupta, Jyoti and Hure, Jérémy and Tanguy,
Benoit and Laffont-Dantras, Lydia and Lafont, Marie-Christine and
Andrieu, Eric Characterization of ion irradiation effects on the
microstructure, hardness, deformation and crack initiation behavior
of austenitic stainless steel: heavy ions vs protons. (2018) Journal of
Nuclear Materials, vol. 501. pp. 45-58. ISSN 0022-3115
Any correspondence concerning this service should be sent to the repository
administrator:
staff-oatao@listes-diff.inp-toulouse.fr
Characterization of ion irradiation effects on the microstructure,
hardness, deformation and crack initiation behavior of austenitic
stainless steel:Heavy ions vs protons
J. Gupta
a,b, J. Hure
a, B. Tanguy
a,*, L. Laffont
b, M.-C. Lafont
b, E. Andrieu
baCEA Saclay, Universit!e Paris-Saclay, DEN, Service d’Etudes des Mat!eriaux Irradi!es, 91191 Gif-Sur-Yvette, France bInstitut CARNOT, CIRIMAT-ENSIACET, 4 all!ee Emile Monso, 31030 Toulouse cedex 4, France
a b s t r a c t
Irradiation Assisted Stress Corrosion Cracking (IASCC) is a complex phenomenon of degradation which can have a significant influence on maintenance time and cost of core internals of a Pressurized Water Reactor (PWR). Hence, it is an issue of concern, especially in the context of lifetime extension of PWRs. Proton irradiation is generally used as a representative alternative of neutron irradiation to improve the current understanding of the mechanisms involved in IASCC. This study assesses the possibility of using heavy ions irradiation to evaluate IASCC mechanisms by comparing the irradiation induced modifications (in microstructure and mechanical properties) and cracking susceptibility of SA 304 L after both type of irradiations: Fe irradiation at 450!C and proton irradiation at 350!C. Irradiation-induced defects are
characterized and quantified along with nano-hardness measurements, showing a correlation between irradiation hardening and density of Frank loops that is well captured by Orowan's formula. Both irra-diations (iron and proton) increase the susceptibility of SA 304 L to intergranular cracking on subjection to Constant Extension Rate Tensile tests (CERT) in simulated nominal PWR primary water environment at 340!C. For these conditions, cracking susceptibility is found to be quantitatively similar for both
irra-diations, despite significant differences in hardening and degree of localization.
1. Introduction
The core internals of a Pressurized Water Reactor (PWR) are intended to remain for the full life of the reactor, so austenitic stainless steels are used to fabricate these components as they have good mechanical properties and are known to be immune to stress corrosion cracking. However, service inspection of the core in-ternals has revealed the susceptibility of baffle to former bolts (BFBs) to a special kind of aging mechanism known as Irradiation Assisted Stress Corrosion Cracking (IASCC) [1]. As name suggests, IASCC corresponds to irradiation induced or enhanced intergran-ular stress corrosion cracking of the material. Simultaneous occurrence of various factors namely, susceptible material, stress state, irradiation and corrosive environment is an essential condi-tion for IASCC and eliminacondi-tion of either of these factors can highly reduce or suppress it [2,3].
IASCC is an issue of concern for the presently working PWRs as it affects the lifetime of baffle-former bolts (BFBs), increasing the duration and cost of maintenance operation of these core internals. Hence, an extensive R&D is essential to understand the IASCC mechanism that could cause the cracking of bolts. Since the first reported observation of IASCC in BFBs in the 1980's [1], several attempts have been made to investigate the mechanistic issues believed to be the controlling factors in crack initiation and prop-agation during IASCC of austenitic stainless steel in PWRs [4e6]. Some of the significant factors that have been proposed to be contributing in IASCC are irradiation hardening induced by irradi-ation induced defects in microstructure (such as, Frank loops, cavities, and precipitates) and Radiation Induced Segregation (RIS) [2,4e7]. Some recent studies have also proposed localized defor-mation (irradiation induced modification in the defordefor-mation mode) to be the most prominent factor [8e10]. However, the complex coupling of these parameters (i.e. radiation induced modifications in microstructure, microchemistry, mechanical properties and deformation modes) makes the understanding of the IASCC *Corresponding author.
E-mail address:benoit.tanguy@cea.fr(B. Tanguy).
phenomenon very difficult [9e12]. And hence, in spite of the continuous research ongoing in this field, a clear understanding of the IASCC phenomenon to develop a predictive modelling is still lacking. To solve the riddle of IASCC, it is necessary to assess the impact of the contributing parameters on IASCC, individually as well as when coupled. This requires conducting experiments on irradiated materials over a wide range of damage levels (dpa) and in variety of conditions (irradiation temperature, loading conditions, environmental conditions) to obtain a statistically large data base. But this is hardly feasible using only neutron irradiated samples as conducting neutron irradiation is very time consuming and costly. Besides, handling radioactive samples and conducting numerous high definition analysis (such as TEM, SEM and APT) on them makes the situation even more challenging. As an alternative, ion irradiations (protons, electrons and heavy ions) have been used to surrogate neutron damage to conduct parametric studies [13].
Ion irradiations can be conducted at well-defined energy, dose rate and temperature resulting in very well controlled experiments, thus giving advantage over both time and money. Most popularly employed ion irradiation is the proton irradiation. Several studies have demonstrated the prospect of using proton irradiation to emulate the neutron irradiation regarding irradiation induced microstructure, microchemistry segregation, hardening properties and deformation mode [14e17]. It has, thus, been established as an efficient tool to replicate neutron damage [14e20] and a viable candidate to study IASCC mechanisms in PWR environment. Indeed, majority of the existing data on intergranular cracking of ion irradiated sample at LWR relevant temperatures is also based on the proton irradiation [18e20]. Another possible alternative is the use of heavy ions such as Fe, Ni and Xe. Like protons, heavy ions irradiation has been shown to mimic the irradiation induced microstructure relevant to neutron irradiation [21e23]. In Refs. [16,22e24], authors have shown that dislocation channeling is the prime deformation mode for heavy ion irradiated austenitic stainless steel at PWR relevant temperature as well. However, the strain localization in case of heavy ion irradiated materials has been reported to be less intensive in comparison to its proton irradiated counterparts [16,23,24]. This has been attributed to the shallow penetration depth of heavy ions in austenitic stainless steel [16,23]. In case of heavy ions, the displacement cascade produced is very similar to the neutron irradiation but it is confined to a very small volume of the material (depth of few
m
ms for 10 MeV). Protons, on the other hand, form smaller displacement cascades but have a relatively higher penetration depth in the austenitic stainless steel (tens ofm
ms for 3 MeV). Considering strain localization to be the main contributing factor in IASCC [8e10], shallow penetration depths of heavy ions might greatly affect the IASCC tests by altering the deformation structure at the surface. As a consequence, very few studies related to intergranular cracking in irradiated material are based on the use of heavy ions [24,25], although demonstrating the successful use of heavy ions irradiation in investigating IASCC. Indeed, in a previous study [24], it was shown that iron irradiation on SA 304 L led to intergranular stress corrosion cracking (IGSCC) in PWR environment. Different aspects of intergranular cracking (such as irradiation induced microstructure, irradiation hardening and localized deformation) on iron irradiated material were addressed as well, emphasizing the possibility of using ion irradiation as a tool to investigate IASCC. Thus far, no comparative study highlighting the differences and similarities regarding the cracking susceptibil-ity of irradiated austenitic stainless steel in PWR environment for both ion irradiations has been conducted.In this paper, different aspects of intergranular stress corrosion cracking of ion irradiated SA 304 L austenitic stainless steel in PWR environment were investigated and compared for two different irradiation ions (iron ions and protons). Post to irradiation,
microstructural characterizations and a series of nano-indentation tests were conducted. CERT tests were done in simulated PWR environment on irradiated material to assess the susceptibility of material towards cracking. Surface characterization was used to obtain the information on the degree of localization in each case. Results for iron and proton irradiated samples were compared to obtain a better overview of the differences and similarities in both conditions.
2. Experimental techniques
2.1. Material and irradiations conditions
The material used in this study is a commercial grade AISI 304 L stainless steel. The chemical composition is Fee18.75Cre8.55Nie0.02Moe0.45Sie1.65Mne0.012Ce0.01P-e0.002S (wt %). The stacking fault energy of the material calculated using Pickering's formula is 23 mJ/m2[26]. The material was solu-tion annealed at 1050!C for 30 min followed by quenching with helium and had a mean grain size of 27
m
m. Tensile specimens with gauge section of length 18.0 mm, width 2.0 mm and thickness 2.0 mm and an overall length of 40.0 mm were fabricated along with bars of cross section2mm " 2 mm and length 18 mm using electro spark technique. Tensile samples were used to perform constant elongation rate tests (CERT) while bars were used to characterize the irradiated microstructure.Prior to irradiation, these samples were mechanically polished up to ¼
m
m diamond paste followed by vibratory polishing (on the face to be irradiated) in OPS solution for 10 h to eliminate surface hardened zone induced by mechanical polishing. Two irradiation campaigns were conducted. For both iron and proton irradiations, the damage profile obtained using SRIM-2011 under Kinchin e Pease approximation (leading to dpa K-P as recommended in Ref. [27]) and using displacement energy of 40 eV [28] is shown in Fig. 1. For the sake of simplicity the damage will be cited as simply dpa from now onwards. First irradiation experiment was conducted at 450!C using 10 MeV Fe5þions in electrostatic accelerator con-nected to a triple beam chamber at JANNuS facility of CEA Saclay [29]. Targeted doses were 5 and 10 dpa at the surface with a dose rate of 2.7 " 10$4dpa/s (calculated at the surface). However, post irradiation flux evaluation based on “flux chambers” measurements showed that the flux was overestimated, as a consequence, the doses obtained at 100 nm below the surface of the samples were close to a mean value of 3 dpa and 7 dpa with a dose rate of 1.8 " 10$4 dpa/s and 2.1 " 10$4 dpa/s evaluated at the surface respectively (Table 1). The uncertainty was evaluated to be ± 1dpa and ± 2 dpa, respectively. Irradiation temperature of 450 ± 20!C was used in order to compensate for the effect of higher dose rate (~10$4dpa/s for iron ions in comparison to ~10$8dpa/s for neu-trons) on microstructural evolution associated with ion irradiation [24]. Details of the Fe irradiation are given in Refs. [24,30]. As shown inFig. 1, the damage profile consisted of a continuously varying damage region followed by a peak at a depth of 1.9m
m giving a total penetration depth of about 2.5m
m of 10 MeV Fe ions in the samples. As all the characterizations were performed at the surface (~100 nm below the surface), the damage considered in this study will correspond to the damage at the surface, i.e. mean value of 3 and 7 dpa, respectively.Proton irradiation was conducted at 350!C using Tandem accelerator at Michigan Ion Beam Laboratory, University of Michi-gan [31]. Samples were irradiated using 2 MeV protons. The range of penetration of protons was ~20
m
m. The irradiated region con-sisted of a relatively constant damage region (up to ~ 14m
m) fol-lowed by a sharp irradiation peak at approximately 19m
m (Fig. 1). Proton irradiated samples were characterized by the damage at adepth of 10
m
m (i.e. 2 dpa), corresponding to a dose rate of 5.8 " 10$6dpa/s. The samples temperature was controlled to be within ±10!C.For the ease of comprehension, samples will be addressed as 3 dpa e Fe, 7 dpa e Fe and 2 dpa e H samples from now onwards, where the number represents the dose and the letter(s) represent the irradiation ion used.
The surface irradiated in each sample (irrespective of irradiation type) was 10 mm " 2 mm implying all samples had both irradiated and unirradiated regions. This allows to have comparative studies in irradiated and unirradiated conditions independent of surface preparation and material sampling.
2.2. Microstructure characterization
To characterize the microstructure, TEM (Transmission Electron Microscope) foils were prepared from the irradiated surface of bars. Details of sample preparation technique are given in Refs. [24,30]. JEOL 2100 HRTEM (High Resolution Transmission Electron Micro-scope) operated at 200 kV available at UMS Castaing (Toulouse, France) was used for the purpose.
One of the most prominent defects induced by irradiation in the microstructure is Frank loops. Long established Rel e Rod technique using the diffraction conditions ([011] zone axis with g ¼ ½ (3e11) diffusive line or [001] zone axis with g ¼ 022 streak) was used to highlight these defects in the microstructure [32]. The presence of Fig. 1. Irradiation damage profile obtained for SA304L irradiated with 10 MeV Fe5þ(in dotted and plain lines) and with 2 MeV Hþ(in dashed line). Zoomed image (in dashed
rectangle) is shown to clearly illustrate the damage profile for iron ions and protons close to the irradiated surface of the sample. Damage was calculated using SRIM-2011 with K-P approximation using displacement energy of 40eV [27,28] and plotted as a function of irradiation depth. The error bars in the damage profile (in dashed rectangle) represents the range of dpa values obtained for the 3 dpa e Fe and 7 dpa e Fe samples.
Table 1
Different parameters of the irradiation conditions used in this study. For protons, the dose was calculated at a depth of 10mm from the irradiated surface.
Sample Irradiation ion Irradiation temperature (in!C) Dose rate (in dpa/s) Damage at surface (in dpa) Irradiation depth (inmm)
2 dpa e H Proton, 2 MeV 350 5.8 " 10$6 2 20
3 dpa e Fe Iron, 10 MeV 450 1.8 " 10$4 3 2.5
cavities was evaluated using over and under focus technique. Im-ages acquired in different perforation zones of several TEM foils were used to obtain a better statistic of each type of defects.
For quantitative estimations (density and size of these radiation induced defects), image analysis software was used on Dark Field (DF) TEM images. The software permitted the user to manually select the loops and at the end of the analysis provided the mean density and size of the loops based on the selection made by user. To be transparent to the electrons, the TEM foils should have thickness ranging between 70 and 150 nm. In this study a mean foil thickness of 100 nm has been taken to estimate the density of loops. This value is in agreement with several others studies where similar materials have been characterized [19,33,34]. The error in number density reported in this paper takes into account the un-certainty associated to the TEM foils thickness. To have a good statistics, quantification was done on 3 different images for each sample, which corresponds to 600e700 loops counted for each condition, and mean values were observed.
2.3. Nanoindentation measurements
The small penetration depths associated to the ion irradiations bound to use the small scale material evaluation methods to assess the irradiation induced changes in mechanical properties [35]. Nanoindentation is one of such technique and is generally employed to estimate the irradiation hardening in the ion irradi-ated material (see e.g. Refs. [17,36,37]). The samples were indented onto the surface along the same direction as the ion beam irradi-ation using a Berkovich tip (three sided pyramid which is self-similar and has a half angle of 65!, and a tip radius of about 100 nm). Within the unirradiated and irradiated region1 of Fe irradiated samples, a grid of 10 lines with 20 indents each were made corresponding to indent penetration depths of 2.5
m
m, 2m
m, 1m
m, 600 nm, 500 nm, 450 nm, 400 nm, 350 nm, 300 nm and 250 nm. While in 2 dpa e H sample, a grid of 5 lines with 20 indents each, corresponding to indent penetration depths of 2m
m, 1.5m
m, 1m
m, 500 nm, and 250 nm were made. The distance between the two consecutive indents and between two lines was 40m
m each to avoid interactions between plastic zones generated by each indent. Indentations were performed in depth e control mode. The average of the 20 measured hardness values was calculated and considered for the corresponding indent penetration depth. The duration of loading/unloading was fixed to 20s with the loading/unloading rate varying depending on the maximum load. A 5s hold time was used at the maximum load.2.4. Constant Extension Rate Tensile (CERT) testing
To assess the cracking susceptibility of the material after irra-diation, CERT tests were conducted with a strain rate of 5 " 10$8s$1 in simulated nominal PWR primary water environment using tensile testing device CORMET C137. Tests were interrupted on attaining a plastic strain of 4% and the total test duration was about 10 days.
The simulated primary water used for the test contained 25e35 cc/kg H2STP, 1000 ppm B and 2 ppm Li. It was maintained at a temperature and pressure of 340!C and 155 bars respectively during the test in an autoclave (5 L capacity). Prior to straining,
environmental conditions were allowed to stabilize for few hours. Load was applied using a computer driven 30 kN load train. The displacements were measured by a displacement sensor LVDT (Linear Variable Displacement Transducer) located on the traction line of the autoclave. Load and displacement data were collected by a computerized data acquisition system and recorded every 10 s. Further details of the tests conducted are given in Refs. [24,30].
2.5. IASCC susceptibility assessment
After straining to a plastic strain of 4%, the gauge length of all the samples was examined using FEI Helios 650 NanoLab Dual Beam FIB under SEM mode. For better visualization of the sur-face, oxide crystallites2were removed by polishing the samples using vibratory polisher. Care was taken to remove only outer oxide crystallites, thereby keeping the surface of the specimen intact.
Quantitative evaluation of mean crack length and crack density was based on the scanning of an area of 1 mm2(2 mm " 0.5 mm) within the middle portion of the irradiated region of the sample line by line, by taking images from side to side in a line from top to bottom, much like raster scan. All the images were taken at same magnification of HFW (Horizontal Full Width) of 118
m
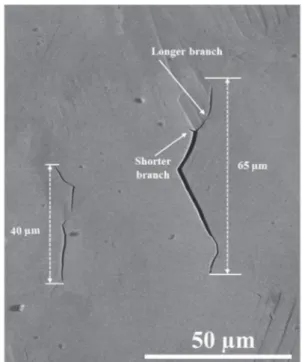
m in BSE (Back Scattered Electron) mode. Cracks were counted manually to evaluate the density of cracks. The crack length (transverse length between the two ends of the crack and in case of a branched crack, transverse length corresponding to the longer branch,Fig. 2) of each crack was estimated. The data on crack length thus obtained was converted into a crack length distribution profile from which the mean crack length was obtained. Statistical evaluation of the mean value of crack density and mean crack length were based on scanning two different areas of 1 mm2on each sample.Fig. 2. SEM image illustrating the criterion chosen to measure the crack length.
1 The unirradiated area corresponds to the portion of sample which was under
the sample holder during irradiation. As it was marked by the edges of the sample holder, irradiated e unirradiated transition zone was a sharp line. Indents in this area were made 1.5 mm away from the irradiated e unirradiated transition zone to avoid any interaction between the two regions.
2Formed on the surface of the samples due to exposure to simulated PWR
2.6. Characterization of localized deformation
FEI Helios 650 NanoLab Dual Beam FIB under SEM mode was used to obtain images of the grain with slip lines. For each condi-tion, over 10 SEM images (containing a total of around 25 grains) were obtained. The inter-line spacing of two consecutive slip lines observable on the surface of the strained samples was measured manually. Around 100 measurements for each condition were made and the average value of spacing between the slip lines was used as an indicator of the degree of localization.
3. Results and discussions
3.1. Microstructure
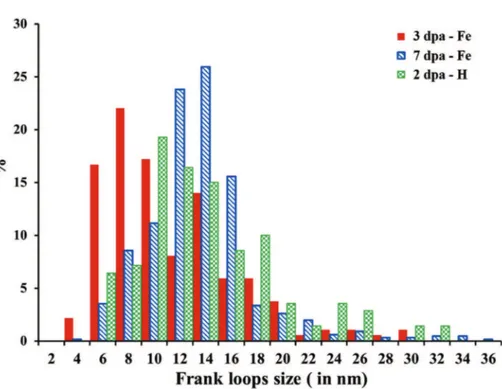
The irradiation induced microstructure consisted of dislocation loops in all the samples, irrespective of irradiating ion type and dose. As an example, a Dark Field (g ¼ ½ ($311) on zone axis [011]) TEM image of the Frank loops observed in 3 dpa e Fe sample and a Bright Field TEM (BFTEM) image of Frank loops observed in 7 dpa e Fe and 2 dpa e H sample are shown inFig. 3. The size distribution of Frank loops obtained for the iron and proton irradiated samples is shown inFig. 4. Similar asymmetric distributions extending up to 34 nm and majority of loops ranging between 6 nm and 24 nm were observed for all the samples. The average number density and diameter of dislocation loops obtained from image analysis of Dark Field TEM images are detailed inTable 2.
The number density and mean size of Frank loops obtained for both iron and proton irradiated samples were in accordance with the values reported in neutron [10,18,38,39] and ion literature [18e23]. With increasing dose, a slight increase in average number density and diameter of Frank loops was observed in iron irradiated samples. The saturation in the Frank loop density and diameter observed for the 7 dpa sample seems consistent with the saturation in Frank loop density and size, reported in neutron [4,36,39] and ion irradiated samples [19,20,22,23,40] around 1 dpa and 5 dpa, respectively. Frank loop density was notably higher in proton irradiated sample compared to the iron irradiated samples despite a smaller irradiation dose in the former. This could be explained by the difference in irradiation temperatures used to conduct the two irradiations. The choice of respective irradiation temperatures was based on the temperature shift calculations which took into ac-count the effect of dose rates on microstructural evolution associ-ated with ion irradiation [2]: in order to compensate dose rate effects on microchemistry (resp. microstructure), ion irradiation should have been done at 550!C (resp. 370!C) to be comprehen-sively comparable with proton irradiation at 350!C. A mean tem-perature of 450!C was chosen as both properties are known to influence susceptibility to IASCC, which is slightly higher than the theoretical temperature recommended to have similar irradiation-induced defects.
Iron irradiation was conducted at higher temperature compared to proton irradiation. Higher irradiation temperature results in lower density of irradiation induced defects [4,41] and hence,
Fig. 3. a) Rel-rod Dark Field TEM image obtained by selecting g ¼ ½ ($311) streak (encircled in red) in the diffraction pattern (in inset) highlighting the Frank loops present in the microstructure of 3 dpa e Fe sample. Bright Field TEM image of the Frank loops (marked by white arrows) observed in the microstructure of b) 7 dpa e Fe and c) 2 dpa e H samples. (For interpretation of the references to colour in this figure legend, the reader is referred to the Web version of this article.)
Fig. 4. Frank loops size distribution obtained for 3 dpa e Fe, 7 dpa e Fe (dashed) and 2 dpa e H (dotted) samples.
Table 2
Summary of the density and size of irradiation-induced Frank loops observed in different samples.
Sample Dose (dpa) Frank loops density (x 1022loops/m3) Mean Frank loops size (in nm)
3 dpa e Fe 3 2.20 ± 0.75 13.4 ± 1.9
7 dpa e Fe 7 2.55 ± 1.05 14.9 ± 3.6
2 dpa e H 2 3.60 ± 1.50 13.8 ± 4.8
Fig. 5. Comparison of the Frank loops density observed in iron irradiated samples (in blue closed symbols) and proton irradiated samples (in red closed symbols) used in this study with ion literature (in open symbols) [14,16,18e23,38]. The error bars in the figure represents the uncertainty in the estimation of number density of the Frank loops observed including the uncertainty in the foil thickness. (For interpretation of the references to colour in this figure legend, the reader is referred to the Web version of this article.)
justifies the observation of smaller defect density in 3 dpa e Fe and 7 dpa e Fe samples compared to 2 dpa e H samples. Nevertheless, the density values obtained in this study are within the scatter (Fig. 5) that has been reported for ion irradiated samples in litera-ture [19e23]. Beside Frank loops, no other irradiation induced de-fects (e.g. cavities, radiation induced precipitates) were observed in the studied irradiated materials at the surface.
3.2. Irradiation hardening from nanoindentation measurements
The increase in hardness of the ion irradiated austenitic stainless steel was estimated by nanoindentation measurements performed at room temperature. Using the data points obtained from nano-indentation measurements, Nix e Gao graphs (i.e. square of nanoindentation hardness plotted as a function of inverse of indent penetration depth) were plotted to avoid the indentation size effect [42]. The extrapolated value obtained from the graph was used to represent the bulk hardness of the (un)irradiated material (assuming that the mechanical properties of the material are con-stant whatever the indentation depth). Nix e Gao graphs obtained for unirradiated, 3 dpa e Fe, 7 dpa e Fe and 2 dpa e H samples are shown inFig. 6a and b andFig. 7.
The extrapolated value obtained using linear fitting gave a bulk hardness value, H0, of 2 ± 0.7 GPa for unirradiated sample. The corresponding Vickers hardness (Hv) value calculated using equa-tion(1)was 191 ± 11 Hv[17]. Vickers hardness measurement test performed separately on the unirradiated sample yielded a value of 200 ± 30 Hvwhich was in good agreement with the value obtained from Nix e Gao graph.
Hv¼ 0:0945 H0 ðGPaÞ (1)
InFig. 6a and b, a bi-linearity behavior with an inflexion point around 0.6
m
m can be observed for iron irradiated samples. This can be attributed to the contribution in hardness from underlying softer substrate. To understand this situation it is necessary to acknowledge that obtaining correct value of hardness for ion irra-diated sample using nanoindentation technique requires rather sophisticated analysis. As shown schematically on Fig. 6c, each indent made on samples has an associated plastic zone. The hard-ness value obtained for a given indent at a depth “d” contains the contribution from the entire plastic zone originating from the indent [35,42,43]. In ion irradiated samples, beyond a certain depth, plastic zone originating from the indentation exceeds the boundary between the irradiated and underlying unirradiated material (case A and B inFig. 6c). Moreover, complex plastic zone shapes have reported recently from numerical simulations [44]). Contribution of this unirradiated area starts reflecting in the measured hardness of sample and the values thus obtained no longer truly represents the hardness in irradiated region of material. To estimate the bulk hardness of the irradiated region, linear fitting thus should be done for indents with depth in material smaller than the inflection point. The maximum indent penetration depth used in this study was 2.5m
m. Considering that plastic zone extends up to about 4e5 times the indent depth in ion irradiated samples [23,35,45], indents made at depths ( 0.6m
m are assumed to have a plastic zone extending up to depths > 2.5m
m (i.e. extending in underlying softer substrate). The bulk hardness value for the iron irradiated sample was obtained by linear fitting the data points between 0.25m
m ) d ) 0.5m
m (Case C inFig. 6a and b). The results obtained onFig. 6a and b show that indent depths between ~1/5 and ~1/10 of the irradiated zone can be used to evaluate the bulk hardness.Another issue needed to be addressed was the strong variation of the damage profile (Fig. 1) in iron irradiated samples implying a variation of mechanical properties in the irradiated layer. Thus
using linear fitting, which comes from the assumption of constant mechanical properties, for Fe irradiated samples was questionable. Saturation in density and size of irradiation induced defects has been reported around 5 dpa in ion irradiated austenitic stainless steels [19,20,22,23]. For the 7 dpa e Fe irradiated sample, it was then implicitly assumed that the mechanical properties were constant in the irradiated layer and hence, the hardness value determined could be seen as representative of the irradiated vol-ume. While in case of 3 dpa e Fe sample, it was unknown if the mechanical properties are saturated or not. This made difficult to associate the measured hardness with the surface dose of the sample. Therefore, the extrapolated value estimated for this sample has to be considered as an average value of hardness for the given range of damage. In the following, this value will be only used for the qualitative assessment of increase in hardness with iron irradiation.
In proton irradiated samples, the damage profile was relatively flat (constant damage region extending up to 14
m
m with a net irradiated thickness of 20m
m) (Fig. 1). So, the extent of plastic zone was not an issue of concern for 2 dpa e H sample considering the maximum indentation depth of 2.5m
m used (Fig. 7).The extrapolated values (H0) for 3 dpa e Fe and 7 dpa e Fe samples evaluated by linear fitting the data points between 4
m
m$1( 1/d ( 2m
m$1were 3.1 GPa ± 0.3 GPa and 3.3 GPa ± 0.3 GPa respectively. An increase in hardness post to irradiation was observed in both cases which could be attributed to the presence of irradiation induced defects in the microstructure of these samples. The increase was estimated to be 67% in 7 dpa e Fe sample. In case of 2 dpa e H sample, data fitting was done for 0.25m
m ) d ) 2.5m
m and an increase of 120% in bulk hardness with irradiation was esti-mated (Fig. 7). Noticeably higher increase in hardness was observed in proton irradiated samples compared to iron irradiated samples and could be associated to the higher density of irradiation induced defects observed in the former. In Ref. [45], authors have also re-ported to observe higher increase in hardness in austenitic stainless steel (Z6CND17.12) post to proton irradiation compared to Xe irra-diation at the same damage level. This difference was attributed to the difference in the irradiation damage rate and ion species by the authors.3.3. Correlation between irradiation hardening and microstructural defects
Irradiation induced defects present in the microstructure are known to obstruct the motion of dislocations, thereby resulting in an increase in hardness after irradiation. A first approximation of the hardening induced by the irradiation induced defects can be obtained based on the barrier hardening model [46] which corre-lates the increase in yield strength (
Ds
y) with density of irradiation induced defects as given by equation(2).Ds
y¼! X
Ds
2k#1=2andDs
k¼a
kMm
bðNkdkÞ1=2 (2)where, k is the irradiation induced defect type (Frank loops, black dots, cavities and precipitates),
a
is the hardening coefficient, M is the Taylor factor (3.06 for FCC material),m
is the shear modulus (72000e84000 MPa), b is the Burgers vector (0.248e0.255 " 10$9m), and Nkand dkare the number density (m$3) and the mean diameter (m) of type k defects, respectively [46].
Based on experimental datafitting technique, Busby et al. [47] proposed that the increase in yield strength can be calculated from the measured Vickers hardness value using the relation:
Fig. 6. Nix - Gao profiles (H2versus 1/d) obtained for a) and b) unirradiated, 3 dpa e Fe and 7 dpa e Fe irradiated samples using nanoindentation test. c) Schematics to demonstrate
the influence of the plastic zone while estimating the hardness for ion irradiated material using nanoindentation test. Black solid lines represent the grain boundary, white triangles represent the indents made on material and gray circles represent the plastic zones associated to those indents.
Combining equations(2) and (3) indicates that the increase in hardness after irradiation is proportional to the square root of the product of all defects number density and size, i.e.:
∆Hv¼
a
kMmb 3:03 ! X Nkdk #1=2 or ∆Hvf! XNkdk #1=2 (4)In this study, it was considered that the only irradiation defects that contribute to the hardening are the observed Frank loops.
Going with this approach, increase in hardness values (obtained from extrapolated bulk hardness value from nanoindentation test and equation (1)) was plotted as a function of square root of product of density and size of Frank loops3 quantified in the microstructure of the samples4(Fig. 8).
Considering the contribution in hardness only from Frank loops (as no other irradiated defects were observed in TEM), a good linear relation was obtained. Note that for the data fitting inFig. 8, value corresponding to 3 dpa e Fe sample was not used as the measured hardness could not be associated with the density of defects quantified for this sample (due to the range of the damage probed by the indents made on the sample). The
a
value obtained for Frank loops from the data points of this study ranged between 0.38 and 0.45 which is in very good accordance to the range of value ofa
reported in literature (0.33e0.45) corresponding to similar micro-structure in neutron irradiated austenitic stainless steel [46]. These results also imply that as the irradiation conditions (ion type, irradiation temperature, and dose rate) used in this study were different for iron and proton irradiations, the characterized samples showed better correlation of irradiation induced defects with the
increase in hardness instead of irradiation dose used. Considering the good correlation shown in Fig. 8, increase in hardness (or equivalently irradiation-induced defects density) will be used to characterize and compare the samples instead of their doses.
3.4. IASCC susceptibility
To compare the IASCC susceptibility of iron and proton irradi-ated samples, CERT tests were performed up to 4% plastic strain at 340!C in simulated PWR primary water environment followed by SEM surface analysis of the irradiated gage length of the samples. The value of the plastic strain was computed from the load-displacement curve of the tensile sample. However, because of the shallowness of the irradiated layer, this value also corresponds to the plastic strain in this layer which was confirmed through numerical simulations. As a first result, numerous cracks were observed on the irradiated surface of all the samples. Cartographies of 0.1 mm2 area obtained from the irradiated gage length of the samples using ForeScattered electron (FSE) imaging system of the electron flash EBSD detectors confirmed the intergranular nature of these cracks as shown inFig. 9. Colour contrast ofFig. 9provided qualitative information on grain orientations thereby making the intergranular nature of the cracks more apparent in images.
Both iron and proton irradiated samples confirm the increase of sensibility to intergranular cracking with irradiation. This study confirms the results of previous studies that have also demon-strated the increase in the propensity of material to cracking with irradiation (irrespective of irradiation type) [20,24]. This paper, on the other hand, provides a quantitative comparative study (i.e. crack density and mean crack length) of cracking observed in iron and proton irradiated samples after CERT tests in simulated PWR primary water.
A crack density of 302 ± 23 cracks/mm2was estimated for 3 dpa e Fe sample. The length of the cracks observed on the surface of the sample ranged from small (<5
m
m) to long (~60m
m), giving a mean crack length of 17 ± 2m
m. Results for the 3 samples are given in Fig. 7. Nix - Gao profiles (H2versus 1/d) obtained for unirradiated (in blue) and 2 dpa e H (in red) samples using nanoindentation test. (For interpretation of the references to colourin this figure legend, the reader is referred to the Web version of this article.)
3 As only Frank loops were observed in the microstructure of iron and proton
irradiated samples used in this study.
4 In addition to the data presented in this study, a data point from an internal
study (Fe [30] inFig. 7) was used. This data point corresponds to iron irradiation conditions similar to the ones used in this study for iron irradiated samples.
5 The extreme values were calculated with a¼ 0.45e0.33, M ¼ 3.06,
Table 3. No significant evolution is observed between 3 and 7 dpa Fe-Irradiated samples. It is also interesting to note that the crack density and mean crack length is very similar between the 2 dpa-H sample and the Fe irradiated samples. These results show similar behavior of all the samples towards intergranular cracking. Crack length distributions obtained were very similar for all the samples as well (Fig. 10).
Fig. 11shows the crack density and mean crack length plotted as Fig. 8. Increase in hardness plotted as a function of density of Frank loops. In blue dashed line is the line fitting obtained for data points of this study. Theoretical curves in red are obtained by using the extreme values of different parameters in eqn(3).5The data point Fe [30] is taken from an internal study [30]. The error bars in the figure represents the
uncertainty in the estimation of number density and mean length of the Frank loops observed. (For interpretation of the references to colour in this figure legend, the reader is referred to the Web version of this article.)
Fig. 9. EBSD cartographies obtained using FSE after 4% plastic strain in the irradiated area of a) 3 dpa e Fe and b) 2 dpa e H sample, c) unirradiated deformed area. Few cracks are indicated by yellow arrows. Black dashed lines contoured the ferrite phase. The images were done after oxydes were removed using vibrator polisher. (For interpretation of the references to colour in this figure legend, the reader is referred to the Web version of this article.)
Table 3
Quantitative results regarding intergranular cracking susceptibility of iron and proton irradiated samples after CERT tests in simulated PWR primary water environment.
Sample Crack density (in cracks/mm2) Mean crack length (inmm)
3 dpa e Fe 302 ± 23 17 ± 2 7 dpa e Fe 293 ± 18 16 ± 2 2 dpa e H 316 ± 30 17 ± 2
a function of percentage increase in hardness for the 3 dpa e Fe, 7 dpa e Fe and 2 dpa e H samples. Despite their smaller penetration depth in material and lower increase in hardening, crack density observed in iron irradiated samples was remarkably similar to that in proton irradiated samples. The most prominent factors shown to be contributing in SCC of irradiated austenitic SSs, other than hardening (and irradiation induced defects), are Radiation Induced Segregation (RIS) and degree of localization [4e9]. No actual measurement of RIS was performed in this study. However, the irradiation temperatures used for both iron (450!C) and proton irradiation (350!C) were calculated by taking into account at least partially (see section3a) the required “temperature shift” to ensure RIS of same order of magnitude in all the samples [2]. Further investigation is required to ascertain this hypothesis. The degree of
localization of deformation at the grain scale is quantified in the next section.
3.5. Localized deformation
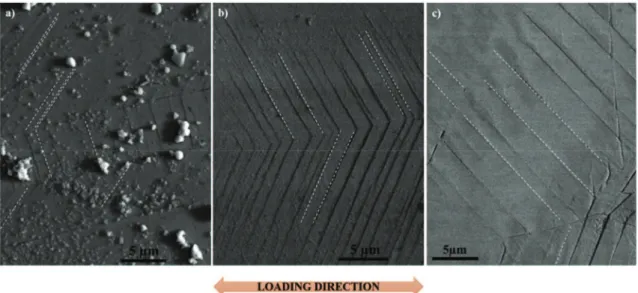
Surface analysis using SEM confirmed the presence of fine slip lines within grains in both unirradiated and irradiated regions of all the samples after subjection to plastic strain up to 4% at 340!C in PWR environment (Fig. 12). Slip lines (or surface steps) in unirra-diated region of the samples were hard to observe in the SEM especially at low magnification (Fig. 12a). In irradiated regions, they were readily visible (Fig. 12b), especially for proton irradiated samples.
Plastic deformation in austenitic stainless steel is heterogeneous Fig. 10. Crack length distributions obtained for 3 dpa e Fe (in blue), 7 dpa e Fe (in green) and 2 dpa e H (in red) samples. (For interpretation of the references to colour in this figure legend, the reader is referred to the Web version of this article.)
and irradiation has been reported to further enhance the hetero-geneous character of deformation at the grain scale [9,10,48]. To quantify the degree of deformation, parameters such as slip line height, width or spacing are generally used [6,9,16,48]. In this study, only slip line spacing was used to estimate the degree of localiza-tion in unirradiated and irradiated samples. The average slip line spacing was computed over 10 SEM images (around 25 grains) for each condition.6 The average spacing value estimated for the
unirradiated region of the samples was 0.9
m
m ± 0.2m
m. While the value for the irradiated region of 3 dpaeFe and 7 dpaeFe samples was 1.6m
m ± 0.1m
m and 1.7m
m ± 0.1m
m respectively. Higher spacing value in irradiated samples compared to their unirradiated counterparts reflects an increase in degree of localization with irradiation. The mean slip line spacing for strained 3 dpaeFe and 7 dpa e Fe samples was observed to be similar which could imply a saturation in the slip line spacing around these damage values. Increase in slip line spacing after heavy ion irradiation and satu-ration in the values for doses around 5 dpa has also been reported in Ref. [23] for 200 keV He and 2.8 MeV Fe.The mean slip line spacing for 2 dpa e H sample was determined to be 4.1
m
m ± 0.2m
m indicating a significant increase in spacing Fig. 12. SEM images of slip lines observed in the a) unirradiated region b) irradiated region of 3 dpaeFe sample c) irradiated region of 2 dpaeH sample post to 4% plastic strain. Few slip lines are indicated by white dashed lines. Loading direction is indicated in the figure.Fig. 13. Slip line spacing distribution obtained for 3 dpa e Fe and 7 dpa e Fe irradiated and 2 dpa e H samples post to CERT up to 4% plastic deformation.
6 Reproducibility of the results was ensured by estimating the spacing values on
three different unirradiated samples and on 3 dpa - Fe sample strained to 4% plastic strain in inert environment [23,28].
value resulting from proton irradiation. Fig. 13 shows slip line spacing distributions obtained for the irradiated zones of the 3 dpa e Fe, 7 dpa e Fe and 2 dpa e H samples. The mean spacing value in 2 dpa e H sample was much higher compared to the value in 3 dpa e Fe and 7 dpa e Fe samples. In Refs. [16] and [23], authors have reported to observe a similar trend and attributed this difference to the different penetration depths (or to be precise damage depth relative to the grain size) of two ions in the material. In this study, the value of damage depth relative to the grain size was 0.09 (i.e. less than 1/3 of the grain was irradiated) for iron irradiated samples and 0.74 (i.e. more than 1/3 of the grain was irradiated) for proton irradiated samples. Based on the explanation given in Ref. [16], this implies that the majority of the slip lines observed on the surface of the iron irradiated samples originated in the underlying unirradi-ated material. Whereas in proton irradiunirradi-ated sample, the nucleation of channels in the irradiated region, independent of underlying unirradiated material, was dominant process. Hence, the slip line spacing values were significant in the latter.
Note that the increase in hardness in proton irradiated sample was also significantly higher in comparison to increase in iron irradiated samples. Disregarding the effect of damage depths relative to grain size ratio, Gururaj et al. [49] proposed a theoretical formula to derive the minimum slip line spacing in irradiated material which is written for pure traction:
l (Dg k $ $ $ $ $ ln
t
IIIþ Ss 2 Ss
!$ $ $ $ $ (5)where Dgis the grain size, S the Schmid factor,
s
the applied uni-axial stress,t
III is the threshold stress for cross-slip activation (supposed to be independent of irradiation), and k z 5 a numerical pre-factor. While deducing the formula, two considerations were made: 1) dislocation glide in irradiated materials requires over-coming sessile irradiation defects, thus cross-slipping back and forth to primary plane. 2) Dislocation channels create back stresses that prevent such cross slips over a characteristic distance.To compute typical slip line spacing values for the irradiated samples used in this study, the mean grain size Dg¼ 27
m
m,t
III¼ 40 MPa [49] and a maximal Schmid Factor of 0.57were used. To estimate the stress in the irradiated layer (s
irrad), contribution from irradiation hardening was added in the uniaxial stress applied to the sample (corresponding to the unirradiated material,s
UIYS). The
correlation used to calculate the stress in the irradiated layer was:
s
irrad¼s
UIYSþ 3.03
D
Hv. Using these parameters, equation(5)gives lFe¼ 2.9m
m and lH¼ 3.3m
m. These calculations imply that the slip line spacing in the 2 dpa e H samples (lH) should be greater than 3.3m
m which is consistent with the value obtained experimentally (4.1m
m) in this study. However, the values obtained for 7 dpa e Fe samples experimentally (1.7m
m) were lower than the values pre-dicted by the formula ((2.9m
m) implying formula overestimated the values. One possible explanation is that eqn.(5)was derived based on the analysis of the bulk dislocation dynamics simulations whereas the damage depth relative to grain size for iron irradiated sample was small which might change the slip line spacing as discussed in Ref. [16].Despite higher degree of localization (or higher spacing value) in 2 dpa e H sample compared to 3 dpa e Fe and 7 dpa e Fe sample, the crack density in the irradiated region of all of these samples was similar. These results imply that for the irradiation and straining conditions used in this study, a direct proportionality between the
degree of localization and the cracking susceptibility of material is not observed. Indeed, grain boundary cracking is a consequence of combined effect of mechanical loading and degradation of grain boundary strength (via oxidation or Radiation Induced Segrega-tion). At this stage, two hypothesis can be proposed to justify the observation of similar crack densities in iron and proton irradiated samples. Firstly, for a given grain boundary strength, stresses at the grain boundaries were similar (despite the difference in spacing values observed) in both cases which resulted in similar propensity of grain boundaries towards cracking. Indeed, in Ref. [19], Millier has reported to observe a better reciprocity between the local stress state and cracking susceptibility than the local deformation state. However, this hypothesis is yet to be validated. Second hypothesis imply that the grain boundary strength was different in iron and proton irradiated samples. This could be attributed to the difference in degree of RIS and/or oxidation in both cases which can influence the extent of embrittlement of grain boundaries. Nevertheless, further investigations, especially in the direction of microchemistry measurements at the grain boundaries, are required for a better understanding.
4. Conclusions
Solution annealed 304 L samples were irradiated using 10 MeV Fe5þions at 450!C to 3 dpa and 7 dpa and using 2 MeV Hþions at 350!C to 2 dpa. This study presents the comparison of irradiation ion type on the resulting microstructure, hardening, localized deformation and IGSCC susceptibility in nominal PWR environ-ment. The following conclusions can be drawn:
* Irradiation induced microstructure of ion irradiated SA 304 L consisted primarily of Frank loops irrespective of irradiation ion used. The density of these defects was lower in iron irradiated samples compared to proton irradiated sample. This difference is attributed to the higher irradiation temperature used in the former.
* Nanoindentation tests indicated an increase in bulk hardness with irradiation irrespective of irradiation type and was linked to the irradiation induced defects in the microstructure. While increase was 50e60% in iron irradiated samples, it was 120% in proton irradiated samples. Correlation between increase in hardness and defect density observed was further validated using dispersion barrier model. It is thus recommended to not use the dose as a reference parameter when comparing ion ir-radiations done at different temperatures and dose rates. * Degree of localization was estimated by measuring the slip line
spacing in all the samples. An increase in slip line spacing with irradiation was observed in both iron and proton irradiated samples indicating an increase in degree of localization with irradiation irrespective of irradiation ion type.
* Slip line spacing value was significantly higher in proton irra-diated sample compared to iron irrairra-diated sample showing a higher degree of localization in the former. Similar trend has been reported in literature and has been attributed to the dif-ference in the damage depth to the grain size ratio for the two irradiation
* Plastic straining up to 4% plastic strain in PWR environment produced intergranular cracking on the surface of ion irradiated samples. An increase in cracking susceptibility of SA 304 L with irradiation was observed irrespective of irradiation ion type. Quantitative analysis performed on irradiated samples post to straining led to a similar mean crack density and crack length values for both irradiations.
* Despite different mechanical properties (as measured by hard-ness) and plasticity mechanisms (as measured by degree of
7 Due to the large number of slip systems in FCC material, and in the absence of
crystallographic texture, most of the grains have a Schmid Factor close to the maximal value of 0.5.
localization), very similar qualitative and quantitative inter-granular cracking was observed, revealing a similar suscepti-bility to IGSCC for the two types of irradiated samples. This similar behavior towards cracking could be attributed to a grain boundary strength difference between the two types of irradi-ation. It would be interesting to assess this hypothesis by micromechanical characterization of grain boundaries as shown in Refs. [50,51].
This study provides an evidence that despite their small pene-tration depths in material, it is possible to study crack initiation behavior in austenitic stainless steel using iron irradiation. Using iron irradiation will be beneficial for a better understanding of IASCC mechanisms, allowing to explore other contributing factors than the ones assessed for example in proton irradiations. Acknowledgement
The authors would like to thank Y. Serruys, E. Bordas, team JANNuS (DMN/JANNUS, CEA Saclay) for their support and assis-tance in conducting Fe irradiation and Ovidiu Toader (University of Michigan) for conducting proton irradiation. The authors would also like to acknowledge M. Rousseau (DPC/SCCME, CEA Saclay) for carrying out CERT tests, S. Poissonnet (DMN/SRMP, CEA Saclay) for her assistance in nano-indentation testing, M. Jublot (DMN/SRMA, CEA Saclay) for his supervision during FIB sessions and F. Barcelo (DMN/SRMA, CEA Saclay) for conducting EBSD analysis.
References
[1] P.M. Scott, M.C. Meunier, D. Deydier, S. Silvestre, A. Trenty, in: R.D. Kane (Ed.), Environmentally Assisted Cracking: Predictive Methods for Risk Assessment and Evaluation of Materials, Equipment and Structures, ASTM STP 1401, American society for testing and materials, 2000.
[2] G. Was, Fundamentals of Radiation Materials Science: Metals and Alloy, Springer, 2007.
[3] B. Tanguy, Rev. M!etall. 108 (2011) 39e46.
[4] S.M. Bruemmer, E. Simonen, P.M. Scott, P.L. Andersen, G.S. Was, J.L. Nelson, J. Nucl. Mater. 274 (1999) 299e314.
[5] G.S. Was, J.T. Busby, Phil. Mag. 85 (2005) 443e465.
[6] H. Nishioka, K. Fukuya, K. Fujii, Y. Kitsunai, J. Nucl. Sci. Technol. 45 (2008) 274e287.
[7] O.K. Chopra, A.S. Rao, J. Nucl. Mater. 409 (2000) 283e288.
[8] W. Karlsen, G. Diego, B. Devrient, J. Nucl. Mater. 406 (2010) 138e151. [9] Z. Jiao, G. Was, J. Nucl. Mater. 408 (2011) 246e256.
[10] G. Was, Z. Jiao, J.T. Busby, Fracture of Nano and Engineering Materials and Structure, Springer, 2006.
[11] P.L. Anderson, F.P. Ford, Mater. Sci. Eng. A 103 (1988) 167e184. [12] G.S. Was, S.M. Bruemmer, J. Nucl. Mater. 216 (1994) 326e347.
[13] G.S. Was, R.S. Averback, Radiation Damage Using Ion Beams, Elsevier, 2012. [14] R.D. Carter, D.L. Damcott, M. Atzmon, G.S. Was, E.A. Kenik, J. Nucl. Mater. 205
(1993) 361e373.
[15] B.H. Sencer, G.S. Was, M. Sagisaka, Y. Isobe, G.M. Bond, F.A. Garner, J. Nucl. Mater. 323 (2003) 18e28.
[16] Z. Jiao, G.S. Was, T. Miura, K. Fukuya, J. Nucl. Mater. 452 (2014) 328e334. [17] A. Lupinacci, K. Chen, Y. Li, M. Kunz, Z. Jiao, G.S. Was, J. Nucl. Mater. 458 (2015)
70e76.
[18] G.S. Was, J.T. Busby, T. Allen, E.A. Kenik, A. Jenssen, S.M. Bruemmer, J. Gan, A.D. Edwards, P.M. Scott, P.L. Andersen, J. Nucl. Mater. 300 (2002) 198e216. [19] M. Millier, PhD Thesis, Mines Paris Tech, (2012).
[20] K.J. Stephenson, G.S. Was, J. Nucl. Mater. 456 (2015) 85e98. [21] J.I. Cole, S.M. Bruemmer, J. Nucl. Mater. 225 (1995) 53e58.
[22] A. Etienne, M. Hernandez-Mayoral, C. Genevois, B. Radiguet, P. Pareige, J. Nucl. Mater. 400 (2010) 56e63.
[23] T. Miura, K. Fujii, K. Fukuya, Y. Ito, J. Nucl. Mater. 386e388 (2009) 210e213. [24] J. Gupta, J. Hure, B. Tanguy, L. Laffont, M.-C. Lafont, E. Andries, J. Nucl. Mater.
476 (2016) 82e92.
[25] R.-S. Wang, C.-L. Xu, X.-B. Liu, P. Huang, Y. Chen, J. Nucl. Mater. 457 (2015) 130e134.
[26] F.B. Pickering, in: Proceedings of the Conference on Stainless Steels 84, Gothenberg, Sweden, 1984, p. 2.
[27] R.E. Stoller, M.B. Toloczko, G.S. Was, A.G. Certain, S. Dwaraknath, F.A. Garner, Nucl. Inst. Meth., B 310 (2013) 75e80.
[28] ASTM Designation E 521-89, Annual Book of ASTM Standards, Vol 12.02, American Society for Testing and Materials, Philadelphia, PA, 1989, p. D-9. [29] L. Beck, Y. Serruys, S. Miro, P. Trocellier, E. Bordas, F. Lepr^etre, D. Brimbal,
T. Loussouarn, H. Martin, S. Vaubaillon, S. Pellegrino, D. Bachiller-Perea, J. Mater. Res. 30 (2015) 1183e1194.
[30] J. Gupta, Phd thesis, Universit!e de Toulouse, 2016.
[31] D.L. Damcott, J.M. Cookson, V.H. Rotberg, G.S. Was, Nucl. Inst. Meth., B 99 (1995) 780e783.
[32] A. Renault, J. Malaplate, C. Pokor, P. Gavoille, J. Nucl. Mater. 421 (2012) 124e131.
[33] A. Renault, C. Pokor, J. Garnier, J. Malaplate, in: Proceedings of 14th
Interna-tional Conference on Environmental Degradation of Materials in Nuclear Po-wer Systems, Virginia, 2009, p. 1324.
[34] C. Pokor, Y. Brechet, P. Dubuisson, J.P. Massoud, X. Averty, J. Nucl. Mater. 326 (2004) 19.
[35] D. Kiener, A. Minor, S.A. Maloy, P. Hosemann, J. Nucl. Mater. 27 (2012) 266e286.
[36] K. Yabuuchi, Y. Kuribayashi, S. Nogami, R. Kasada, A. Hasegawa, J. Nucl. Mater. 446 (2014) 142e147.
[37] T. Miura, K. Fujii, K. Fukuya, K. Takashima, J. Nucl. Mater. 417 (2011) 984e987. [38] S.J. Zinkle, P.J. Maziasz, R.E. Stoller, J. Nucl. Mater. 206 (1993) 266e286. [39] C. Pokor, Y. Br!echet, P. Dubuisson, J.P. Massoud, X. Averty, J. Nucl. Mater. 326
(2004) 19e29.
[40] B. Michaut PhD thesis, Universit!e de Paris Saclay, 2017. [41] M. Horiki, M. Kiritani, J. Nucl. Mater. 212e215 (1994) 246e251.
[42] Y. Huan, F. Zhang, K.C. Hwang, W.D. Nix, G.M. Pharr, G. Feng, J. Nucl. Mater. 54 (2006) 1668e1686.
[43] D. Hunn, E.H. Lee, T.S. Byun, L.K. Mansur, J. Nucl. Mater. 282 (2000) 131e136. [44] M. Saleh, Int. J. Plast. 86 (2016) 151e169.
[45] C. Xu, L. Zhang, W. Qian, X. Liu, Nucl. Engg. Tech. 48 (2016) 758e764. [46] C. Pokor, Y. Br!echet, P. Dubuisson, J.P. Massoud, X. Averty, J. Nucl. Mater. 326
(2004) 30e37.
[47] J.T. Busby, M.C. Harsh, G.S. Was, J. Nucl. Mater. 336 (2005) 267e278. [48] Z. Jiao, G.S. Was, J. Nucl. Mater. 382 (2008) 203e209.
[49] K. Gururaj, C. Robertson, M. Fivel, Phil. Mag. 95 (2015) 1368e1389. [50] T. Miura, K. Fujii, K. Fukuya, J. Nucl. Mater. 457 (2015) 279e290.
[51] J. Dohr, D. E.J Armstrong, E. Tarleton, T. Couvant, S. Lozano-Perez, Thin Solid Films (2017) 17e22.