Any correspondence concerning this service should be sent
to the repository administrator: [email protected]
This is an author’s version published in:
http://oatao.univ-toulouse.fr/19118
To cite this version:
Yazdani, Morteza and Zaraté, Pascale and
Coulibaly, Adama and Kazimieras Zavadskas, Edmundas A group
decision making support system in logistics and supply chain
management. (2017) Expert systems with Applications, 88. 376-392.
ISSN 0957-4174
Official URL:
https://doi.org/10.1016/j.eswa.2017.07.014
Open Archive Toulouse Archive Ouverte
OATAO is an open access repository that collects the work of Toulouse
researchers and makes it freely available over the web where possible
A
group
decision
making
support
system
in
logistics
and
supply
chain
management
Morteza
Yazdani
a,∗,
Pascale
Zarate
a,
Adama
Coulibaly
a,
Edmundas
Kazimieras
Zavadskas
b a University of Toulouse, Institut de Recherche en Informatique de Toulouse (IRIT), Toulouse, Franceb Research Institute of Smart Building Technologies, Vilnius Gediminas Technical University, Lithuania
Keywords:
Group decision support system Fuzzy linguistic variables Logistic provider
Quality function deployment Supply chain
Technique for order preference by similarity to ideal solution
a
b
s
t
r
a
c
t
Purpose: The paperproposesadecision supportsystemforselectinglogistics providersbasedonthe qualityfunctiondeployment(QFD)andthetechniquefororderpreferencebythesimilaritytoideal solu-tion(TOPSIS)foragriculturalsupplychaininFrance.Theresearchprovidesaplatformforgroupdecision makingtofacilitatedecisionprocessandchecktheconsistencyoftheoutcomes.
Methodology: The proposed model looks atthe decision problemfrom twopoints ofview consider-ingbothtechnicalandcustomerperspectives. Themaincustomercriteriaareconfidenceinasafeand durableproduct,emissionofpollutantsandhazardousmaterials,socialresponsibility,etc.Themain tech-nicalfactorsarefinancialstability,quality,deliverycondition,services,etc.basedontheliteraturereview. Thesecondstageintheadoptedmethodologyisthecombinationofqualityfunctiondeploymentandthe techniquefor orderpreferencebysimilaritytoidealsolution toeffectively analyzethedecision prob-lem.InfinalsectionwestructureagroupdecisionsystemcalledGRoUpSystem(GRUS)whichhasbeen developedbyInstitutdeRechercheenInformatiquedeToulouse(IRIT)intheToulouseUniversity.
Results: Thispaperdesignsagroupdecisionmakingsystemtointerfacedecisionmakersandcustomer valuesinordertoaidagriculturalpartnersandinvestorsintheselectionofthirdpartylogisticproviders. Moreover,wehavefiguredoutadecisionsupportsystemunderfuzzylinguisticvariablesisabletoassist agriculturalpartiesinuncertainsituations.Thisintegratedandefficientdecisionsupportsystemenhances qualityandreliabilityofthedecisionmaking.
Novelty/Originality: Thenoveltyofthispaperisreflectedbyseveralitems.Theintegrationofgroup multi-criteriadecision tools enablesdecision makersto obtainacomprehensive understanding of customer needsandtechnicalrequirementsofthelogisticprocess.Inaddition,thisinvestigationiscarriedout un-deraEuropeancommissionprojectcalledRiskandUncertainConditionsforAgricultureProductionSystems
(RUC-APS)whichmodelsrisk reductionand eliminationfromtheagriculturalsupplychain. Ultimately, wehaveimplementedthedecisionsupporttooltoselectthebestlogisticprovideramongFrance logis-ticsandtransportationcompanies.
1. Introduction
Knowledge-baseddecisionmodelsaregettingsignificant atten-tion inacademia andindustry.Avastamountoforiginalresearch andthesisprojectshavebeencarriedoutinordertomakerobust decision support systems(DSS) to facilitatemanagerialdecisions. Decision Support Systems are categorized as a specific class of computerized informationsystem that supports management de-cision making activities. By the early 1970s, the concept of
de-∗ Corresponding author.
E-mail addresses: [email protected] , [email protected]
cision support systems had beenconceived through the work of ScottMorton.Theapproach triesto analyzestrategicdecisionsto offersupport to decisionmakers (DMs) ina complex andpoorly structuredsituation.DSSshavesomeadvantages indecision mak-ing process through assisting decision makers in their tasks and improvingquality of decisionprocess (Zarate, 2013). Theconcept ofDSS comes from a balance betweenhuman judgment and in-formation process by a computer. There are three fundamental components of DSSs. Firstly; there is database management sys-tem(DBMS) whichserves asa databankfortheDSS.Thesecond componentisModel-basedmanagement system(MBMS).Therole ofMBMSisanalogoustothat ofa DBMSand, finally themethod of dialog generation and management system (DGMS) (Erfani, (M. Yazdani), [email protected] (P. Zarate), [email protected] (A. Coulibaly),
[email protected] (E.K. Zavadskas). http://dx.doi.org/10.1016/j.eswa.2017.07.014
Afrougheh, Ardakani, & Sadeghi, 2015; Power,Sharda & Burstein, 2015;Khademolqorani&Hamadani,2013;Marakas,2003).
Theselectionoflogisticsproviders(LPs)isanemergenceof to-day’scompetitivemarket.Withthedevelopmentandadvancement of the supply chain theories, the selection of logistic providers for the function of logistics support becomes considerable. Over the last decades, the direction of decision support systems has changed drastically. Computer and industrial professionals made efforts to systematize decision making process in manufacturing andproductionsectors(Guo,Ngai,Yang,&Liang,2015).For exam-ple, Zha, Sriram,Fernandez, andMistree (2008)modeled a com-promise decision support problem technique and the fuzzy syn-thetic decisionmodel (FSD)to quantitatively incorporate qualita-tive design knowledge and preferences ofdesigners formultiple, conflicting attributes. They argue that the model is generic and flexibleenoughtobeusedinavarietyofdecisionproblems. Appli-cationofadecisionsupportsysteminsupplychainsbyemploying multi-criteria decision-making isa constant challenge (Kristianto, Gunasekaran,Helo,&Sandhu,2012;Scott,Ho,Dey&Talluri,2015; Shi, Yan, Shi, & Ke, 2015). Integrated models are highly appreci-atedbecauseeachmethodhasauniquefunction.However, choos-ingthemostaccurateapproachisoftenadilemmaandintriguing practical questionfaced bysupplychain managers.An unsuitable integratedmodelcancauseterribleresultsandfailure ofthe sys-tem.
To adopt a reliable and practical decision making model, we proposetheintegrationofqualityfunctiondeployment(QFD)and techniquefororderpreferencebysimilaritytoidealsolution (TOP-SIS)withaidoffuzzylinguisticvariables madeby groupof deci-sionmakers. Fromthetechnicalandpractical viewpoint,the pro-posedmodelhassomeadvantageswhenitapproachesagroup de-cisionsystemwithsuchcombination.InMCDMmodeling,itis rec-ommendedtoweightdecisionfactors(attributes)usingcombined structures (Tavana,Yazdani,& Di Caprio,2017).In manydecision making problems,thereliability ofthedecisioncriteria is strictly dependent onthestakeholdersandcustomers’preferencesas ex-ternal weights.It istoughforcustomersto deliverjudgmentsvia solid and numericalvalues.Fuzzy linguisticvariables allow usto assure the quality of judgment and then fuzzy MCDM conducts optimalproceduretofinal objectives.Anefficientandflexible de-cision tool whichis ableto findoptimalweights ofcustomer at-titudes istheQFD model.Itassures aconvenient andcompatible decisionmakingprocess.
Thepaperisarrangedasfollows:afterthisintroduction,the lit-erature review on supply chainis presented.Then applicationof decision models in agriculture projects is reported in Section 3. Theproposedmultiplecriteriadecisionmethodswillbedescribed as Section 4. Then decision frames and a case study for logistic providerselectionareaddressedinSection5.Section6represents the results and sensitivity analysis tests. Section 7 will interpret the GRUS system implementation and conclusion is reported in Section8.
2. Literaturereviewandrelatedworks
2.1. SupplychainandlogisticsmanagementviaDSSs
Asupply chainisdefinedasa process withacomplete setof activities whereinraw materials are transformed into final prod-ucts,thendeliveredtocustomersbydistribution,logistics,and re-tail.Allinter-organizationalpracticesasplanning,purchasing, dis-tribution,deliveryprocess,andreverselogisticsaretakeninto ac-countasasupplychainmanagementsystem(Brandenburg, Govin-dan, Sarkis,& Seuring,2014;Fahimnia,Sarkis,&Davarzani,2015; Yazdani,HashemkhaniZolfani,&Zavadskas,2016).Inaddition, out-sourcing phenomena emerged in the supply chain to optimally
manageallthosepracticesandinthisway,thephysicaland infor-mationflowexchangedamongallplayersinasupplychain(Konig &Spinler,2016).
Development ofthe newtheoriesandmethodologiesin logis-tics and supply chain management can lead to the higher level intelligent and advanced systems. Such kind of systems enable supply chain experts to facilitate information-sharing, high qual-ified decisions and to increase the value to products and ser-vices by internal coordination (Chandra & Kumar, 2000). Supply chainmanagementhastiedupwiththeapplicationofinformation technology (IT) which brings competitive advantages of knowl-edge sharingwithcustomersandstakeholderstoimprove coordi-nationandcommunicationamongsuppliersandpartnersfor com-panies(Ngai,Peng, Alexander,&Moon,2014).Theselectionof lo-gisticprovidersforthefunctionoflogisticssupportbecomes con-siderable. Over the last decades, the direction of decision sup-port systems has changed drastically. To monitor the materials cost inagarmentmanufacturer,adecisionsupportmodelhas as-sisted decision-makers in selecting efficient ways to reduce to-tal manufacturing costs (Wong & Leung, 2008). Couple ofreview projects has been conducted in terms of intelligent models, de-cision support tools and system in supply chain field (Seuring, 2013; Taticchi, Tonelli & Pasqualino 2013). Seuring (2013) argued that the performance ofsustainability and supply-chain manage-mentmustberesearchedpracticallybyastrategicdecision-making supportmodel.Liu,WangandLiu(2012) structureda sustainabil-ity analysis framework with the integration of life cycle assess-ment anda multi-criteriadecision-makingprocessto support en-vironmental, social andthe economicaspects ofthesupplychain management. Bhattacharya,Mohapatra,Kumar,Dey,Bradyand Ti-wari(2014)demonstratedagreensupplychainperformance mea-surement perspective andmade an effort to deliver a collabora-tive decision-making model using fuzzy analytical network pro-cess. Accorsi, Manzini, and Maranesi (2014) developed an origi-naldecision-supportsystemforthedesign,management,and con-trol of warehousing systems with solid DBMS architecture. Guo et al. (2015) proposed radio frequency identification -based in-telligent decision support system to handle production monitor-ing and scheduling in a distributed manufacturing environment. A decisionmodel for supplier selection andin stochastic, multi-stakeholder and multi-criteria environments has been build, but theresearchdidnotofferanyrealDSS(Scottetal.,2015).Arecent decisionsupporttoolforpurchasingmanagementinvestigatedthat the capital-constrainedretailer’spurchasetiming, quantityand fi-nancingdecisionsarenecessaryforseasonalproducts(Shi,Guo,& Fung,2017).
3rd party logistic providers (3PLP) are recognized as compa-nies orenterprisesthat perform thevarious logisticsactivities of a customer either completely or only in part by transportation, such asocean orshippingfreight,aircargo,truckfreightor stor-ing in warehousefacilities. The logistic providerhas beenwidely promoted by the concept of outsourcing. Logistics outsourcing is mainly concerned with cost reduction andimprovement (Rajesh, Pugazhendhi, Ganesh, Ducq,& Koh, 2012).Aguezzoul (2014) clas-sified logistic process to transportation, distribution, warehous-ing,inventorymanagement,packaging,andreverselogistics.Allof thosecategoriescanbeoutsourcedbyalogisticprovider.
Supply chain success highly depends on the commitment of sub-systemsperformances.Acompletesupplychainhappenswhen the sub system functions work accurately and try to eliminate diagnoses from design, production and distribution to the logis-tics and transportation (Govindan, Palaniappan, Zhu, & Kannan, 2012). Inassessingtheperformance ofanAgri-food supplychain, a performance measurementsystemcan be establishedto enable a firm tomonitortherelevant performanceindicatorsof logistics processes inan appropriate timehorizon (Bosona&Gebresenbet,
2013).Partnersinthesupplychainareconfrontedwithconflicting goalsmakingtheperformanceevaluationmorecomplex.Therefore, when thesupplychain isfaced withoutsourcingparts oflogistic functions,evaluating,selectingandcontractingathirdparty logis-ticsproviderwouldbeacrucialproblem(Aguezzoul,2014;Diabat, Khreishah,Kannan,Panikar,&Gunasekaran,2013).
In the 60s, academics began to work on quantitative models to computerize decisionmakingandassist policy makersand in-vestors (Holt & Huber, 1969; Turban, E., & Watkins, 1986). Par-ticular projects were directed on logistic provider evaluation us-ingdecisionmakingmodelsandtools.Multi-criteriadecision mak-ing hasaided academicsandindustrialpractitioners intheir deci-sionsinsuchfieldsfromeconomyandmanagementtoengineering andmanufacturing(Carvalho,Varela,Putnik,Hernández,&Ribeiro, 2014). Zavadskas, Turskis, Vilutien˙e, and Lepkova (2017) verified the role of analytical MCDM tools including ARAS, TOPSIS to the problemoffacilitymanagement strategyselection.Gupta and Walton (2016)explored the applicabilityofinterpretive structural modeling(ISM)intheselectionofthirdpartylogisticprovidersby twelve main criteria (cost, reputation, quality, locations, collabo-ration and range of services etc.). Dweiri, Kumar, Khan, and Jain (2016) designedan AHPmodel to assist the automotive industry inthesupplier selectionproblem.Theauthorsusedexpert choice software andsolved thedecisionproblem. It mustbe statedthat evenexpertchoiceisaformerlydevelopedsoftwarepackage rely-ing on AHPandhassome shortagesthat other methods (TOPSIS, VIKOR,etc)cannot beimplementedonit.Severalstudieshave ac-complished integrateddecisionstructures forlogisticproviders as well.Hashemian,Behzadian,Samizadeh,andIgnatius(2014) intro-duced a fuzzy AHPand PROMETHEE decisionsystem to increase the quality of the supplier evaluation system. Theydid not pro-pose an applied decisionsupport tool andthe modelwill failure when large amount to data must be analyzed. Akman and Bay-nal (2014) worked on an integrated model of AHP and TOPSIS in fuzzy environments. Yayla, Oztekin, Gumus, and Gunasekaran (2015) combinedfuzzyAHPandTOPSIStoachievean optimallist of third party transportation providers. AHPcan be an appropri-ate choice, butdespiteits capability, it isunable to connect cus-tomer valuestothedecisionmaking process.Inother side,while the studyneeds tosatisfycustomersandstakeholdersdemandto reachasustainablesupplychain,utilizationofAHPseemsuseless. Therefore, weuseQFD duetoits abilityto conduct interrelation-ship amongdecisionfactorsandcustomer factors.Inanotherway, torefuseAHPpairwisecomparison, computationsandcomplexity, QFD brings the more reliable approach that can be combined to MCDMmethodsquickerandwithlessdifficulty(Ignatius,Rahman, Yazdani,Šaparauskas,&Haron,2016).PiltanandSowlati(2016) de-velopedamodeltosupportdecisionwithaimofevaluating part-nershipperformanceinBritishColombia,Canada.Theirstudy cor-relates toa modelto supportdecisionandsurprisingly istoofar fromadecisionsupportsystemstructureanddefinition.Intotal,it hasbeenobservedthatseveralpapershavefocused onjustan in-dividualoranintegrateddecisionmakingmodelandnot evenan efficientdecisionsupportsystem.
2.2. Collaborativedecisionmaking
By 1967, Morton built, implemented, and realized a model-drivenDSSwhichwasagreatachievementinDSSliterature.Gorry andMorton(1971)definedtheterm“decisionsupportsystem” as systems that assist decision makers in semi-structured and un-structured decision problems. Later, Alter and Alter (1980) sug-gested a thinking framework forboth management andbusiness DSSs.Theysuggestsixcategories:(a)filedrawersystems,(b)data analysis systems, (c)accountingand financial systems,(d) repre-sentational systems, (e) optimization systems, and (f) suggestion
systems. In 1982, Sprague and Carlson (1982) defined DSSs asa class ofinformationsystem that draws ontransaction processing systemsandinteractswiththeotherpartsoftheoverall informa-tionsystemtosupportthedecisionmakingactivitiesofmanagers and other knowledge workers in organizations. Ic and Yurdakul (2009)distinguishedtheseitems;robustness,easeofcontrol, sim-plicity,andcompletenessofrelevantdetailforevaluationofDSSs. Bonczek,Holsapple,andWhinston(2014)introducedaframework to understand fourmajor design aspects that affect all DSSs: (a) language system, (b) presentation system, (c) knowledge system, (d) problemprocessingsystem.
There are five specific Decision Support System types which has been proposed by Power (2015); 1) communications-driven, 2) data-driven, 3) document-driven, 4) knowledge-driven, and5) model-drivensystems.Communications technologies arecentered in communications-driven DSS for supporting decision-making (Kou,Shi,&Wang,2011).Data-drivenDSSprovidesaccesstolarge datastores andanalytics tocreate information.Document-driven DSS uses documents toprovide information fordecisionmaking. Knowledge-driven DSS are connected to expert systems or rec-ommender systems.A knowledge-driven DSS emphasizes solving a decision making problem using facts, cased-based reasoning, rules,procedures,andsimilarstructures (Zarate& Dargam,2015). Acommunication-drivenDSS facilitatesworkingona sharedtask byallowingsendingandreceivingdataamongagroupofdecision makers.Adata-drivenDSSassistsdecisionmakersbyproviding ac-cesstodataandsometimesmanipulationoptions(Sharma,Sarker, & Romagnoli,2011).Model-driven DSShandles quantitative mod-els for functionalityand workson data manipulation and analy-sis usingmathematicalmethods foroptimization, simulation,etc. (Lei & Moon, 2015;Zhang & Goddard, 2007). Most model-driven DSSsareone individualuseronly;ontheotherhand,data-driven DSSsareusedbymultipleusersacrossorganizations.A document-drivenDSSconcentratesonmanaging,andmanipulationofdatain variouselectronicformats(Baumeister&Striffler,2015).
A collaborative knowledge base system is a communication module composing of several elements which represents various functionsthat the module should perform forthe problem solv-ingstages.Theelementsarecontrollingfunction,application con-troller, communication manager and a user update module. This collaborativeknowledge basesystem illustrates a base for devel-opmentofacooperativeDSS(Hernández,Lyons,Zarate,&Dargam, 2014).
2.3.Knowledgesignificance
A supply chain management can be called sustainable if it is applied to all relevant supply chain aspects: environmen-tal product design, natural resource and energy efficiency, final product guarantee, after sale service, employment ethical issues, reusing/recyclingdesignandreverselogistics(Tavanaetal.,2017). These itemsare basically configured froma customer viewpoint. Allthosesupplychainaspectsaresubjectsthatmustbeconsulted and negotiated with aid of customers/stakeholders. In this man-ner,arguing customer values andthen convertingthem into the supplychain factors in thispaper not even pushesforward sup-plychaintowardaglobalandsustainableappearance;itenhances thesignificanceoftheresearchfromacustomer-basedperspective. Moreover, even though many studies emphasize the influence of traditionalsupplychaincriteria onthelogistic provider’sprocess, none of them deals with a decision support system with inclu-sion of customer variables, their affection on each other and on supply chain attitudes. This is the reason we try to adopt qual-ity function deployment which is a structured and well-known customer-drivenproduct design technique whose basictask isto translate customer ideals to technical logistic and supply chain
criteria (Chen, Ko, & Yeh, 2017; Zaim, Sevkli, Camgöz-Akda˘g, Demirel, Yaylaetal.,2014). Althoughsome studiesshowed inter-est on involving customer values in supply chain systems, how-ever, inthe caseof integratingcustomer dimensionsinto the lo-gisticproviderdecisionprocess andtoobtaincriteria importance, there was not significant research in terms of logistic provider’s evaluationandselection.
We believe that our research is unique and brings sufficient contributions in area of supply chain due to the following rea-sons:Despiteofmanyarticlesemployedintegratedandintelligent toolsinorderto comparetheperformance ofsuppliers and logis-tic providers, none ofthem designeda platform orprototype of a DSS for their objectives. Whilst the existing literature noticed no particular study assigned to the modelling of a DSS for the evaluationof logistic providers,we announce that ourGRUS sys-temwouldallowamoreholisticallysuccessfuldirectionon logis-ticdecisionmakingandthereforeamoresustainablesupplychain can be achieved. In addition of that, none of the decision sup-porttoolsinthepaststudies,tobestofourknowledge,reporteda customer/stakeholder-drivenapproachwithutilizationofQFD. Pre-vious research projects reportedlogistic provider’sassessment by differentperspectiveandfarfromcustomersatisfaction.Therefore, theseshortcomingsexisted inthe currentsupplychain investiga-tions will be capturedand resolved in thispaper. We adopted a decisionsupportsystemthroughtheintegrationofqualityfunction deploymentaidedbyfuzzyTOPSIS.Agroupdecisionmaking struc-turewithasystematicprocedurecanreducetheeffectofarbitrary decisionsby managingtensionamongdecisionmakersand accel-eratetheevaluationprocessusingarationalaggregationofgroup decisionsandapplicationofinformationtechnologyandcomputer programming. With confidence, it can be interpreted that this is the first DSS which combines QFD and fuzzyTOPSIS in order to evaluatelogisticserviceprovidersbyareal-worldproject.
3. Decisionmodelapplicationintheagriculturedomain
Risk andUncertain Conditions for Agriculture Production Sys-tems (RUC-APS, 2016) aims to provide knowledge advancing in agriculturalbased-decision making process torealizethe key im-pacts of every stage of the agriculture-related processes. The projecttitleis“EnhancingandimplementingKnowledgebasedICT solutions within high Risk andUncertain Conditions for Agricul-tureProductionSystems” .Thisimpliesthedevelopmentofahigh impact research project inorder tointegrate real-life based agri-culture requirements, alternative land management scenarios, as well as supporting innovation in the development of agriculture productionsystems,operations,logisticsandsupplychain manage-mentandtheimpactofthesesystemsovertheend-usersand cus-tomers.
RUC-APSstandsinaEuropeanCommissionprojectandaimsto modeldecisionsupportsystemstodealwithasustainable agricul-turesupply chainwithrespect torisk anduncertainty. Itimplies twenty three partners coming from seven countries. The call of project isH2020-MSCA-RISE-2015 in the economicsciences panel. The domain of the project covers theoretical studies, investiga-tion aswell technical achievements and several universities and research institutes are in collaboration. The contribution of the proposed methodis toimplementthe proposed decisionsupport model on a web-based decision making and voting tool called GRUS. This action widely facilitates decision making process and integrates role of information technology in supply chain man-agementmodeling.The projecthasdefinedsome scientific objec-tives (SOs)that among themSO5 is assignedto modeland
opti-mize innovative transport-logisticssolutions ofhorticulture prod-ucts across the full value chain structure. Hence, our proposed
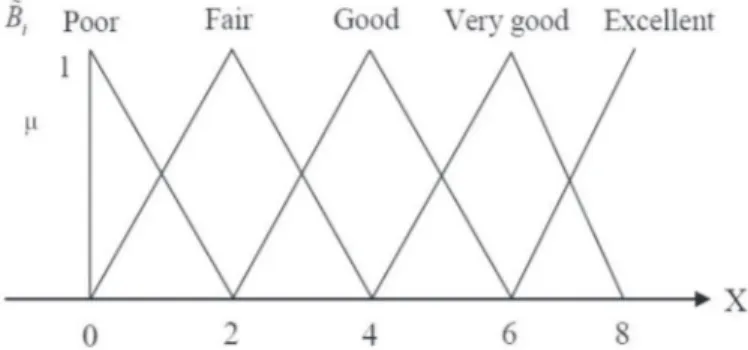
Fig. 1. Fuzzy linguistic terms for house of quality evaluation. modelisbeingimplementedinRUC-APSprojecttograsphighlevel ofefficiencyinsupplychain.
4. Proposedmethodologies
Intheproposedgroupdecisionmodel,severaltasksaredefined. Initially, weights of the decision criteria (e.g. weights of techni-cal supply chain requirements) are determined using fuzzy QFD. The second taskis to generate theranking of alternative logistic providersusingfuzzyTOPSIS.Thesuggestedalgorithmisexplained asthesesub-sections:
4.1. Afuzzyqualityfunctiondeploymentmodel
ThemajorstepstowardaQFD(Karsak&Dursun,2014;Yazdani, Chatterjee, Zavadskas, & Zolfani, 2017) modelcan be represented here:
Step1– Identifycustomerrequirements(CRs)andrelated tech-nical requirements (TRs) that influence theperformance of logisticprovidersinsupplychain(Table1).Table1 schemat-icallyexplainstheallocationofthecorresponding valuesof customerstothemostrelatedsupplychaintechnicalfactor. Asitisobserved,thefirstrowconsidersCRsandthecolumn isreferredtotheTRs.Thisoperationiscarriedoutusing lin-guisticvariablesprovidedbyTable2and3.
Step 2 – Understanding the importance of the customer re-quirementbyusingfuzzytriangularlinguisticsvariablesand fuzzy weighted average together with the correlation be-tween CRsandtechnical requirements.Afuzzysetis com-posedbyamembershipfunctionthatmapselementsto de-grees of membership within interval of [0, 1].If the value assigned lies within the interval, the element has a cer-taindegreeofmembership(itbelongspartiallytothefuzzy set).Fig.1exhibitsthestructureoftriangularfuzzynumbers thatareutilizedinthispaper(Tseng,Lim,Wu,Zhou,&Bui, 2017).
Step 3 – Computation offuzzy QFD weights for supplychain technicalrequirements.A normalizationruleisusedto de-liver normalizedweights of main decisioncriteria for final selectionprocess.
TheproposedapproachconductstheQFDmodel,theHouse ofqualitymatrictoconvertcustomerandexternalvariables into the technical factors.The detailof QFD model can be foundin(Germani,Mengoni,&Peruzzini,2012;Tavanaetal., 2017).FuzzyQFD(Zaimetal.,2014)modelinagroup deci-sion making environment has been established to connect customer needstoproductdesignsteps.Instep1, decision-makers are selected; alternatives, evaluation criteria, cus-tomer/stakeholders factorsand their characteristics are de-fined.Inthisstage,theentirerequirementfortheevaluation ofalogisticproviderinviewofstakeholdersandcustomers
Table 1
A sample fuzzy QFD matric and the relevant variables.
Table 2
Linguistic preference and the corre- sponding fuzzy numbers.
Linguistic terms Fuzzy number
Very poor (VP) (0,0,2) Poor (P) (0,2,4) Neutral (N) (2,4,6) Good (G) (4,6,8) Excellent (E) (6,8,8) Table 3
Linguistic values for weight of CRs.
Linguistic terms Fuzzy number
Very low (VL) (0,2,4)
Low (L) (2,4,5)
Medium (M) (4,6,8)
High (H) (6,8,10)
Very high (VH) (8,9,10)
aredeterminedandreviewed.Itshouldbedeclaredthatthe technical requirements are the instrument to achieve cus-tomersatisfaction.
Step 4 -A survey is performedinorder to realizeperception
ofcustomersandendusersregardingsatisfactionleveland degree of importance of customer requirementin the sec-ondstep.FuzzylinguisticvaluesasshowninTable2are de-fined to assign the degree of importance ofcustomer atti-tudesandtechnicalrequirements.Thereafterthoselinguistic valuesaretransferredtofuzzytriangularnumberstobe us-able forcomputationsteps. Using thisconversionform lin-guistic variables to fuzzy numbers allows decision makers to deal withambiguity andconflicted environments of de-cision process.We haveprovided aset offive-linguistic la-bels tofacilitateparticipationofdecisionmakers.The deci-sion makers have the role to choose linguisticvariables in ordertolaunchareliableandhighqualitydecision.The lin-guistic terms (Table 2) (Lee, Ru, Yeung, Choy, & Ip, 2015) such as “very poor”, “poor”, “neutral”, “good” and “Excel-lent” are utilized to present thelevel ofsatisfaction ofthe customer requirementandtechnicalsupplychaincriteria.It is evident that decisionmakers treat alternatives and rate
them different from decision factors. Therefore, to weight CRs,thefollowinglinguisticvariablesadoptedfromKannan, deSousaJabbour,&Jabbour,2014canbetakenintoaccount (Table3).
InGRUS systemwe haveestablished facilitatorand partici-pantroles(wecallDMorexpertsinsupplychain). Facilita-toris the leader in each decision stage to handle the sys-tem and coordinate with the participants. One of the ad-vantagesof GRUS systemis that theprocess of votingand presentingtheopinion ofDMs can beanonymous, soeach DMisaskedtousethisoptionduring thedecisionmaking. Asusual,therearesomeconflictsandissueslikewhenDMs havedifferentopinionaboutasubject,sothisanonymityin GRUS can cause them freely followthe evaluation process andnot to be afraid of further negative feedback, punish-mentorreactions.
Tocompletethequestionnaireandrunthedecisionmaking, wehaveinvited threeexperts,onefromagriculturesection, anotherexpertfromsupplychainandpurchasinganda pro-fessor of operations management. They have been invited andassignedauserandprofiletogothroughtheGRUS on-lineweb applicationand performthe questionnaire. When they finish the questionnaire, automatically facilitator can observe the aggregated opinion, calculations, and required solutions.Wehavebeenassuredthatexpertsarecompletely neutral and the process of evaluating logistic providers is completelyimpartial.
Step 5 - Due to participation of group of decision makers, an average triangular fuzzy numbers from q fuzzy num-bersis required. As the degree of importance of customer requirementsis being measured by sample of q individual
members based on their area of expertise. The qj
mem-ber expresses the weights of ith customer requirement,
wc˜i j=
(
w i j c1,w i j c2,w i jc3
)
.Usingtheseweightsandalsothe corre-lationjudgment betweencustomer requirements and tech-nical criteria thefinal weights fortechnicalfactors are ob-tained(Leeetal.,2015).˜ wc˜i j = Pq j=1wci j q =
(
Pqj=1wi jc1, Pq j=1w i j c2, Pq j=1w i j c3)
q =¡
wi c1,w i c2,w i c3¢
(1)Whereqisthetotalnumberofdecisionmakersandw˜c˜i j addresses
theimportanceweightsoftheithcustomerrequirement. Thetask
of QFD team members is to present their judgments by assign-ingdegreeofcorrelationbetweenCRsandTRs,c˜i j=
(
ci j1,ci j2,ci j3)
.Moreover, ˜ ci j= Pq k=1ci jk q =
(
Pqj=1ck i j1,P q j=1cki j2,P q j=1cki j3)
q =¡
ci j1,ci j2,ci j3¢
(2) In this equation cij is the strength of the contribution of jthtechnical requirement on the ith CR determined by QFD group. Triangularfuzzyvaluescan beconverted intocrispnumbers (de-fuzzification process) using the formula below (Cheng, 1999), if
˜
B=
(
b1,b2,b3)
:x=
(
b1+2b2+b3)
4 (3)
Inthisstage,fuzzyweightedaverageisappliedtocomputethe technical requirement weightings for customer satisfaction (wCSe) bythefollowingequation:
(
wCSe)
= Pm i=1w˜c˜i jc˜i j Pm i=1w˜˜ci (4)4.2. Fuzzytechniquefororderpreferencebysimilaritytoideal solution
Indecision makingsystemsthere are situationsthat the solu-tion should be analyzed based on negative (worse) and positive (best or ideal) solutions. Then the distance from the ideal solu-tion canrealize theoptimaloption.TOPSIS isa user-friendlyand commondecisionmakingtool thathasthisadvantage.Asa well-known classical MCDA/MCDMmethod, it has received enormous attention from academic and industrial communities. The global interest in the TOPSIS method hasexponentially grown. The un-derlying logic ofTOPSIS is tomeasure the positive idealsolution (PIS) and negative ideal solution (NIS) and the optimal solution should have the shortest distance from the PIS and the farthest from the NIS (Tavana, Li, Mobin, Komaki, & Teymourian, 2016). TOPSIS hasbeencombined,extended andintegratedto other de-cision toolsand/or engineeringconcepts to supportdecision pro-cessinvariousapplicationsandcasestudies (Asadi,Sansoleimani, Fatehi,& Carranza,2016;Vinodhetal.2016;Wang,Zhu,&Wang, 2016).However,duetoimpreciseenvironmentsofthefrequent de-cisions, fuzzyTOPSIS model(Kannanetal.,2014;Zavadskas, Mar-dani,Turskis,Jusoh,&Nor,2016)requirespreliminarilyinformation abouttherelativeimportanceofthecriteriabyfuzzyvariables.The stepwiseprocedureforfuzzyTOPSISmodelisfollowedhere:
Step 1: Identify an initial fuzzy decisiontable including pref-erence judgment of supply chain experts. Let us consider a fuzzydecisionmatrix withagroup of kdecision makers
(D1,D2,D3,…Dk) considering m alternatives (A1,A2,A3,…Am)
andncriteria(c1,c2,c3,…cn)foraMCDMproblem.Therefore,
thefirstfuzzydecisiontableisexpressedasamatrix:
X= A1 A1 .. . A1
r11 r12 ... r1n r11 r11 ... r2n .. . ... ... ... rm1 rm1 ... rmn
(5)Inthisequationrmn istheratingofalternative Amwith
re-spect to criteria cn which is expressed as a linguistic
tri-angularfuzzynumber.Eachevaluator(decision expert)can evaluatethealternativesconsideringtothecriteriausingthe ratingsgiveninTable1.Tomakeanaggregatedmatricofall
the decision makers, Assume that a decision making com-mittee consists of k decision makers and the fuzzy rating ofeachdecisionmakercanberepresentedasapositive tri-angularfuzzynumberR˜k
(
k=1,2,....,K)
withamembershipfunction. In this way, the aggregatedfuzzy rating is mea-suredas:
˜
R=
(
a,b,c)
andk=1,2,....,Kwherea=Min{
ak}
,b= 1 k K X k=1 bkandc=Max
{
ck}
(6)Step2:Thisstepperformsthenormalizationprocessofthe ag-gregated fuzzydecisionmatrix.The data inthe aggregated fuzzydecisionmatrixarenormalizedtounifydifferent mea-surement scales. The normalized aggregatedfuzzy-decision matrixcanbenotifiedas:
˜
R=[r˜i j]m×n
Therefore,thenormalizedvaluesforbenefitandcostrelated criteriaarecalculatedusingthefollowingequations: ˜ ri j =
µ
a i j c∗ j ,bi j c∗ j ,ci j c∗ j
, j∈B c∗ j=maxci j, j∈B (7) ˜ ri j =µ
a− j ci j ,a − j bi j ,a − j ai j
, j∈C a− j =minai j, j∈C (8)AsithasbeenstatedTOPSISandgenerallyMCDMtools con-sider conflicting factors with different direction and opti-mizationobjectives.So,B andCarethe setsofbenefitand costcriteriarespectively.
Step 3: The weighted normalized fuzzydecision matrix vij is
calculated by multiplying the normalized matrix with the weights oftheevaluationcriteria.Theweightednormalized fuzzydecisionmatrixVisdefinedasfollows:
˜ V=
£
v
˜i j¤
m×nwherei=1,2,..,mand j=1,2,..,n (9)
Bythisequationweights ofdecisioncriteriaareincludedin decisionprocess;whilew˜jisthefuzzyweightsofjth
crite-ria.Inthispaperthefinalweightsoftechnicalrequirements (main criteria) havebeen already discussed and computed usingQFDprocessandformula(4);
˜
v
i j=r˜i j.w˜j (10)Step4:Measure thepositiveandnegative idealsolutions(PIS,
NIS)whichareshownby:(A∗,A−)
˜ A∗=
(
v
∗ 1,v
∗2,....,v
∗n)
v
∗j=max©
v
i jª
(11) ˜ A−=¡
v
− 1,v
−2,....,v
−n¢
v
− j =min©
v
i jª
(12) Wherei=1,2,..,mandj=1,2,..,nStep5:Toachieveanoptimalsolutionandmakeacompromise ranking, thedistances ofeach alternativefromNIS andPIS shouldbeconsidered; d∗ i =
s
n X j=1¡
v
˜ i j−v
˜∗j¢
2 i=1,2,..,m (13) d− i =s
n X j=1¡
˜v
i j−v
˜− j¢
2 i=1,2,..,m (14)Fig. 2. Decision making process for third party logistic providers’ evaluation.
Step6:Toproducerankingofalternativesandgettingfinal so-lutiontheclosenesscoefficientofeachalternativesmustbe calculated: CCi= d− i d− i +d∗i , i=1,2,..,m (15)
Therankingorderofallalternativesisdeterminedaccordingto thedescendingorderofCCi.ThealternativeAiwillbethebestonly
ifitsCCiindicateshighervalue.
5. Proposeddecisionframeworkandcasestudyexplanation
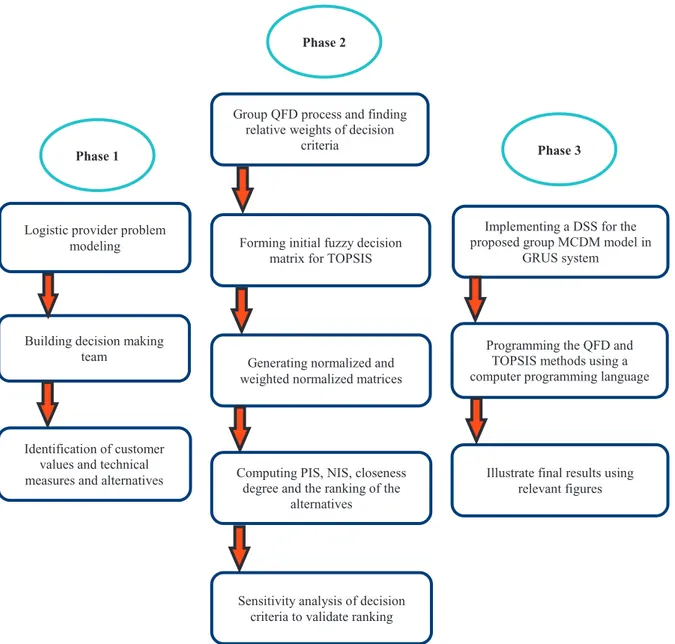
A decision making model for current study is pictured in Fig. 2.The fuzzyQFD-TOPSISphaseofthe proposed method pro-vides a window to implement costumerdriven weighting proce-dure fordecisioncriteria.Thisfunctionpermitsthesatisfactionof external stakeholdersand customers to thedecision process. We have considered three decision makers to deliver us their judg-ments over the above logistic providers with respect to the rel-evant factors to compose a decision system. Proposed model in Fig.2iscomposedofthefollowingphases:
Phase1-Inthisphase,theessentialCRsandthe
correspond-ing technical criteria forassessment of the third party lo-gisticprovidersisinterpretedandintroduced.Moreover,the alternativesofthedecisionproblem(logisticproviders)shall berecognized. The alternatives arereallogistics and trans-portationcompanies whichare active in Franceandwhole Europe.The decisionmaking team, expertsand users that mustparticipateinthisprojectareintroducedandcalled.
Phase2–Groupofexperts(DMs)expresstheir preference
us-ing the fuzzy linguistic variables provided in Table 2 and 3 by house of quality matrix and to rate performance of alternatives basedona questionnaire. The houseofquality matrixiscomposed andthree decisionmakers present the judgmentsto determine importance ofcustomers’ require-mentutilizingfuzzy values.Theyareasked toconsider re-lationshipandeffectcustomerattitudesontechnicalcriteria oflogisticprovidersinordertorealizethecorerelationand itsdegreebymeansoffuzzytools.
Ingeneraltherearethreetypesoftheweighting processin MCDM;subjective,objectiveandhybridapproach.Objective weightinglikeEntropy determineweightsbymakinguseof
mathematical models orstatistical methods.Subjective ap-proaches like AHP orSMART methods rely entirelyon the subjective judgments or intuition of DMs. Then it will be required to apply some mathematic methods such as the eigenvector method to calculate overall evaluation of each decisionmaker.InmanyMCDMconditionswherethereare no obvious DMs, subjective approaches are not applicable because no subjective judgments can be demonstrated on therelativeimportanceofattributes. Hybridapproachtakes theadvantages ofboth subjectiveandobjectiveapproaches (Wang&Lee,2009;Yang,Yang,Xu,&Khoveyni,2017). In theproposed modelwe have usedfuzzy linguistic vari-ablestorecognizewhetherCRandTRareinconnectionand thenhowmuch.Thesignificantpointinourproposalabout subjectiveweightsisthatweusedQFDmethodtocalculate theoverallweight forTRs. IndeedtheweightofeachCRis subjective that are translatedtoTRs. However, the weights forTR(whicharecalleddecisioncriteriaforMCDMprocess in this paper) are recalculated and so, it can be said that we haveactedbasedona hybridapproach.In practice,we integrateda new layer inevaluation ofcriteria weights by using customer requirements. This enhancesthe quality of theweighingprocedureandwholedecisionprocess. Based on formulas (1) and (2), the aggregated matric of fuzzyQFD andfuzzycustomer weights (UsingTable 3) are obtained. Thereafter the normalized weights of technical criteria (such as input for main decision matric) can be achievedthroughformula4.
The fuzzy TOPSIS methodology proposed in Section 2.2 is carried out to rank LPs. The criteria weights in previous phaseandratingperformanceofdecisionmakerson alterna-tivesareintegratedtotheF-TOPSISprocedure.The informa-tion andlinguistic fuzzyvaluesareaccessed through ques-tionnairederived fromgroupofDMs.The aggregatedfuzzy ratingisgeneratedusingeq.6.Thenormalizeddecision ta-ble for cost or benefit criteria are formed (Eqs. 7 and 8). Computationoftheweightednormalizedfuzzydecision ma-trix is the next task at this stage aided by eq. 10. At this stage fuzzy PISand fuzzyNIS accordingeqs. (11) and(12) mustbeverified.Thereafter,PISandNIS(eqs.13and14)are measuredandfinallyCC isattainedasformula15indicates. Asensitivity analysisisperformedto indicate thedifferent rankingandflexibilityoftheproposedmodelbyweights re-placement.
Phase 3 –Working on a programming platform anddatabase
tostructureadecisionmakingsupportsystem.Todevelopa modeldrivenDSS,thissectionprovidestheimplementation of the proposed methodology in a group decision making support system. The system is calledGRUS and actsas an electronicmeetingsystemwhichprovidesasetoftoolsand meetingsprocesses.Eachmeetingprocesswhichisdesigned or modified by a user of GRUS, automatically and anony-mously can be shared by the other users.With GRUS, one can organize publicand private meetings. Anyone can par-ticipatetoallofthepublicmeetings,butonlyinvited partic-ipantscanparticipatetoprivatemeetings.Meetingsare cre-atedbyafacilitatorwhoisabletoinvitepersonsinher/his private meetings. Facilitators are responsible for managing meetingsbutalsomayparticipateaseveryone.Thecontent of private meetingsis only accessible to their participants. Conversely, public meetings content is accessible to every-one.This systemhasbeeninvented andconfigured byIRIT laboratory at University of Toulouse Capitole 1 (Toulouse, France).
Designing, manufacturing and delivering the right product to the right location at the right time at the right price is the lifeblood of companies. The economic environment is changing, borders are openingup, andinternational competitionis intensi-fying. The life cycle ofproducts is reduced; the pressure on de-lays isbecomingstronger.Thecontinuous improvementof logisti-cal organizationistodayanessentialelementofbusinessstrategy. Agilityandflexibilityviaclientsandadaptabilityinthefaceof so-cial and environmental economic constraints are the leverage to achievesustainableprogress.
Questions like how to manage our informationflows? Where to place our warehouses? Which transport and logistics system should be implemented? A controlled andagilesupply chain be-comes paramount not only due to collaboration among all the company departments (marketing, production, logistics, procure-mentetc.)butalsotoextendthecollaboration beyonditsborders (suppliers,subcontractors,logisticproviders,etc.).
In the RUC-APS project the importance of logistic process is very particularly considerable in order to support companies. In this way the French association of supply chain and logistics (ASLOG)since 1972hasbeenestablished andactivated.Ithas en-couraged companies to involve logistics and supply chain direc-tions in the top level of the management decisions. Multi activ-itywithover400companies,nearly1500peoplenetwork,ASLOG is nowthe leadingFrench networkofprofessionals inthe supply chain area. Its objectives are to provide forward-looking visions, to generate standards and qualifications, to measure and evalu-atelogisticsperformance, andultimatelyto produceresearch dis-semination in partnership with the academic sector and bench-mark bestpractices (www.aslog.org).Forthis research,five logis-tic basedcompanies are selectedto be assessed bythe proposed fuzzymodel;Mathez,BANSARD,GEFCO,SCHNEIDERtransport,and GETMA.
Mathez group is a family run company specializing in logis-ticscoordinationandinternationaltransportation(air,seaandroad freight).Mainactivities ofthisgroupcanbeextendedfrom trans-port management by airfreight,seafreight,road haulage,storage, packing, Supply and distribution management and optimization, port agent, managementofcargoandcruise ships.Bansard Inter-nationaloffersacompleteserviceforsea,airandroad transporta-tion through partnerships withmajor airlinesto coverthe needs of our customers. Thus, major ports and airports are served by BansardInternational.Inaddition,thiscompanyprovidesadoorto door serviceandassistancetofacilitate customsoperations. They offer kindofservicelike; airtransport,sea transport,road trans-port,logistics,andindustrialprojects.Aleadingnameinindustrial andautomotivelogistics,GEFCOprovidescomplete,efficient logis-tics solutions for its industrial customers throughout the world. The group combines standards of quality and performance with theresponsiblemanagementofitslogisticsactivities.GEFCO incor-poratesandcomplieswithalltheelementsofsustainable develop-ment. The groupis ableto respondtoall supplychain optimiza-tionrequirements,upstreamordownstreamfromproductionsites: land transport, logistics,container management, vehicle distribu-tion, andmanagement of maritime and air flows. SCHNEIDER is a medium-sizedinternationalfreightforwardingcompany provid-ing specialized servicesinclearly definedmarkets. The Schneider Group combineshighservicequalitywithflexibility and commit-menttodeliverydates.Thecompanyplansandcoordinates trans-portation of all kind of goods between Switzerland, Europe, the Far East and the USA. This group delivers sort of activates from road transport, seaand airtransport and inventoryand procure-ment management, Reverse logistics,foodlogistic etc. Getma op-erates cargo handlingin African ports, central Africa andcoastal line.Throughitsnetwork,Getmaoffersarangeofservicestailored
Table 4
Correlation matric for house of quality process made by DM 1 .
WHATs (preference of customer/stakeholder) HOWs (Technical requirement) DM 1 Weight of CRs
TR 1 TR 2 TR 3 TR 4 TR 5 TR 6 TR 7
Confidence in safe & durable product (CR 1 ) G N P H
Emission of pollution & hazardous materials (CR 2 ) G N G M
Social responsibility (CR 3 ) N E H
Availability and access (CR 4 ) N N L
Recycling (CR 5 ) N G N H
Commit to health of employee (CR 6 ) G M
Affordable price (CR 7 ) G H
Table 5
Correlation matric for house of quality process made by DM 2 .
WHATs HOWs (Technical requirement) DM 2 Weight of CRs
TR 1 TR 2 TR 3 TR 4 TR 5 TR 6 TR 7 CR 1 G N N P L CR 2 N G N H CR 3 N G VH CR 4 N G P H CR 5 G N N M CR 6 N G M CR 7 G E H
toyourbusinessneeds:portmanagement,porthandling,shipping agency,freightforwarding,andinlandlogistics.
6. Results,sensitivityanalysisandvalidation
6.1. Results
Thispaperfocusesonapplicationofdecisionsupportmodelin supply chainthat aimsto show howitmay choosea thirdparty logisticsproviderasapartnerfromthepoolofpossibleproviders. Thefiveproposedphasesaredemonstratedstepbystephere:
Phase 1 - The aim of the model is to involve customer and stakeholders’preferencesinto thedecisionprocessinorder to provide a global andcomprehensive structure. The pro-posed DSS elements include three decision makers (DM1,
DM2 andDM3),thesevencustomerrequirements(CRs),the
seven technicalfactors(decision criteria)whichsatisfyCRs, and also the 5 alternatives logistic provides (LPs). The de-cision alternatives include:LP1 (Mathez), LP2 (GETMA), LP3
(GEFCO), LP4 (SCHNEIDER), and LP5 (BANSARD). The
cus-tomer factors are: confidence in safe and durable product (CR1),Emissionofpollution&hazardousmaterials(CR2),
So-cial responsibility (CR3), Availability and access (CR4),
Re-cycling process (CR5), Commitment to health of employee
(CR6) and offering affordable price (CR7). In other side,
financial stability (TR1), quality (TR2), delivery condition
(TR3),services(TR4),flexibilityofthesystem(TR5),
environ-mental management system (TR6) andcorporate social
re-sponsibility (CSR)(TR7)are listedastechnicalrequirements
forlogisticproviderevaluation.
Phase2-Asdefinedinfivephase’sprocess,primarilygroup of decisionmakers presentstheirjudgmentsaboutcorrelation between customer factors anddecision criteria. That infor-mationmadebydecisionmakers areseeninTables4–6.To do the computationusers are infront of operating system and they can fillanonymously questionnairesas well. Also they are asked to assign weights of each CR by linguistic variableswhichareinlastcolumnofTables4–6.
Phase 3 - Then linguistic forms are converted to fuzzy trian-gular values and aggregated QFD table is provided refer-ringformulas1–4.LinguistictermsinTable6areconverted
Table 6
Correlation matric for house of quality process made by DM 3 .
WHATs HOWs (Technical requirement) DM 3 Weight of CRs
TR 1 TR 2 TR 3 TR 4 TR 5 TR 6 TR 7 CR 1 N G N H CR 2 G N G H CR 3 P N M CR 4 G G M CR 5 N P G L CR 6 G E M CR 7 P N N G H
to numericalfuzzy valuesand then the correlated compu-tations are carried out. The fuzzy triangularvalues can be diffuzzfiedusing formula 3. Forinstance decision maker 1 givesimportance ofavailability andaccess (CR4) as L.The
value of L is achieved as this; 2+2(4)+5
4 =3.75. The final
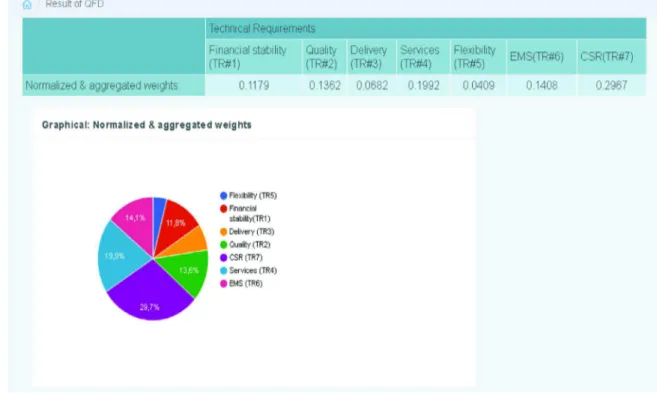
relative,normalizedandaggregatedweights oftechnical re-quirements are obtained as seen in Table 7. According to thistable corporatesocial responsibility (the bolded value) hasreceivedmoreattentionbasedonDMsapproach.Those weightscanbecountedasinputsforTOPSISprocess.
Phase4– Toratealternatives,againdecisionmakersareasked to fill the questionnaire or by operating system on-line forms. DMs must provide judgments based on experience andshould rate alternatives with respect to each criterion usingfuzzylinguisticvalues.Thewholeinformationis gath-eredand can be found in Table 8.For instance,DM2
con-sidered“Normal” and “Good” values for quality and deliv-erycriteria inassessingLP3.Theaggregatedfuzzymatrixis
obtainedwith help of formula6 which can be checked in Table9.
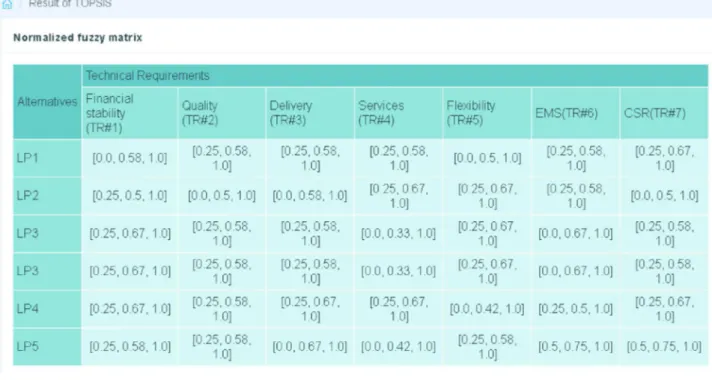
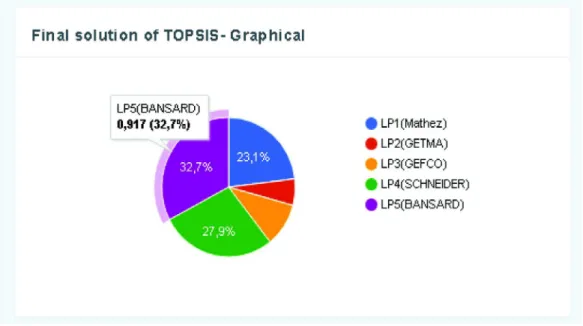
Phase5-Thereafternormalizedfuzzymatricisgeneratedusing Eqs.7 and8.Table 10shows thenormalized fuzzymatric. Tocomputeweightednormalizeddecisionmatrixa defuzzi-ficationmusebedonebyEq.3,thenusingformula10a de-fuzzifiedweighted matricisattainableasTable11presents. Inthistable,NIS,PISareextractedandappeared.Thesetwo measuresNISandPISare computedusingformulas11and 12. ThendistancesfromPISandNISmustbederived(based onEqs.13 and14) whichare showninTable12 andTable 13,inorder.AsitisobservedthedistancesfromPISaretoo smallwhichshowsalmostallofthemcanbefeasible. How-ever,TOPSISanatomyreleasesthebestchoice.TOPSIS close-nesscoefficient valuesandrankingoflogistic providersare producedbyformula15whichistabulated inTable14. Ac-cordingtothisinformationBANSARDlogisticcompanyisthe bestserviceproviderwithCCi=0.917whiletheweakest
lo-gisticproviderisGETMA(CCi=0.172)asLP2.Intotalthe
fi-nal priority of logistic providers based on combined fuzzy QFD-TOPSISare:
Table 7
The aggregated weights calculation by QFD.
CRs ( DM 1 ) TRs Weight of CRs TR 1 TR 2 TR 3 TR 4 TR 5 TR 6 TR 7 CR 1 6 4 2 8 CR 2 6 4 6 6 CR 3 4 7.5 8 CR 4 4 4 3.75 CR 5 4 6 4 8 CR 6 6 6 CR 7 6 8 CRs ( DM 2 ) TRs Weight of CRs TR 1 TR 2 TR 3 TR 4 TR 5 TR 6 TR 7 CR 1 6 4 4 2 3.75 CR 2 4 6 4 8 CR 3 4 6 9 CR 4 4 6 2 8 CR 5 6 4 4 6 CR 6 4 6 6 CR 7 6 7.5 8 CRs ( DM 3 ) TRs Weight of CRs TR 1 TR 2 TR 3 TR 4 TR 5 TR 6 TR 7 CR 1 4 6 4 8 CR 2 6 4 6 8 CR 3 2 4 6 CR 4 6 6 6 CR 5 4 2 6 3.75 CR 6 6 7.5 6 CR 7 2 4 4 6 8 Relative weights 203 234.5 117.5 343 70.5 242.5 511 1722 Normalized & aggregated weights 0.1179 0.1362 0.0682 0.1992 0.0409 0.1408 0.2967 Table 8
Linguistic fuzzy preferences of decision makers for logistic providers.
Alternatives Decision makers Financial stability (TR 1 ) Quality (TR 2 ) Delivery (TR 3 ) Services (TR 4 ) Flexibility (TR 5 ) EMS (TR 6 ) CSR (TR 7 )
LP 1 DM 1 N N G G P N G DM 2 E G N N N N G DM 3 P N N N G G N LP 2 DM 1 N G G N N N P DM 2 N G G G G N G DM 3 N VP P G G G N LP 3 DM 1 G G N N N E G DM 2 N N G N G P N DM 3 G N N VP G G N LP 4 DM 1 G N N G N N N DM 2 G G G N P N N DM 3 N N G G N N E LP 5 DM 1 G G P P N G G DM 2 N N G N G G G DM 3 N N E N N G G Table 9
Aggregated fuzzy decision matrix.
Alternatives TR 1 TR 2 TR 3 TR 4 TR 5 TR 6 TR 7 LP 1 (0,4.7,8) (2,4.7,8) (2,4.7,8) (2,4.7,8) (0,4,8) (2,4.7,8) (2,5.4,8) LP 2 (2,4,6) (0,4,8) (4,4.7,8) (2,5.4,8) (2,5.4,8) (2,4.7,8) (0,4,8) LP 3 (2,5.4,8) (2,4.7,8) (2,4.7,8) (0,2.7,6) (2,5.4,8) (0,5.4,8) (2,4.7,8) LP 4 (2,5.4,8) (2,4.7,8) (2,5.4,8) (2,5.4,8) (0,3.4,6) (2,4,6) (2,5.4,8) LP 5 (2,4.7,8) (2,4.7,8) (0,5.4,8) (0,3.4,6) (2,4.7,8) (4,6,8) (4,6,8) Table 10
Normalized fuzzy matrix.
Alt. TR 1 TR 2 TR 3 TR 4 TR 5 TR 6 TR 7 LP 1 (0,0.588,1) (0.25,0.588,1) (0.25,0.588,1) (0.25,0.588,1) (0,0.5,1) (0.25,0.588,1) (0.25,0.675,1) LP 2 (0.25,0.5,1) (0,0.5,1) (0.5,0.588,1) (0.25,0.675,1) (0.25,0.675,1) (0.25,0.588,1) (0,0.5,1) LP 3 (0.25,0.675,1) (0.25,0.588,1) (0.25,0.588,1) (0,0.45,1) (0.25,0.675,1) (0,0.675,1) (0.25,0.588,1) LP 4 (0.25,0.675,1) (0.25,0.588,1) (0.25,0.675,1) (0.25,0.675,1) (0,0.57,1) (0.34,0.67,1) (0.25,0.675,1) LP 5 (0.25,0.588,1) (0.25,0.588,1) (0,0.675,1) (0,0.57,1) (0.25,0.588,1) (0.5,0.75,1) (0.5,0.75,1)
Table 11
Weighted normalized matric for TOPSIS.
Alternatives TR 1 TR 2 TR 3 TR 4 TR 5 TR 6 TR 7 LP 1 0.06413 0.08259 0.04138 0.12081 0.02047 0.08541 0.19289 LP 2 0.06631 0.06809 0.04572 0.12947 0.02661 0.08541 0.14837 LP 3 0.07663 0.08259 0.04138 0.09461 0.02661 0.08309 0.17998 LP 4 0.07663 0.08259 0.04435 0.12947 0.0219 0.09435 0.19289 LP 5 0.0715 0.08259 0.04026 0.10657 0.02483 0.10562 0.22256 PIS (V + ) 0.0766 0.0826 0.0457 0.1295 0.0266 0.1056 0.2226 NIS (V −) 0.0641 0.0681 0.0403 0.0946 0.0205 0.0831 0.1484 Table 12 Distance from PIS.
Alternatives TR 1 TR 2 TR 3 TR 4 TR 5 TR 6 TR 7 LP 1 0.0 0 0156 0 0.0 0 0 0188 0.0 0 0 0751 0.0 0 0 0377 0.0 0 04084 0.0 0 08806 LP 2 0.0 0 0106 0.0 0 02103 0 0 0 0.0 0 04084 0.0055037 LP 3 0 0 0.0 0 0 0188 0.0012151 0 0.0 0 05077 0.0018133 LP 4 0 0 0.0 0 0 0 019 0 0.0 0 0 0222 0.0 0 01269 0.0 0 08806 LP 5 0.0 0 0 026 0 0.0 0 0 0298 0.0 0 05247 0.0 0 0 0 032 0 0 Table 13 Distances from NIS.
Alternatives TR1 TR2 TR3 TR4 TR5 TR6 TR7 LP1 0 0.0 0 0210 0.0 0 0 0 01 0.0 0 0686 0 0.0 0 0 0 05 0.001981 LP2 0.0 0 0 0 05 0 0.0 0 0 030 0.001215 0.0 0 0 038 0.0 0 0 0 05 0 LP3 0.0 0 0156 0.0 0 0210 0.0 0 0 0 01 0 0.0 0 0 038 0 0.0 0 0999 LP4 0.0 0 0156 0.0 0 0210 0.0 0 0 017 0.001215 0.0 0 0 0 02 0.0 0 0127 0.001981 LP5 0.0 0 0 054 0.0 0 0210 0 0.0 0 0143 0.0 0 0 019 0.0 0 0508 0.005504 Table 14
Final solution of TOPSIS.
Alternatives CC i Ranking LP 1 0.647 3 LP 2 0.172 5 LP 3 0.284 4 LP 4 0.783 2 LP 5 0.917 1 6.2. Sensitivityanalysis
Sensitivity analysis is a technique to observe the affection of change from some parameters of the model on other elements. Thisactiongenerallyiscompletedbyreplacingtheweightofeach criterion;theresultingchangesoftheprioritiesandthefinal rank-ing ofthe alternatives are pictured. The strategy to operate sen-sitivity analysis in this paper is to change randomly position of criteria weights. Therefore,tendifferent set oftestsare arranged to produce different ranking for TOPSIS. The tests are shown in Table15.
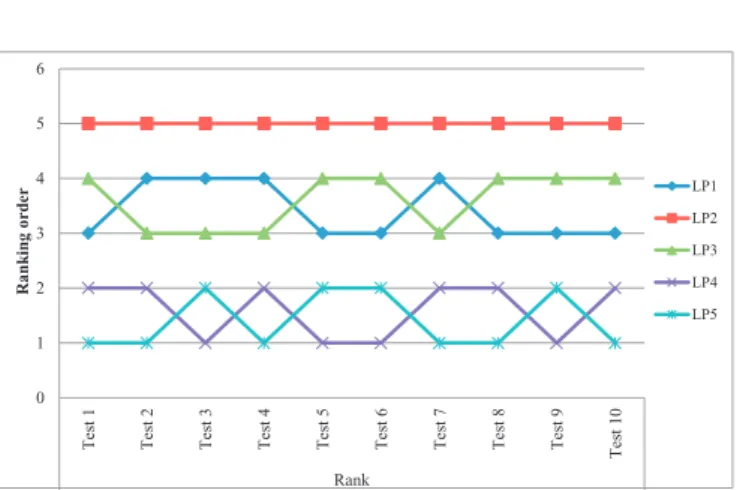
Table 16 depicts the changes in final ranking of logistic providers when criteria weights are altered. However, those changesareslightlysimilarandasseenthesamerankingsare ob-tainedinTest1,8and10.Theresultsdeclarethatrankingof sensi-tivityanalysisareingoodagreementbasedoncloseness.So, man-agerscaninferthatBANSARDandSCHNEIDERarethemost confi-dent logisticserviceproviders.Inadditionin6tests(test1,2,4,7,8 and10)therankingscoreof1standsecondlogisticsproviders re-main thesame.This claims final rankingisnot affected bythose weight replacements and the stability of the model is approved. Fig. 3 illustrates the ranking changes. The notable point is that GETMA (LP2) (the worst option)has themoststableranking and
keepsitsrankingposition.
Fig. 3. Sensitivity analysis illustration.
6.3.Validationoftheresults
During the design of the survey and questionnaire, we have askedall theexpertstovalue theitemsbelowintheirpreference comparison. Thislead to modela robust logistic provider assess-mentplan;
- Feasibility and applicability; does the logistic providers ap-proachevaluatethemostrelevantlogisticcompanieswhichare feasibleandpracticalforalong-termrelationship?
- Preferencebasedevaluation;doesthe LPassessmentapproach selectthembasedonincorporation ofall thepreferences sup-pliedbytheDM?
- Competency; does the proposed approachselect LPs competi-tivelysuperiortoothers?
- Sustainability;doestheLPselection approachofferaselection mechanismwhicharesustainableandefficientto the environ-mental?
Table 15
Tests for sensitivity analysis.
W 1 W 2 W 3 W 4 W 5 W 6 W 7 Test 1 0.1362 0.1179 0.1992 0.0682 0.0409 0.2967 0.1406 Test 2 0.1992 0.0682 0.0409 0.1179 0.1362 0.2967 0.1406 Test 3 0.2967 0.1406 0.0409 0.1992 0.0682 0.1362 0.1179 Test 4 0.2967 0.1406 0.0682 0.1179 0.0409 0.1992 0.1362 Test 5 0.0682 0.2967 0.1179 0.1992 0.0409 0.1406 0.1362 Test 6 0.0682 0.2967 0.1992 0.1406 0.0409 0.1179 0.1362 Test 7 0.0682 0.2967 0.1362 0.0409 0.1406 0.1992 0.1179 Test 8 0.0682 0.2967 0.0409 0.1362 0.1179 0.1406 0.1992 Test 9 0.1406 0.1992 0.2967 0.0682 0.0409 0.1179 0.1362 Test 10 0.1406 0.1992 0.0409 0.1179 0.1362 0.0682 0.2967 Table 16
Sensitivity analysis ranking outcomes.
Alternatives Ranking
Test 1 Test 2 Test 3 Test 4 Test 5 Test 6 Test 7 Test 8 Test 9 Test 10
LP 1 3 4 4 4 3 3 4 3 3 3
LP 2 5 5 5 5 5 5 5 5 5 5
LP 3 4 3 3 3 4 4 3 4 4 4
LP 4 2 2 1 2 1 1 2 2 1 2
LP 5 1 1 2 1 2 2 1 1 2 1
Fig. 4. QFD implementation for DM 1 in GRUS system.
Apart of that, we have formulated an integrated logistic providerselectionmodelwiththeapplicationofQFDandTOPSIS. Initially,it hasbeen startedto providea caseexample andsolve themulticriteriadecisionproblembyExcelsoftware.Althoughwe canrelyonthemodelanditsefficiency,howeverthevalidityofthe methodology mustbe studied andclarified. Thus, forsome main reasonswedevelopadecisionsupportsystemandimplementthe QFD-TOPSISalgorithmwhichisvital;
1- The proposed DSS gives accuracy and stability to the study. Because all the calculationsare monitored by a machine and mathematicalalgorithm
2- Forlargerscaledecisionproblemandhighvolumeof computa-tions,the DSSactsfasterandinsecond all theresultsare ex-tracted.
3- For decisionmakers andexpertsalways ismoreconvenientto work on a computer system and offer their opinion or judg-mentratherthanfilingprintedquestionnairewhichsometimes
will causeerrorsand mistakes.They areable to checkall the processofdecisionmaking(brainstorming,argumentsand dis-cussion). It is much moreeconomic to use a DSS ratherthan paperquestionnaireintermsofprintingethicsaswell. Toensurethatthemodelisusableandapplicableforthe RUC-APS project,a real-worldcasestudy ofselectinglogistic provider (five companies in France) fortransportation of agriculture prod-uctstothestorageordistributioncentersisregulatedwitha gen-uine decisionsupport system (Section 7). We pushed our efforts to handleuncertainty existedin evaluationprocess andtoface a complexandinfluentialcustomer/stakeholdergroup.
Intheprevious section,asetofsensitivityanalysistest,which hasbeendonewithchangingdifferentcriteriaweightpositionand weightcombination,denotesthatthedecisionmakerscantruston the proposed QFD-TOPSISapproach due to stableranking results for 3PLproviders. This isanother way toverify andvalidate our proposedalgorithm.
Fig. 5. Final weights obtained by the QFD and graphical chart.
Fig. 6. Alternative performance on each TR made by DM 1 .
7. GroupDSSimplementation
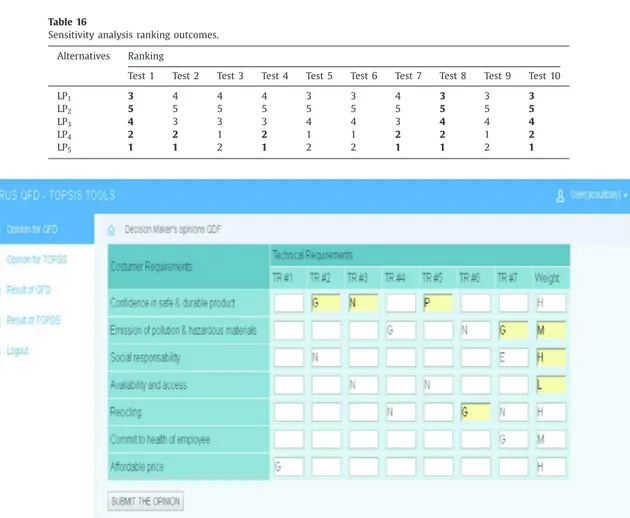
To implement the proposed model, we divide it by the two sections. Initially theQFD process is established andthe weights oftechnicalrequirements arecomputed. Inthesecond partfuzzy TOPSIS methodologywillbeimplementedtoreachtherankingof logistic providers. Eachuser (decision maker) can register to the system, makeaprofile,signinandpresentthepreferencesbased onfuzzylinguisticvariables.Forinstance,wehaveshownthatthe firstevaluationmatrix(Table4)whichisgivenbydecisionmaker (DM1). Fig. 4 reflects the picture of GRUS system. The software
mustbeconnectedtotheinternetandatthesametimeeachuser
cansubmitthepreferencesaswell.Inthissoftware,thereare op-tionsforpresentingpreferenceofthedecisionmakersassignedto bothTOPSISandQFD tools.Whenausersubmitshis/heropinion, thecalculationandaggregationiscarriedoutautomatically based on the written algorithm. The final aggregated weights from the threeDMs aregeneratedin Fig.5.Apie chart alsovisualizes the importance oftechnical requirementsas well. It isobserved that CSRisthemosteffectiveitemfollowedbyservicesbythe0.199of significance.
Inthissteplike QFDprocess againeach decisionmakeris re-questedtosubmithis/herjudgmentanonymouslyusingthesystem input.InFig.6,the performanceoflogistic providersisevaluated
Fig. 7. Normalized fuzzy decision matrix.
Fig. 8. Weighted normalized matrix.
withrespecttoeachtechnicalrequirementbyDM1.Eachdecision
makerstarts togive thepreferenceby afuzzylinguistictable.By clicking submitbuttonalltheprocess oftheTOPSIS iscompleted andstepbystepitispossibletocheckdetailsofcomputations.
Forexamplethenormalizedandaggregatedfuzzydecision ma-trixcanbeshownasFig.7indicates.Inthismatrixisequaltothe computationsofTable10inprevioussections.Through eachstage the system hasthe capability to be testedand verified andit is partofthestrengthofthesoftware.Theweightednormalized de-cisionmatrixinthenextstepmustbe determined.Allthematrix elementsthereafteraredefuzzifiedandtheoutcomeiscapturedas shownbyFig.8.Topreventofproducingseveraltableandfigures, wehavewithdrawntobringallthosecomputations.Inordertoget thefinalresultsoftheTOPSIS,closenesscoefficientmustbe
iden-tified. Infinal thepriority ofeach logisticprovider isdetected as Fig.9claims.Thesystemallowsustogenerateagraphicalpicture oftheperformanceofeachalternativesuchinFig.10.Itisevident that LP5 (Bansard company)isthe only optionwho iseligible to
beselectedbythesupplychainexperts.
8. Conclusionandsuggestionforfutureprojectdirections
Thispaperresolvestheissueofevaluatingandrankinglogistics providers by utilizing an integrateddecision making formulation. Itevaluatesandelucidatestheinteractionrelationshipsandimpact levels betweenthecustomer attitudesandlogisticsproviders’ cri-teria.Afuzzyapproachisdesignedtoeliminateuncertaintyamong factors anddecisionvariables.QFD facilitatesbuildingup the
un-Fig. 9. TOPSIS ranking for logistic providers.
derlying relationshipamongcustomer andtechnicalrequirements. Thefindings ofthispaperputforwardverysignificantinsightson different attributes which considerably contribute to LPs perfor-mance andinthis casetheefficiency ofinefficientproviders can be improved. Through design of a decision support model, a lo-gistic providerproblem hasbeen defined, requiredfactors under viewpoint ofexpertsand customer identified,andfinally, a solu-tion has been generated using fuzzy MCDM. It must be pointed out that houseofquality matricallowsthe projectusersand de-signers to capture customer preferences, and convert them sim-ply tomulticriteriaprocess.The outputsofQFDareincorporated into theMCDMasweightsofthemaindecisioncriteria. Sensitiv-ityanalysisstrategiesconfirmthattheappliedmodelisstableand cannot beaffected bythechangesincriteria weights.Hence,itis approvedthat theBANSARDCompanycan be countedasoptimal logisticprovider.
Based on the results, it is recommended to focus on flexibil-ityanddelivery factorsbecausetheyhavebeenratedby decision makers withlower importance. So, those factors need some im-provement andcorrectiveactions.It isfigured out thebest alter-native (BANSARD) has earned very good ratingon CSR (as most importantcriterion)andso itcanbe keydriving forceto the de-velopments ofinfrastructureofthe serviceprovider. Itisalsothe responsibilityofthemanagementtostronglycontrolmaindrivers
ofthesupplychainandlogisticstoimprovemanufacturingand lo-gisticsprocessesandproductionplanningactivitiesaswell.
We believe that the proposed decisionmaking formula is ac-ceptable and robust and can be easily executed practically for groupmulti-criteriadecision-makingproblems.Thetopranked lo-gisticproviderscores canbe outlinedforthe resttocomprehend their weaknesses and fulfill logical pattern for future plans. We havetriedtodevelopabasisforgenerousrelationoflogistic com-paniestoreduce their weaknesses.So, managerscanrely onthis structure effectively to reach global objectives. Through the re-leasedmodel,groupsofexpertscanparticipatetothecoreofthe decision making process focusing on customer and external pa-rameterstodelivereffectiveperformanceamonglogisticspartners. EvaluationoftheLPperformanceindirectlyimprovesperformance and behavior of LPs regarding weak attribute and also allocate morecredittothestrongerproviderstoappreciateallpracticesto thenextlevel.
Theproposedmodelhasobjectedatbridgingtwoexistinggaps in the literature on LPs evaluation; the lack of a systematic ap-proachtoanalyzespecificdecisionelementsandtheconsideration ofcustomersatisfactionfactorsinfuzzyenvironment.Althoughthe proposed framework is not hard to be implemented in logistics problemby any other users whose features are similar to those delineated forthe company ofthe casestudy, it requiresserious effortsonthesideofthemanagers.Forexample,thewrongchoice ofexpertsbythemanageraswellastheinaccurateanalysisofjust one expert maycausetheselection oflessthan efficient alterna-tives,imposing an opportunity cost on the company in terms of efficiencylossesandforegoneprofits.
TheimplementationofagroupfuzzyMCDMapproachina sup-plyandlogisticsmanagement istheachievement oftheRUC-APS project.Inthedecisionsupportsystem(GRUS),wedevelopedand implemented an integrated MCDM formula to help supply chain and agricultural partners in facilitation of their judgments and graspapractical framework.The articlesupplied an effortto dis-cussabout selection of suppliers undersupervision and satisfac-tionofcustomers. Basicallywe obtaina newtrendinsupporting group decisionmakingtechnologies in thesupplychain withthe utilizationofinformationtechnology.Wehavearguedthe interac-tionandlinkagebetweendecisionmakers andcomputer applica-tions by an integrated multicriteria decisionmaking framework.