an author's https://oatao.univ-toulouse.fr/24023
https://doi.org/10.1007/s10443-014-9427-y
Lachaud, Frédéric and Espinosa, Christine and Michel, Laurent and Rahme, Pierre and Piquet, Robert Modelling Strategies for Predicting the Residual Strength of Impacted Composite Aircraft Fuselages. (2015) Applied Composite Materials, 22 (6). 599-621. ISSN 0929-189X
Modelling
Strategies for Predicting the Residual Strength
of
Impacted Composite Aircraft Fuselages
Frederic Lachaud & Christine Espinosa & Laurent Michel & Pierre Rahme & Robert Piquet
Abstract Aeronautic Certification rules established for the metallic materials are not conve-nient for the composite structures concerning the resistance against impact. The computer-based design is a new methodology that is thought about to replace the experimental tests. It becomes necessary for numerical methods to be robust and predictive for impact. Three questions are addressed in this study: (i) can a numerical model be “mechanically intrinsic” to predict damage after impact, (ii) can this model be the same for a lab sample and a large structure, and (iii) can the numerical model be predictive enough to predict the Compression After Impact (CAI)? Three different computational strategies are used and compared: a Cohesive Model (CM), a Continuous Damage Model (CDM) coupling failure modes and damage, and a Mixed Methodology (MM) using the CDM for delamination initiation and the CM for cracks propagation. The first attempts to use the Smooth Particle Hydrodynamics method are presented. Finally, impact on a fuselage is modelled and a numerical two-stage strategy is developed to predict the CAI.
Keywords Composite Materials . Delamination . Crack Propagation . Mixed Mode . Compression After Impact . Smooth Particle Hydrodynamics
1 Introduction
The composite materials form a new interesting field for aeronautical. These materials are known for their ratio weight/strength relatively high compared to metallic materials. However, at the same time, they are known for their sensitivity against impact. Impact provokes internal damages including delamination and matrix cracks. These damages reduce the strength of the structure. Impact of composite materials has been studied by several authors [1–4]. Moreover,
F. Lachaud (*)
:
C. Espinosa:
L. Michel:
R. PiquetUniversité de Toulouse, ISAE ICA (Institut Clément Ader), ISAE/DMSM, 10, Avenue Edouard Belin, BP54032, 31055 Toulouse Cedex4, France
e-mail: [email protected] P. Rahme
Faculty of Engineering, Mechanical Engineering Department, Lebanese University, P.O. Box: 27622319, Roumieh, Lebanon
numerous researchers developed a numerical model to predict the CAI (Compression After Impact) residual strength [5–7]. However, most of these models focus on a local application and it becomes complicated to implement them into a global structure. Some other models involve damage mechanics for complex structures [8,9]. Damage tolerance of the composite structure can be characterized by the risk of brutal propagation of delamination under compressive loading leading to the structure failure. Compression After Impact (CAI) is the loading case under purpose in this study. Damage tolerance is related to failures modes [10, 11]. To predict the strength evolution during damage accumulation, it is necessary to determine the contribution of each failure mode [3]. Compression After Impact (CAI) strength can be determined through the classical linear elastic fracture mechanics theory (LEFM) [12].
In this study, three questions are taken into account: (i) can the numerical model be “mechanically intrinsic” and cost effective for after impact damage prediction?, (ii) can the numerical model be the same for the structure scale (pre-test) and the material scale (post-test) for after impact damage prediction? and (iii) can the numerical model be predictive enough of the CAI residual prediction to derive simple and robust rules of design? Also, three different computational strategies are used and compared. A first Cohesive Model (CM) represents the behaviour law of a thin layer called interface. This model is based on the classical continuum mechanics. To evaluate the robustness of this model, same developed laws have been exactly made in a quasi-static code (under Samcef Software) and in transient dynamic codes (Ls-Dyna, Europlexus). A second Continuous Damage Material model (CDM) is used in order to couple the failure modes and damage. Finally, using the (CDM) method and the (CM) model to simulate respectively delamination initiation and crack propagation, a third numerical model is developed. This approach mixed together inter and intra-ply damage. Split Hopkinson’s pressure bars are used to characterize the strain rate behaviour of balanced angle ply laminates.
To answer the question “can a numerical simulation be mechanically intrinsic and predictive?”, computer simulations of an impact are carried out with the three developed model. A 3D simulation of 15 J impact energy is considered. The results of simulations and experimentation are compared and discussed. To analyse the ability of the (CDM) model to tackle damage tolerance, two applications cases are investigated. Moreover, the (CDM) model is used to simulate an impact of 53 kJ on a fuselage section. The compression after impact (CAI) simulation process is also developed. For the CAI, a two-stage simulation process is set. This simulation uses the impact model to predict damage resistance of a T800S/M21e laboratory plate. It uses also a feature of LS-DYNA® to continue loading the plate in CAI [10].
2 Modelling Versus Experimental Testing of Resistance Against Impact
The aim of this section is to replace the experimental tests by numerical simulations. The questions of the numerical model confidence of robustness and prediction have been set as well. Three methods are tested using the material data. It is aimed here, to use the input parameter data to run pre-tests simulations with no adjustment of the numerical method set-up or of the physical properties, and to determine if the simulation is predictive. The results under interest are the internal 3D shape of the delaminated surfaces compared to C-Scan measure-ments. A comparison of the global force/time curve and the local indentation after impact is furthermore presented between the Cohesive and Continuous Damage Models. All the low velocity impact tests have been realized using the experimental setup described in this section.
2.1 Impact Tests and Damage
Impact tests have been performed on simply supported laminates. Different energy levels have been obtained with two different projectiles: drop weight and gas gun (different masses and different velocities) [13–15]. For example, for 15 J energy, the mass and the velocity are adjusted as follows: drop weight (2.368 kg, 3.47 m/s), gas gun (17 g, 40.82 m/s). For the drop weight setup, the impactor consists of a movable trolley equipped with a load sensor and a steel impactor head of diameter 16 mm. The specimen is placed on a 300×200 mm2 and 20 mm thick steel support plate fixed to a rigid frame. The steel plate serves as a support to the specimen and contains a window of 125×75 mm2. The time taken to travel a maximum distance is registered by the data acquisition system; the velocity calculation is then trivial. The force of impact is measured by the load sensor mounted on the trolley. The displacement of the non-impacted face of the specimen is also measured using a high frequency laser. The impactor trolley is equipped by an anti-rebound mechanism to stop any subsequent impacts. Another impact tests were carried out on a medium velocity gas gun setup. The impactor of this setup is a stainless steel ball of 16 mm diameter. Since it is not possible to launch this ball alone in the gas gun tube, a foam support is used to place the ball in the tube. In order to avoid the modelling of the foam, the gas gun is equipped with a support mechanism in order to stop the foam. A high frequency speed camera was placed 100 mm before the specimen to measure the velocity of the impactor. The support plate dimensions are the same as for the drop weight tests. The support plate is fixed on a heavy block of cast-iron (mass >300 kg), which itself is fixed to the ground. The support plate can, therefore, be considered as a rigid support.
Note that the work, presented in this paper, has been done on new generation of composite resins, the M21 thermoset epoxy resin enriched by thermoplastic nodules called M21e. The used carbon fibres are T700GC and T800S carbon fibres. These fibres and resin have been chosen because they are widely used in composite components of aerospace vehicles. 2.2 Cohesive Model: Interface Elements for Plies Delamination
The cohesive model (CM), presented by Lachaud et al. [16], has been used to compute the damage resistance of [−45, 45, 0, 90, 02,−45, 45, 0]sT800S/M21e samples. In previous work, the matrix cracking developed in multidirectional composite laminates loaded in tension is investigated by a finite element model [17]. In this paper, impact tests of 15 J energy were performed using a drop weight impact setup. Eight nodes solid finite elements, with three degrees of freedom per node and one integration point per element, are used in the numerical model. Each layer of the laminated composite material is modelled by one layer of linear elastic solid elements. A layer of four integration point cohesive finite elements is placed between the plies of different orientations as interface. One fourth of the model is considered due to the symmetry. In order to capture the strain gradients properly, the size of the finite elements has been chosen smaller in the impacted zone. The cohesive finite elements of zero initial thickness share the nodes with the solid elements. These elements deform with respect to the applied loading. They are deleted from the simulation once they are computed as totally failed. A frictionless contact is defined between the plies. This contact becomes active when a cohesive element is deleted. The used material data for the elastic plies and for the cohesive elements are found by Lachaud et al. [16] and are summarized in Tables1and2.
The support is considered rigid (i.e. non-deformable), and constrained in all directions while the projectile is only constrained in x- and y-directions. The projectile is supposed non-deformable and is modelled using shell elements. The centre of mass, the total mass and the initial velocity of this projectile are prescribed to reproduce the test conditions (15 J, drop
weight). A penalty based frictionless contact is defined between: (i) the composite specimen and the impactor, and (ii) the composite specimen and the metallic rigid support. Delamination discontinuities are created by killing the cohesive elements that have failed. Indeed, the failure is obtained when damage reaches a value of 1 [16]. By plotting the cohesive elements for a damage variable varying between 0.9 and 1.0 (0.9<d<1.0), a bounding box representing the delamination area is obtained (Fig.1a) (top-view and“iso” view). A total projected surface of 39×30 mm2is predicted. Figure1bshows the corresponding C-Scan measurement giving a 29×25.5 mm2projected area. The computed area is significantly higher than the experimental value.
The same results were obtained for other configurations of impact simulations [18,19]. For example, for a [−45,45,902,0]sstacking sequence, a microscopic cross-section of the impacted specimen was taken along an angle of−45° with the global x-direction. It is observed that macro-cracks were present in the plies. Some of these cracks help to stop the delamination propagation. To reproduce a delamination surface distribution in the thickness with cohesive elements and elastic plies apart, and to get a correct orientation of delamination in 45°/−45° or −45°/45° interfaces, it has been necessary in this case to reduce the fracture stress to 40 MPa.
In the presented case, the proportional distribution orientation and localization of delami-nation is quite well reproduced. The major axis of the elliptical delamidelami-nation is oriented along the fibre direction of the lower plies e.g. the 45°/−45° interface. The results are consistent with the C-Scan helicoidally through the thickness repartitions: the length along the lower ply orientation and the peanut shaped delamination. However, the plies remain elastic, no crack that could help or stop the delamination propagation appears, and no adjustment has been made on the maximum stresses. This over-estimation could partially be attributed to the absence of: (i) matrix damage, (ii) strain rate effects for interfaces and (iii) wave propagation effects in the existing finite element and cohesive material model. The next section will focus on the impact damage modelling by using the Continuous Damage material Model that takes into account more effects.
2.3 Continuous Damage Model
The results presented in this section are for a typical T800S/M21e laminate stacking sequence, [−45, 45, 0, 90, 0, 0,−45, 45, 0]s, impacted using the drop weight setup at 15 J energy. The numerical model is composed of 8 nodes solid elements, one element per ply in the thickness. The (CDM) model is used in each layer with the corresponding angle of fibres. The material Table 2 Data set for the proposed model and for T800S/M21e UD laminate defined by Lachaud et al. [16]
E11=165 GPa E22=7.64 GPa E33=7.64 GPa Ef=112 GPa XT=2.2 GPa XC=1.2 GPa
v21=0.0162 v31=0.0162 v32=0.4 mi=10 YT=45 MPa YC=280 MPa
G12=5.61 GPa G23=2.75 GPa G13=5.61 GPa ZT=45 MPa ZC=0.7 GPa Sffc=0.5 GPa S12=0.05 GPa S23=0.05 GPa S31=0.05 GPa Sfs=1.5 GPa ωmax=0.87 φ=10° Table 1 Data for T700GC/M21e and T800S/M21e (UD laminate) cohesive model behaviour defined by Lachaud et al. [16]
UD laminate K33(N/mm3) K13(N/mm3) σ33(MPa) σ13(MPa) GIc(J/m2) GIIc(J/m2) η
T700GC/M21e 100,000 f(K33) 50 90 545 1387 1.2
data is given in Table 2. The model does not distinguish between different tensile or compressive modulus; a “flexural modulus” (Ef=112 GPa) is used to replace the axial modulus. One fourth of the model is presented on Fig.2.
The support and the projectile are taken rigid. A frictionless contact is introduced for the plate. This model is the same one presented before without cohesive elements. Damage is represented by elastic modulus reductions up to a saturation level. When damage reaches this saturation, the corresponding elastic modulus is supposed to drop suddenly to zero. A remaining minimum resistance is kept in compressive loadings. The outputs of the model that can be compared with C-Scan results are accumulated damage variables. The d12damage defined in the model of Lachaud et al. [16] has been chosen here. It is also possible to draw the proportion of contribution of the different 5 failures modes. The localization of the elements failed by saturation in the model (Fig.3) gives a prediction of the delaminated area (0°_26.5, 90°_24 mm) similar to what can be observed on C-Scan of impacted plate at 15 J energy (0°_25.5, 90°_29 mm). The previous cohesive model and the quasi static model are more diffusive (0°_33.5, 90°_39 mm).
The coupling inter-intra laminar transcribed the classical shape of the delamination defect [14, 20]. The macro-cracks appearance blocks and guides the delamination propagation through the orientation of the ply located below delamination. This can be observed as a result of the CDM simulation on Fig.3(bottom right). Indeed, this can also be seen in the
C-Scan 26 mm 39 mm 39 mm 11: 014/9015 6: -457/458 9: 4511/-4512
a) Cohesive damage area b) C-Scan
Fig. 1 Comparison between tests and models (cohesive only) of the delamination area, T800/M21 [−45,45,0,90,02,−45,45,0]Slaminate
presentation contribution of the matrix cracking and the delamination failures respectively on the global damage of G12(Fig.4). The cracked zone clearly helps the delamination propaga-tion along the fibres of the upper ply (+45°). It helps also preserving a non-delaminated zone under the projectile punch. Furthermore, the matrix cracking is the failure mode that creates the axial symmetric of the delaminated area.
2.4 3D Crack Opening Model: Mixed Methodology
A typical T2H/EH25 UD composite laminate with [02,452,902,−452]sstacking sequence is used in this paragraph [21]. The coupling model simulations were carried out with Samcef/ explicit (Europlexus) software. In this part, the capabilities of the cohesive/continuous coupled damage model are presented to simulate all damages which appear during low velocity impact tests. The mesh of the finite element model is presented on Fig. 5. The support of the composite plate is modelled, and a contact condition is introduced. The spherical impactor (16 mm diameter) is modelled as a rigid body. Each orientation of the plies is modelled by
Impact 1: -451/452 2: 452/03 3: 03/904 4: 904/05 9: 4511/-4512 6: -457/458 5: 06/-457 11: 014/9015 x y 11: 014/9015 9: 4511/-4512 6: -457/458
Fig. 3 Comparison between tests and models of the delamination area for the CDM damage behaviour, T800S/ M21e material, [−45,45,0,90,02,−45,45,0]Slaminate
Fig. 4 Contribution of cracking matrix criterion (left) and delamination criterion (middle) on the global G12 damage prediction (right) of a T800S/M21e [−45,45,0,90,02,−45,45,0]S laminate impacted at 15 J energy
solid elements (1 element per ply in the thickness). A refined zone under the impactor allows, by splitting hexahedral elements into prism elements, to mesh in an automatic way, the intra laminate cohesive elements. This 3D mesh is thus entirely parameterized.
The data model for this case is summarized in Table3.
The values of knand ksare defined by correlation of calculations-tests on DCB specimens (Double Cantilever Beam) and ENF specimens (End Notched Flexure). They are found by wedging the initial slope of the load–displacement behaviour of the tests (linear part). From 20 000 N/mm3, there is no more influence on the behaviour. However, a good approach of the values of these stiffness’s is to calculate them using transverse shear composite models (E22 and G12) dividing by the thickness of the interfaces (about 1/10 mm). Current studies are conducted in order to determine in a more realistic manner these cohesive interface stiffness’s and their effect on the results.
When impacting at 15 J energy, the damages obtained using the cohesive-damage coupled numerical model (Fig. 6) are compared with the C-Scan measurements for a [02,452,90,−452,0]Slaminate [21]. The shape, the orientation and the length of each damaged cohesive interface are very close to those observed in experimentation. However, if the length is close (30 mm for modelling, 32 mm for experimentation), the width is larger (24 mm for modelling, 18 mm for experimentation). For this energy level, the matrix macro-cracks of the first ply (0°) located on the non-impacted face, are not very important. This is due to a small global bending.
The advantage of a predictive numerical model is that it allows visualizing the damage at each interface and ply. Figure7shows the drawing of the impacted plate as well as the position Fig. 5 Finite element model of impact sample with ply-delamination coupling using inter and intra laminate cohesive elements, [02,452,90,−452,0]Slaminate
Table 3 Data set for T2H/EH25 carbon fibres UD laminate
E11 E22 E33 v12 v23 v13 G12 G23 G13
143 GPa 9.9 GPa 9.9 GPa 0.28 0.4 0.28 5.1 GPa 3.2 GPa 5.1 GPa
kn ks σn σs GIc GIIc η
and the orientation of the plies. The figures, shown in Appendix A, present the delamination areas between the plies and the transverse cracking within the plies. It’s then possible, to describe the history of the delamination appearance during loading. On each figure, the orientation of the delamination and the macro-cracks of plies located on both sides of the considered interface, are indicated. For each interface, it is observed that delamination is limited by the macro-cracks of the plies. The delamination propagates then in the direction of the plies located below the considered interface. From bottom to top ply interfaces, the principal direction of the delamination propagation (green arrows on the figures) turns in the trigonometric direction until the mid-plane is reached and then in a reversed way above.
To illustrate more accurately, an example of the delamination interface, between the ply 45° (ply n°2 from the non-impacted face) and the ply 90° (ply n°3) of the [0,45,90,−45]Slaminate, is presented on Fig. 8. This shows the delamination propagation mechanisms during low velocity impact. For each interface, the macro-cracks of the plies limit the delamination propagation. The orientation of the delamination propagation is then fixed by the fibre orientation of the ply located just below delamination. The macro-cracks of plies 45° and 90° and delamination results are presented on Fig.9.
This mechanism is the same for each delaminated interface. Only the size of the first delamination located on top of the non-impacted face is strongly influenced by macro-cracks. This is due to the transverse tensile stress state of the bottom ply linked with the global bending of the plate for large displacements. This numerical method helps to compute the development of delamination coupled with the macro-cracks extension. These models are entirely param-eterized. They are very encouraging for their possible extensions. The robustness of these
32 mm 30 mm 18 mm 24 mm 1: [02/452] 2:[452/90] 3: [90/-452] 4: [-452/02] 8: [452/02] 5: [02/-452] 7: [90/452] 6: [-452/90]
x
y
a)
C-Scanb)
ModelFig. 6 Comparison between experimentation and modelling of the delamination size after impact (15 J), T2H/ EH25 material, [02,452,90,−452,0]Slaminate
models was validated on several materials and with different stacking sequences. This model is now directly usable to carry out numerical simulation of compression after impact under static and dynamic loadings.
2.5 Comparison of Cohesive Model and Continuous Damage Model
The impact tests and the corresponding numerical simulations have been performed on the simply supported [−45/+45/0/90/0/0/−45/+45/0]s T800S/M21e laminates for the cohesive model (CM) and for the continuous damage model (CDM). It is intended here to compare the predictability of these two models. The results under consideration are the global behaviour of samples. The considered results are: the force/time curve measured by a piezoelectric sensor, the external indentation and the strain rate effects on damage predictions. Figure10 shows the comparison of force/time curves obtained by a drop weight impact test and numerical simulations. Note that the flexural modulus Efhas been used in the CDM model.
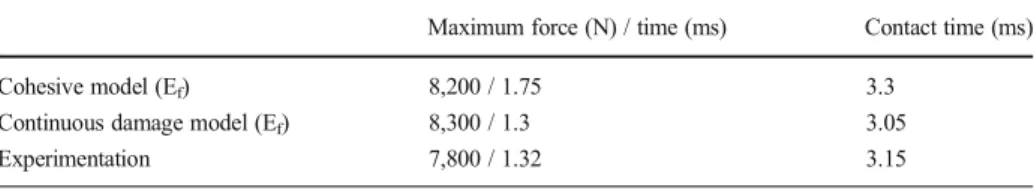
The computed contact forces are higher than the experimental values in the same range (about 6 %). The same result is found for the contact duration (about 5 % for the CM, and 3 % for the CDM). On Fig.10, the first linear elastic part is well recovered by both models (up to 0.7 ms). The change in the plate stiffness due to damage occurs at about 0.7 ms for the CDM, while it appears earlier for the CM (about 0.4 ms). Regarding this point, and the global frequencies, the CDM is more accurate and simulates better the time corresponding to maximum force and the different phases that appear on the curve. This good correspondence is due to the strain rate effects that are taken into account by the CDM model. The values of forces and corresponding times are summarized in Table4.
0° 90°
Macro-cracks
Delamination
Fig. 8 Delamination development during impact for a 45/90 interface (ply 2 at 45°, ply 3 at 90°) for a quasi-isotropic [0,45,90,−45,−45,90,45,0] laminate, and for four load levels before the max load
a)Macro-crack of 45° ply b) delamination: cohesive zone c) Macro-crack of 90° ply
Fig. 9 View of macro-cracks and delamination area for a 45/90 interface, quasi-isotropic [0,45,90,−45,−45,90,45,0] laminate
The numerical indentation is defined as the relative displacement of the upper and lower faces corresponding to maximum force (Fig.11). Since the CDM model is elastic, this value corresponds to the maximum indentation during impact. This indentation is expected to be comparable to the residual indentation measured after tests. Figure11shows the numerical prediction using the models (dark blue for the CM, dark green for the CDM) and the residual experimental indentation. The typical values are 0.16 mm for experimentation, 0.22 mm for the CDM and 0.32 mm for the Cohesive Model. The shape of the indentation is also better recovered by the CDM. Note that the indentation has been measured 48 h after the experi-mentation while the numerical depth does not take into account any dynamic relaxation. The CDM is considered to be more predictive.
The CDM simulations carried out with flexural modulus Ef, instead of tensile modulus E11, is compared quite well to the global response. The initial stiffness of the plate is well captured by the simulation and the time of damage initiation is also satisfactory. The time of impact is quasi-identical compared to the experimentation and slightly lower than the one predicted by the CM. It is also important to take the strain rate effects into account through the evolution of dynamic stress threshold valueσdyn(a limit of stress function of deformation velocity). This allows better predicting the orientation and the size of delamination surface. The localization of damage by usingσdyndissipates the energy in the suitable areas and prohibits the diffusive behaviour observed when using quasi-static yield stress values. Note that the CDM gives also better predictions of the location and the sizes of the delamination areas (see Figs.1and3). Furthermore, no adjustment was done on the material data from the characterization tests while it is required to do it for the CM. It is then concluded that the CDM developed is“mechanically intrinsic”, and is able to predict the damages after impact. The model is used in the next sections to model large scale structures to predict the resistance for Compression After Impact. Fig. 10 Experimental and numerical force [N] versus time [ms] history curves
Table 4 Force (N) versus time (ms) results
Maximum force (N) / time (ms) Contact time (ms)
Cohesive model (Ef) 8,200 / 1.75 3.3
Continuous damage model (Ef) 8,300 / 1.3 3.05
3 Virtual Testing of Composite Fuselage
The residual stresses in aeronautical structures subjected to a dynamic loading such as impact must be studied. These stresses are directly related to composite material damage. The study of composite material damage requires the development of numerical models representative of the highly non-linear behaviour of the sub-structures, of their links and of the involved materials. This numerical model must be consistent with the material mechanical behaviour. This behaviour has been identified in a previous study [16]. It is known at smaller scale through scientific characterization and engineering models. Computer-aided design needs predictive numerical models. Furthermore, the final full scale design requires minimum computational time and less expensive methods and tools.
The two numerical techniques presented previously could give similar global projected delaminated area predictions. Both methods are quite easy to be developed in classical rapid non-linear finite elements computer codes used in aeronautical companies without any tre-mendous specific program interface. It is evident though that the CM needs to pre-localize the links that will be broken between adjacent blocks of material. This need is not required for the CDM. Moreover, the composite material modelling through ply damage seems to be a necessary condition to determine the external impact indentation. Thus, the CDM model could be thought to be able to represent the residual external indentation if a plastic behaviour is added to the elastic model.
The developed CDM model being necessary and sufficient for impact prediction of a laboratory plate, the questions to be addressed here are: (i) is the CDM model a sufficient and robust method to analyse impact damage tolerance of a structure, (ii) is the CDM model usable for computer-aided design and for the assessment of the fuselage? As a first trial in answering these questions, the results of two computations are presented: numerical CAI on a laboratory plate and on a composite fuselage.
3.1 Impact Damage Tolerance: CAI
The key point of impacted composite structures certification is to demonstrate that their residual strength is not reduced below a certain expected limit. For this, several CAI exper-imental tests are performed. Some authors [21–24] have tried out to numerically simulate these experiments. In these simulations, damage due to impact loading is either idealized or simplified and not directly linked to damage state issued from impact simulations. Then, the Fig. 11 a Surface of the impacted face b Indentations curves [mm] for different results
objectives of this part are to briefly present the first results of CAI simulations performed with the CDM model for numerically impacted plates.
The simulations were performed using the explicit LS-Dyna which requires that some parameters in the simulations have to be carefully chosen to minimize the influence of dynamic effects during the compressive quasi-static loading phase. The adopted methodology divides the simulation into two stages. The first one is a pre-compression damping where convenient damping parameters are fitted to make the specimen reaches an equilibrium static state. The second one is the compressive loading where the loading rate has been adjusted to obtain a reasonable time of computation for each CAI simulation.
The whole model is the one used for impact simulations presented previously with the restriction that structural damping has been added to relax elastic stresses after impact. To agree with CAI test boundary conditions, the four edges are all constrained in out-of-plane direction. Two side edges are only free in the loading direction. The loading edge is applied with constant velocity movement. The lower support edge is constrained in the loading direction. In CAI simulation, the specimen being mainly under compressive loading, the longitudinal fibre modulus has been fixed to the compressive modulus (E11=165 GPa for T800S/M21 cf. Table2). The materials and plate specimen dimensions are taken the same as impact tests presented in section2.1.
Figure 12 shows the CAI numerical results of the damage parameter (d12) defined by Lachaud et al. [16] of a [−45/+45/0/90/0/0/−45/+45/0]S T800S/M21 laminate. Moreover, Fig. 13shows the comparison of the numerical (Internal damage parameter d4 defined by Lachaud et al. [16]) and experimental (C-Scan) CAI values of the global projected delaminated area. Also, it can be shown that the CDM model handles for the propagation of delamination created by impact (biggest at the bottom) and also new delamination and macro-cracks zones generated through the width of plates during global buckling (major at the top) (see Fig.14). The contribution of each failure mode (ri) on the macro-crack and on the delamination can been quantified during impact and during CAI. These promising results are to be balanced with respect to the model difficulties to capture local buckling (Fig.15). The residual strength is still fairly overestimated [10].
Fig. 12 Numerical results of CAI of a [−45/+45/0/90/0/0/−45/+45/0]s laminate: iso-color of the damage parameter (d12)
3.2 Fuselage Resistance Against Impact
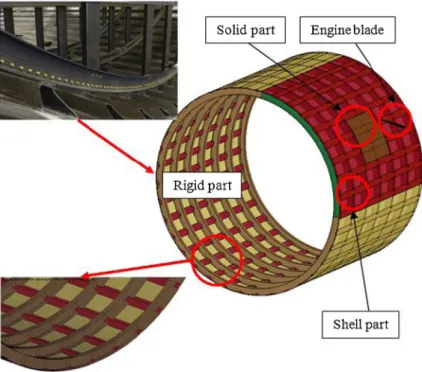
The aim of the simulation is to handle the computation time, the mesh sensitivity and the global behaviour of the model, in a qualitative way. Using the same CDM model, the finite elements model of a fuselage section has been built [14]. The fuselage has approximately a diameter of 4 m and a length of 3 m (Fig.16). The stiffeners areΩ shaped and the frames are U shaped. The projectile is a warped shell composite structure of approximately a length of 47 cm and a weight of 0.5 kg. The projectile rotates and flies at 460 m/s to simulate a Fan Blade (energy of 53 kJ). The simulation ran over 1 ms.
Fig. 14 Evolution of internal damage d4in third stage (20 J)
The skin frames and stiffeners of the fuselage and the projectile are modelled using composite shells elements. In these elements, the number of integration points in the thickness is equal to the number of layers, except in the impact zone of the section where 8 nodes solid elements have been used. Figure16shows the whole model using 8 nodes solid elements in the impacted portion (maroon cylinder, 6 mesh cells). Kinematic symmetry conditions are set at the extremities of the fuselage section. The stiffeners and frames are linked to the skin using a breakable contact condition with an initial offset position, and are merged together as a first approximation. The shell_to_solid interface is simply modelled through kinematic links
Fig. 16 Finite element (LS-DYNA model) of a centre aircraft fuselage section, M=0.5 kg, v=460 m/s (engine fan, 53 kJ)
between the boundary nodes on the splicing zone. Figure17 shows the model assembling details. The typical dimensions of the mesh are 15cm×15cm×0.25 mm in the impacted zone (one layer of solid elements for each UD composite layer).
Fig. 18 Delamination initiation and propagation in the fuselage skin; interaction with the stiffeners and the frame; hole of 110×130 mm2at 0.88 ms
Fig. 17 Zoom of the mesh splicing between the fuselage skin (red shells) and the impacted zone solid mesh; offset of the stiffeners and frames
One fourth of the fuselage section circumference is deformable (red skin); the rest is supposed non deformable (yellow skin). The staking sequence and the material properties were taken the same as for the lab sample impact simulations. The developed CDM is used in the fuselage impacted solid meshed zone. A damage shell material model available in Ls-Dyna software is used for the deformable shell elements. All elements are killed when a failure criterion is reached to create the hole (global amount of damage and limit strains or stresses in the impacted zone, time step in the shell elements).
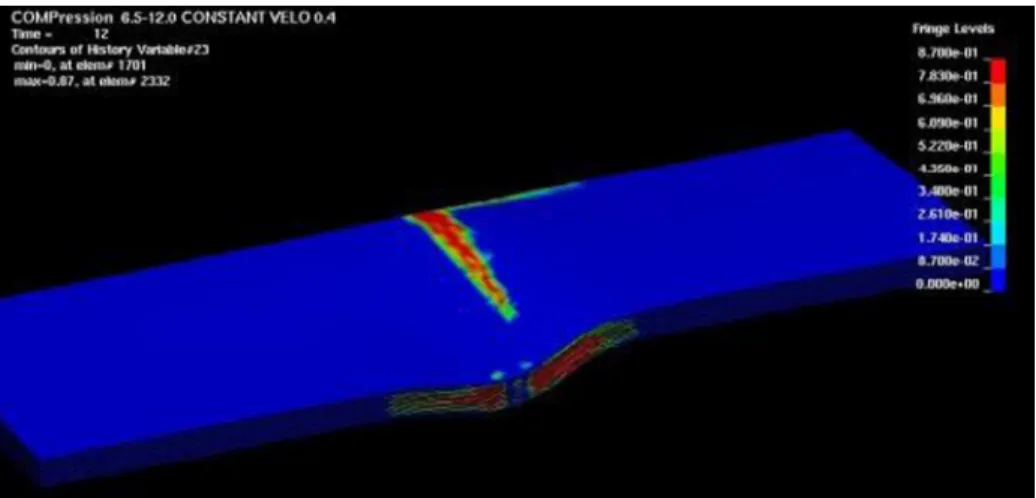
Figure18shows the evolution of 3D iso-contours of delamination in the fuselage impacted zone. The horizontal and vertical lines design geometrical limits of frames and stiffeners. The skin and the projectile are transparent. The projectile hits the structure at the location of a stiffener. It can be seen from the first contact between the projectile and the fuselage that the delamination area is limited by the stiffener boundaries. The typical dimensions of the global projected delaminated area are 110×130 mm2.
The global initiation and propagation delamination propagates in the direction of the stiffeners boundaries until a hole is initiated (0.88 ms). After initiation, the hole propagation becomes unstable and splicing boundaries are rapidly reached. At this point, the simulation is not physical anymore. Figure 19 presents the hole propagation results of the solid part at different computation times. The surrounding shell elements are visible in a transparent manner.
The global behaviour is considered to be qualitatively correct during the hole initiation phase. The damage criteria are representative of the stress concentrations; although criteria are
supposed to be derived for small REV (Representative Elementary Volume). The meshes of 15 cm×15 cm cannot be considered as REV for fine damage modelling. Improvement has to be done in future works.
4 Perspectives and Further Improvements: SPH Modelling 4.1 Smooth Particle Hydrodynamic Method Principle
The space discretization of the material deformation must be coherent with the deformation of models and vice versa. Thus, following the first three previous steps, it is logical to consider the material as a safe-continuous material able to open if one or more failure criteria are achieved. The Smooth Particle Hydrodynamics Method (SPH) is a spatial discretization method that fits these two criteria [25]. The SPH method has proved its capacity to model fractures and openings for isotropic materials under dynamic loadings [26]. It is then necessary to insure that anisotropy, low loading rates, tensions and openings can be handled. A special total Lagrangian formulation was developed for this purpose. The elastic behaviour assump-tion will be used in the numerical models. The stability of the method is presented in a previous work [19]. The anisotropy of each ply is taken into account through a 3D orthotropic elastic model. The damage evolution, possible for this material model of code Ls-Dyna, was actually not used here. Each ply is modelled by a layer of SPH particles placed in the direction of the chosen stacking sequence. The orthotropic reference is followed in each particle during time.
Good qualitative results have been obtained for hyper velocity impact. The first trial of the SPH method using the damage material criterion was not really a success regarding the computation duration for low velocity impact. Furthermore, the use of SPH method to automatically generate the continuity between particles is hardly cut using the damage criteria. The link between particles is defined over the whole domain of the kernel function. The methods to use level sets in order to truncate the kernel support exist but they have not been implemented yet. Thus, opening is mostly effective in situations where the momentum and the mass are highly concentrated. This is essentially the case of high speed impact. Good results have been also found for hyper velocity impact simulations using a“cohesive SPH” model. 4.2 SPH Simulation Model
The numerical models used for impact simulation are shown on Fig. 20. A progressive meshing is used for finite element model (FE) in order to obtain shorter computational time.
In the case of coupled FE-SPH model, the central zone having dimensions of 32×32 mm2is discretized by 12,000 particles. These particles are kinematically constrained to finite elements at the boundaries of both discretizations. Only one finite element and similarly one particle are used per ply.
The plate and the support are modelled by eight nodes finite elements (3 DOF per node) with one integration point. Each ply has orthotropic elastic material properties. The material properties are the same as already defined in Table3. A total number of 30,500 solid elements constitute all FE model. The support and the impactor are modelled by rigid elements. The mass of the projectile and the impact velocity are taken 1.369 kg and 2.42 m/s, respectively. The frictionless penalty based contact algorithms are introduced between (i) the projectile and the plate, and (ii) the plate and the support. The dimensions of the projectile and the support are the same as described previously for all impact simulations.
4.3 SPH Versus Finite Element Results
Damage has not been taken into account in the numerical simulations. The transitory forces between the plate and the projectile are compared as well as the displacement of the plate non-impacted face centre. The force-time curves show that the first peak and the rising plateau region are well captured by the numerical model (Fig.21). The contact duration is also close to the experimental value. The time corresponding to maximum displacement is the same for the experimentation and the simulation. The small difference between the maximum experimental and the maximum numerical displacement is explained since damage in the numerical model was not taken into account. In this case, the numerical responses are more rigid. Except the elastic stiffness, the numerical results are close compared with the experimental results. The
Table 5 Comparison of experimental tests, FE and FE+SPH numerical models
Maximum displacement (mm) Peak load (N)
Experimentation 4.58 at 2.9 msec 1900 (ref)
Model FE 4.62 at 3.0 msec 2350 (+23 %)
Model FE+SPH 4.41 at 2.8 msec 2250 (+18 %)
values of the different maximum displacement and the different peak load corresponding to the experimentation and to the numerical simulations are presented in Table5.
To further illustrate the previous point, a cross section view along global y-direction of the numerical model is shown in Fig. 22 at maximum displacement (t=2.8 msec). In both numerical models, the extent of each delamination ellipse (Fig.23a) between the last two plies (5 mm long) is shown. In this zone, the stresses along x-direction, the transverse shear stresses (xz-plane) and the tensile stresses along y-direction are superposed. Similarly in the second last ply, oriented at 90°, there is a zone where the normal stresses in the directions of x and y of 40–95 and 115 MPa, respectively, are superposed (Fig.23b and c). The shear stress levels envelope is oriented in the direction of delamination observed in the last two plies and has the same ellipsoidal shape. The spacing between the ellipses is symmetric in calculations
Fig. 23 Qualitative prediction of damage initiation along global xz-plane Fig. 22 Contact surface from FE+SPH and FE numerical models
and is of the same order of magnitude as delamination ellipses observed in the experimentation.
5 Conclusions
In this paper, different numerical strategies to predict the compression after impact (CAI) residual strength of an impacted composite fuselage are developed. A Cohesive Model (CM) is first developed and based on the classical methodology used for aircraft structures models. A new Continuous Damage Material model (CDM) that couples different failure criteria to compute the residual damage states is then pre-sented. Finally, a Mixed Methodology (MM) is developed. This final methodology uses CDM method for delamination initiation at the interfaces, and CM for cracks propagation. A comparison between different methods has been done in term of their capacity to predict the sample resistance against impact using explicit non-linear computations. Indeed, the CM method is able to model quite well the global behav-iour of the plate (force/time or displacement/time). However, it over-estimates the indentation due to impact. On the other hand, the CDM model is able to finely predict the extent and the location of delamination zones for various impact energies using the coupling failure modes. The coupling between matrix cracks and delamina-tion has been proved to be efficient. Comparisons are made between the numerical simulations and the experimental tests.
Finally, the MM strategy gives the same precision in delamination extent as the CDM but is not cost effective. This strategy is quite new and had not been developed before. It is based on discrete methods and generalized continuum mechanics. As a first trial, specific developments have been made in the Smooth Particle Hydrodynamics (SPH) method to take into account the anisotropic behaviours. This method could be thought as a good alternative to continuous methods in order to simulate high strains or strain rates loadings (crash, Hyper Velocity Impacts, machining…).
Acknowledgments The authors are grateful of Higher Education Commission of Pakistan for partial funding. Special thanks are also extended to IMPETUS Afea France and all the students and technical staff of ISAE for their valuable input towards numerical and experimental aspects, respectively.
Appendix A
Fig. 24 View of delamination size for 0/45 interface and damages of 0° plies after impact, [02,452,90,−452,02,−452,90,452,02] laminate (non impacted face)
Fig. 25 View of delamination size for 452/90 interface and damages of 45° plies after impact, [02,452,90,−452,02,−452,90,452,02] laminate
Fig. 26 View of delamination size for 90/−452 interface and damages of 90° ply after impact, [02,452,90,−452,02,−452,90,452,02] laminate
Fig. 27 View of delamination size for −452/02 interface and damages of −45° plies after impact, [02,452,90,−452,02,−452,90,452,02] laminate
Fig. 28 View of delamination size for −452/02 interface and damages of 0° plies after impact, [02,452,90,−452,02,−452,90,452,02] laminate
References
1. Abrate, S.: Impact on composite structures. Cambridge University Press, (1998)
2. Richardson, M.O.W., Wisheart, M.J.Y.: Review of low-velocity impact properties of composite materials. Compos A 27A, 1123–1131 (1996)
3. Reifsnider, K.L., Case, S.W.: Damage tolerance & durability in material systems. Wiley-Intersciences, ISBN-10 0471152994 (2002)
4. Shi, Y., Pinna, C., Soutis, C.: Modelling impact damage in composite laminates: a simulation of intra- and inter-laminar cracking. Compos Struct 114(Aug), 10–19 (2014)
Fig. 29 View of delamination size for -452/90 interface and damages of −45° plies after impact, [02,452,90,−452,02,−452,90,452,02] laminate
Fig. 30 View of delamination size for 90/452 interface and damages of 90° ply after impact, [02,452,90,−452,02,−452,90,452,02] laminate
Fig. 31 View of delamination size for 452/02 interface and damages of −45° plies after impact, [02,452,90,−452,02,−452,90,452,02] laminate (impacted face)
5. Mi, Y., Crisfield, M., Davies, G., Hellweg, H.: Progressive delamination using interface elements. J Compos Mater 32, 1246–1272 (1998)
6. Alfano, G., Crisfield, M.: Finite element interface models for the delamination analysis of laminated composites: mechanical and computational issues. Int J Numer Methods Eng 77(2), 111–70 (2001) 7. Reedy Jr., E.D., Mello, F.J., Guess, T.R.: Modeling the initiation and growth of delaminations in composite
structures. J Compos Mater 31(8), 812–831 (1997)
8. Windisch, M., Sun, D.-Z., Memhard, D., Siegele, D.: Defect tolerance assessment of Ariane 5 structures on the basis of damage mechanics material modelling. Eng Fract Mech 76, 59–73 (2009)
9. Bertolini, J., Castanié, B., Barrau, J.J., Navarro, J.P.: Multi-level analysis of skin/stringer debonding. ICCM17, Edimburgh, 27–31 July, United Kingdom, (2009)
10. Chen, C., Espinosa, C., Michel, L., Lachaud, F.: A numerical approach for analysing post-impact behaviour of composite laminate under in-plane compression. ECCM 15, Venice, 24–28 June, Italy, (2012) 11. Prombut, P., Michel, L., Lachaud, F., Barrau, J.J.: Delamination of multidirectional composite laminates at
0°/θ° ply interfaces. Eng Fract Mech 73(16), 11 (2006)
12. Tay, T.E.: Characterization and analysis of delamination fracture in composites, an overview of developments from 1990 to 2001. Appl Mech Rev 56(1), 1–32 (2001)
13. Lachaud, F.: Contribution à l’analyse multi échelle du comportement non linéaire matériau des structures composites. Habilitation à Diriger des Recherches, Université de Toulouse. France. http://oatao.univ-toulouse.fr/5165/. (2011)
14. Ilyas M.: Damage modelling of carbon epoxy laminated composites submitted to impact laoding. PhD thesis, Université de Toulouse, ISAE, France, (2010)
15. Bouvet, C., Castanie, B., Bizeul, M., Barrau, J.J.: Low velocity impact modeling in laminate composite panels with discrete interface elements. Int J Solids Struct 46, 2809–2821 (2009)
16. Lachaud, F., Espinosa, C., Michel, L., Rahme, P., Piquet, R.: Modelling strategies for simulating delamina-tion and matrix cracking in composites laminates. Appl Compos Mater (2014). doi: 10.1007/s10443-014-9413-4
17. Shi, Y., Pinna, C., Soutis, C.: Interface cohesive elements to model matrix crack evolution in composite laminates. Appl Compos Mater 21, 57–70 (2014)
18. Ilyas, M., Limido, J., Lachaud, F., Espinosa, C., Salaun, M.: Modélisation SPH 3D de l’impact basse vitesse sur plaque composite. 19èmeCongrès Français de Mécanique, Marseille. France, (2009)
19. Ilyas, M., Espinosa, Ch., Lachaud, F., Salaün, M.: Dynamic delamination using cohesive finite elements. 9th International DYMAT conference, 7–11 September, Brussels, Belgium, (2009)
20. Guinard, S., Allix, O., Guédra-Degeorges, D., Vinet, A.: A 3D damage analysis of low-velocity impacts on laminated composites. Compos Sci Technol 62, 585–589 (2002)
21. Aboissière, J.: Propagation de dommages d’impact dans un matériau composite stratifié à fibres de carbone et résine époxyde. PhD Dissertation, Université de Toulouse, France, (2003)
22. Guédra-Degeorges, D.: Recent advances to assess mono- and multi-delamaminations behaviour of aerospace composites. Compos Sci Technol 66, 796–806 (2006)
23. Suemasu, H., Sasaki, W., Ishikawa, T., Aoki, Y.: A numerical study on compression behavior of composites plates with multiple circular delaminations considering delamination propagation. Compos Sci Technol 68, 2562–2567 (2008)
24. Craven, R., Iannucci, L., Olsson, R.: Delamination buckling: a finite element study with realistic delamina-tion shapes, multiple delaminadelamina-tions and fibre fracture cracks. Compos A: Appl Sci Manuf 41(5), 684–692 (2010)
25. Liu, G. R., Liu, M. B.: Smoothed particle hydrodynamics—a Meshfree particle method. World Scientific Publishing Co, (2003)
26. Silvestrov, V.V., Plastinin, A.V., Gorshkov, N.N.: Hypervelocity impact on laminate composite panels. Int J Impact Eng 17, 751–762 (1995)
![Fig. 1 Comparison between tests and models (cohesive only) of the delamination area, T800/M21 [−45,45,0,90,0 2 , −45,45,0] S laminate](https://thumb-eu.123doks.com/thumbv2/123doknet/3218024.92015/6.659.76.589.83.304/fig-comparison-tests-models-cohesive-delamination-area-laminate.webp)
![Fig. 3 Comparison between tests and models of the delamination area for the CDM damage behaviour, T800S/ M21e material, [ −45,45,0,90,0 2 , −45,45,0] S laminate](https://thumb-eu.123doks.com/thumbv2/123doknet/3218024.92015/7.659.73.589.82.414/comparison-tests-models-delamination-damage-behaviour-material-laminate.webp)
![Fig. 5 Finite element model of impact sample with ply-delamination coupling using inter and intra laminate cohesive elements, [0 2 ,45 2 ,90, −45 2 ,0] S laminate](https://thumb-eu.123doks.com/thumbv2/123doknet/3218024.92015/8.659.76.593.94.358/finite-element-delamination-coupling-laminate-cohesive-elements-laminate.webp)
![Fig. 6 Comparison between experimentation and modelling of the delamination size after impact (15 J), T2H/ EH25 material, [0 2 ,45 2 ,90, −45 2 ,0] S laminate](https://thumb-eu.123doks.com/thumbv2/123doknet/3218024.92015/9.659.71.589.79.252/fig-comparison-experimentation-modelling-delamination-impact-material-laminate.webp)
![Fig. 8 Delamination development during impact for a 45/90 interface (ply 2 at 45°, ply 3 at 90°) for a quasi- quasi-isotropic [0,45,90, −45,−45,90,45,0] laminate, and for four load levels before the max load](https://thumb-eu.123doks.com/thumbv2/123doknet/3218024.92015/10.659.78.592.80.211/delamination-development-impact-interface-quasi-isotropic-laminate-levels.webp)
![Fig. 11 a Surface of the impacted face b Indentations curves [mm] for different results](https://thumb-eu.123doks.com/thumbv2/123doknet/3218024.92015/12.659.72.591.81.272/fig-surface-impacted-face-indentations-curves-different-results.webp)
![Fig. 13 Internal damage after total failure: a d 4 parameter [16], b C-Scan after CAI test](https://thumb-eu.123doks.com/thumbv2/123doknet/3218024.92015/14.659.71.594.514.900/internal-damage-after-total-failure-parameter-scan-after.webp)