To link to this article: DOI:10.2166/ws.2015.160
http://ws.iwaponline.com/content/early/2015/11/24/ws.2015.160
This is an author-deposited version published in: http://oatao.univ-toulouse.fr/ Eprints ID: 14713
To cite this version:
Nouasse, Houda and Chiron, Pascale and Archimède, Bernard Contribution to a flood situation management: a supervisory control scheme to reduce disaster impact. ( In Press: 2015) Water Science and Technology: Water Supply. ISSN 1606-9749
O
pen
A
rchive
T
oulouse
A
rchive
O
uverte (
OATAO
)
OATAO is an open access repository that collects the work of Toulouse researchers and makes it freely available over the web where possible.
Any correspondence concerning this service should be sent to the repository administrator: [email protected]
Contribution to a flood situation management: a supervisory
control scheme to reduce disaster impact.
H. Nouasse*, P. Chiron*, B. Archimède*
* University of Toulouse, INPT, ENIT, LGP, 65016 Tarbes, FRANCE, [email protected], [email protected], [email protected]
Abstract: Inundations due to river overflows are becoming more frequent; management of flood is thus
an important task belonging to the set of preventive measures allowing the protection of people and goods downstream. The flood situation management method proposed in this paper was designed to reduce the flood impact at its early arising stage. The river is supposed to be equipped with reservoirs in which water excess are stored and then released only when the flood episode ends. The supervisory control scheme allows calculating the water volumes through the use of a network flow. The management objectives such as the maximum discharge level allowed in the river, the order of priority for the reservoir storage or release; the measured levels and discharge in the river and in the reservoirs; and the assessed parameters such as time delays, are combined to configure the network flow. Then, the optimal flow in the network is computed and supplies the reservoirs’ gate opening setpoints. Finally, the method was applied to a simulated case for which the time delay during the flood varied and remained efficient for flood attenuation compared to the case when the gates were always open, thanks to the network configuration.
Keywords: Flood control; Network flows; Time delay; Water systems management.
INTRODUCTION
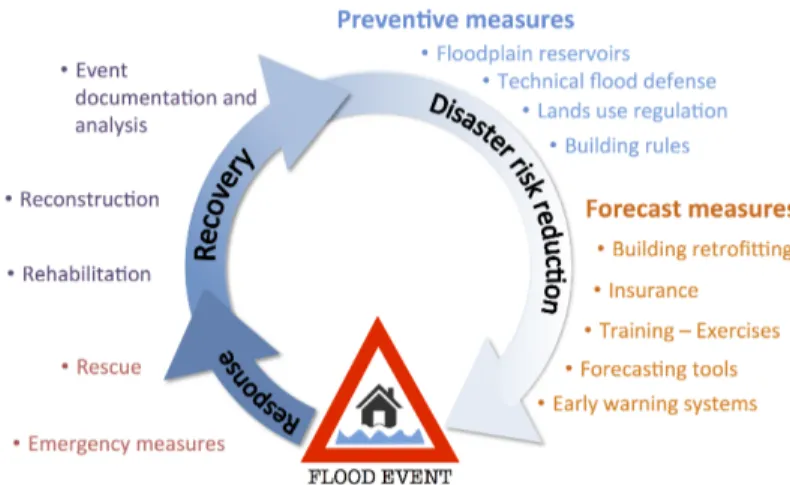
Flooding due to excessive rains can cause important human and material damages around the world. The frequency of these events and their scale is increasing, as well as the importance of the human and material damages caused (Wagenknecht and Rueppel, 2013). In this context, the term of crisis is generally used for floods leading to an actual inundation in a limited geographical zone and for which numerous assistance interventions are needed in order to help the inhabitants either to protect residential areas or to proceed to evacuations. It is essential to consider that the crisis began at the early occurrence of the flood phenomenon. It permits to study and implement the means leading to a fast recovery and to inform the inhabitants, to prepare and dispense the protection, even in high-risk areas (Merz et al., 2010; Plate, 2002).
Figure 1: Management crisis cycle, adapted from (Thieken et al., 2007).
Crisis management is the set of organizational methods, techniques and means that enable an organization to prepare for and to effectively manage the occurrence of a crisis; and, in a prospective vision, to capitalize the lessons of the event to improve procedures and structures. In order to set up an effective management of crisis, three principal phases
must be considered (see Figure 1): before the flood where it is necessary to plan, to prevent, to prepare, to protect and to anticipate crisis situations, during the flood where the effective management of crisis is performed and finally after the flood the where a relevant feedback of the learning experience should be performed in order to improve the first phase and to implement the means for the resilience (Hooijer et al., 2004; Thieken et al., 2007).
Forecast and prevention programs are provided by states in order to face the flood events undergone in the world. Thus, the European Commission supports and finances projects in order to develop forecasting and alerting systems to warn communities of impending floods. The various projects described in the literature focuses on different aspects of the crisis management and numerous software were developed (Alfieri et al., 2013; Liechti et al., 2013; Pengel et al., 2013).
The present paper focuses on the phase preceding the inundation event. The potential flood is detected and the peak flow is reduced in order to limit the downstream flood impact, and if possible to avoid the inundation. For this purpose, flood control areas existing along the river are used as reservoirs. In order to reduce the water velocity in the river, the reservoirs are filled with water thus the flood wave is attenuated.
Various research works have been proposed to reduce flood peaks and volumes, involving linear programming (Needham et al., 2000), or hybrid analytic/rule-based approach (Karbowski et al., 2005) for example. Most of these methods do not allow controlling the duration of water storage in the reservoir, the storage and release dates... In order to improve the managers’ decisions during these abrupt climatic phenomena, optimization techniques were proposed such as linear programming (Karamouz et al., 2003), fuzzy optimization (Fu, 2008), and multi-objective optimization (Chuntian and Chau, 2002). Herein, a supervisory control scheme is proposed to handle the water volumes. This scheme, including the variation of time delay with discharge, is described in Section 2. Different flood situations are compared for a simulated river system in section 3, showing the effectiveness of the scheme.
SUPERVISORY CONTROL SCHEME
Supervisory control methods permit to combine optimization, regulation, and simulation techniques. In order to help the decision-making process, the supervision, detection and diagnosis tools are integrated and diverse schemes and architectures are proposed in the literature (Isermann, 1997). The supervision step consists in the detection, the estimate, the prognosis of the system state, the diagnosis of this state, the computation of the setpoints and, if necessary, the control law reconfiguration.
General Scheme
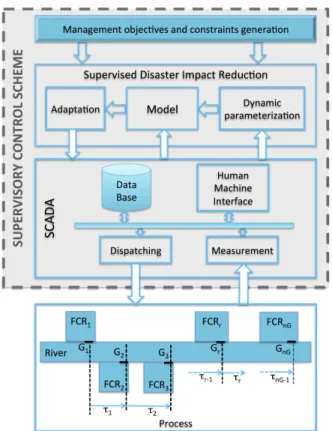
The supervisory control scheme proposed in this paper is depicted in Figure 2. It is composed of three interconnected blocks: the SCADA (Supervisory Control and Data Acquisition) system, the management objectives and constraints generation (MOCG), and the supervised disaster impact reduction blocks. This scheme was designed in order to reduce the impact of a flood downstream a river. For this purpose the river is equipped with 𝑛" flood control reservoirs located along the river, denoted 𝐹𝐶𝑅&.
The reservoirs are used to store the excess of water such that the output river discharge, 𝑄()*, remains under a predefined flow value, 𝑄+,-: the attenuation threshold. Each reservoir is provided with a controlled gate 𝐺&, 𝑟 = 1, … , 𝑛". The opening value of each gate is computed by the proposed scheme.
When the reservoirs are not empty, the stored water can be released if the discharge level in the river is lower than the attenuation threshold 𝑄+,-. In order to detect when the water can be released from the reservoir, a threshold, 𝑄5(, is defined.
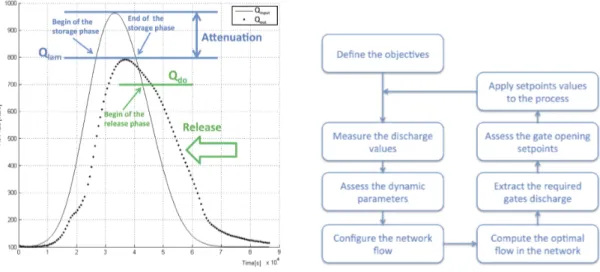
The storage and release phases are exemplified in the Figure 3, where 𝑄678)* is the input
discharge in the river.
Moreover, the threshold 𝑄5( can be defined in order to include the protection of farming usually present in the reservoirs in the release objective, and to be able to control flood episodes with near occurrences.
Figure 3: Storage and release phases. Figure 4: Supervisory process.
Based on the network flow model of the system composed by the river and its reservoirs, the functioning of the scheme is sequenced with eight steps. After defining the management objectives and constraints, the process follows an infinite closed loop including the activities given in Figure 4.
Supervisory Control and Data Acquisition system (SCADA) block
The SCADA block is connected to the river process. It permits to collect data from sensors and to send control values to actuators. Measured and setpoint values can be sent
to or given by an operator through a Human Machine Interface. Such SCADA system can be found in various kinds of systems such as irrigation canals (Figueiredo et al., 2013; Pfitscher et al., 2012), inland navigation networks (Duviella et al., 2013), or energy management (Mora et al., 2012). In our scheme, it transmits the sensors’ values to the Supervised Disaster Impact Reduction (SDIR) block, and receives the gate opening setpoint values in order to send them to the process. The measurements considered herein are levels and discharges.
Management Objectives and Constraints Generation (MOCG) block
The MOCG block supplies the SDIR block with management constraints and rules such as threshold values, 𝑄+,-, 𝑄5(, and the priority parameters allowing, for example, to favor one of the reservoirs, or to define a reservoir assignment order. Some of these values are defined depending on the government organization directives. Moreover, in the network modeling the system, the arc can be weighted with costs in order to evaluate the strategies and take decisions improving the management. The cost values defined in the MOCG block depends on cost-benefit analysis including an estimation of the costs of the various water usages and risks (Karamouz et al., 2003; Loucks et al., 2005). The costs definition in the objective function relies on:
• The need to avoid, reduce or delay as long as possible the inundation downstream the river,
• The reservoir nature (agricultural zone, fallow…), • The reservoir capacity,
• The reservoir usability,
• The protection of the farming existing in the reservoir, • The maximal duration of the water retention,
• And on the necessity of preserving the water quality in the reservoirs.
Supervised Disaster Impact Reduction (SDIR) block
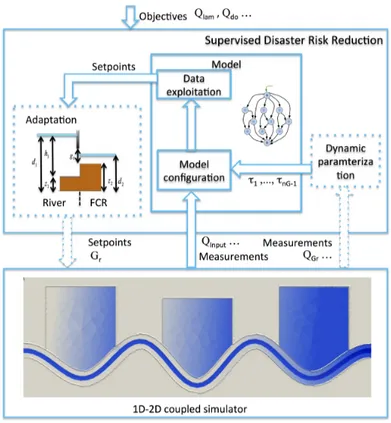
The management constraints are taken into account, according to the measured values, thanks to the SDIR block, which is detailed in the upper part of Figure 5. In order to manage the flood episode, control method must be associated to a scheduling method (Baldea and Harjunkoski, 2014). Indeed, while tracking the overflow of the discharge in case of floods, we need to establish a diagnosis of the process state, to optimize the storage and the release of the water volumes in the flooding reservoirs and to control the opening of their gates. We choose to implement a management method based on the network flow describes in detail in (Nouasse et al., 2013a, b, c). This SDIR block includes:
• The Dynamic Parameterization (DP) block allowing to supply the SDIR with all the necessary dynamic parameters such as the costs and the time delays obtained by the use of estimation techniques for example.
• The Model block producing the setpoint values for each reservoir. The model involved in this block is based on a network flow modeling the network, the reservoirs and their management. For each kT;, k = 0, ⋯ , n, in the horizon H@, with H@ = nT;, n ∈ ℕC. This model is firstly configured according to the measures
and to the dynamic parameters values: maximum and minimum arc capacities are set depending on the delayed flow and on the reservoirs dimensions; the release or storage functioning mode are defined on the basis of the diagnose state of the flow. Then, in the data exploitation phase, the optimal flow is computed by applying a Min cost Max flow problem resolution for this network, producing the setpoint discharge values. The proposed implementation of the network flow includes time delays. If the time delays vary, the network structure is not impacted
thus it is not necessary to add node or arc, only network parameters are modified (Nouasse et al., 2013b).
• The Adaptation block converting the setpoint values supplied by the model in values adapted with the process actuators controller and thus understood by the SCADA system. In fact, the water crosses the gravitational reservoirs gates thanks to the difference between the levels inside the reservoir and in the river. Thus discharge setpoint values need to be converted in level values. The Bernoulli equation is applied to the flow between the river and the reservoir to derive the non-linear static equation representing the dynamic behavior of this structure. Using the measured flow values, the reservoirs’ configuration, the time delays, and the objectives, the SDIR block computes the gate opening setpoint values allowing the output flow to remain under the attenuation threshold.
Figure 5: Simulator and supervisory control scheme.
IMPLEMENTATION AND RESULTS
In order to evaluate the efficiency of the proposed model, a simulation for several cases of flood was done. More often, the dimensioning of the reservoirs is done such that they can attenuate a potential flood; thereby the gates are not regulated. Thus, in each simulated flood case, the method was compared with the case when the gates are always open, which is often the case.
Implementation
The process and SCADA systems were replaced by the implementation of a test case river performed by using a 1D-2D coupled numerical model, according to the description given in (Morales-Hernandez et al., 2013), as illustrated in Figure 5.
In this simulator, each gravitational gate is modeled considering that the flow discharge that crosses the gate is governed by the difference between the water levels in both side of the gate. The 1D-2D coupled simulator entries are the values of the gate opening thus, the Adaptation Block consisted in the computation of the gate opening values from the optimal flow, by means of a static inversion of the free flow open channel equations. The
Dynamic Parameterization block was used in order to compute the time delays at each 𝑘𝑇F 𝑘 = 1, … , 𝑛 . The time delay, 𝜏&, from the gate 𝐺& to the following gate 𝐺&CH (𝑟 = 1, … , 𝑛") depends on the flow discharge. It was approximated by the following equation, (see (Karamouz et al., 2003) for example):
𝜏& = KLM
N.5LM,LMPQ (1)
where 𝑄"M is the discharge measured at gate 𝐺&, 𝑆 is the wetted cross section, and 𝑑"M,"MPQ is the distance traveled from 𝐺& to 𝐺&CH. In order to evaluate time delays, methods such as the ones developed in (Romera et al., 2013) can also be used.
Performance criteria
The flood wave attenuation can be defined as the decrease in the downstream peak flow, due to the attenuation of the flood (Bedient, P. B. et al., 2013). In order to evaluate the performances of the proposed flood attenuation method, two indicators were defined: the attenuation rate (𝐴𝑅), and the attenuation wave rate (𝐴𝑊𝑅). These indicators allow us to evaluate how we prevent downstream flood by using the proposed method. All these indicators are computed over the time horizon 𝐻W, i. e. for 𝑘 = 0, … , 𝑛; and we denote 𝑄()* the downstream flow. The 𝐴𝑅 permits to measure the difference between the attenuation threshold objective and the obtained attenuation threshold. It is defined as the ratio between the mean effective attenuation flow, 𝑄-X,, and the predefined attenuation flow 𝑄+,-, as given in equation (2) and equation (3).
𝐴𝑅 = 𝑄-X, 𝑄+,- (2) 𝑖𝑓 ∃𝑘 𝑄()* 𝑘 > 𝑄+,- 𝑄-X, = 𝑚𝑒𝑎𝑛 Kabc d eKfgh𝑄()* 𝑘 𝑒𝑙𝑠𝑒 𝑄-X, = 𝑚𝑎𝑥 dlH⋯7𝑄()* 𝑘 (3)
𝑄-X, is the mean of all the 𝑄()* which value is greater than 𝑄+,-. In case of flood: 𝑄678)* > 𝑄+,-, if 𝐴𝑅 > 1, the attenuation is not complete and if 𝐴𝑅 < 1, too much water
is stored.
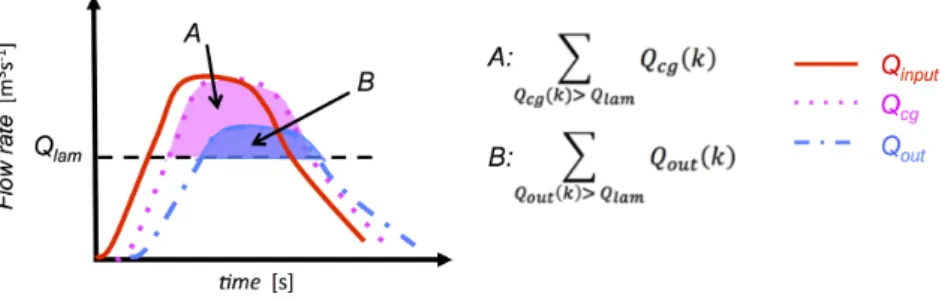
Another estimator of the attenuation capacity is the 𝐴𝑊𝑅, which compares the case where the gates are always closed (indexed cg) to the case in which a strategy is involved. It is illustrated in Figure 6 and is expressed by equation (4).
𝐴𝑊𝑅 = Kqr(d)e Kfgh𝑄Fo 𝑘 − Kabc(d)e Kfgh𝑄()*(𝑘) 𝑄Fo 𝑘
Kqr(d)e Kfgh
(4)
The downstream flow when the gates are closed is denoted 𝑄Fo. The 𝐴𝑊𝑅 value is a
relative estimation of the not attenuated volumes.
Results
Simulation were done within the horizon 𝐻W = 86400s corresponding to 24h, 𝑇F = 100𝑠 thus 𝑛 = 864. The simulated river was equipped with 𝑛" = 3 flood control reservoirs, each one controlled by a gravitational gate.
Figure 7: 𝜏Hand 𝜏z evolution for a 1-peak simulation with 𝑄+,-= 675𝑚}𝑠~H and 𝑄5(= 600𝑚}𝑠~H.
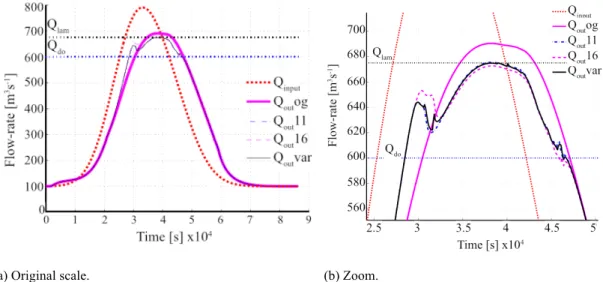
(a) Original scale. (b) Zoom.
Figure 8: 𝑄678)* and 𝑄()* for a 1-peak simulation with 𝑄+,-= 675𝑚}𝑠~H and 𝑄5(= 600𝑚}𝑠~H.
The first case studied is a flood episode, 𝑄678)*, with one peak flow of 790𝒎𝟑𝒔~𝟏
occurring at 𝑘 = 330 i. e. around 9h after the beginning of the simulation. The values of attenuation and draw-off flows were set to 𝑄+,- = 675𝒎𝟑𝒔~𝟏 and 𝑄
5( = 600𝒎𝟑𝒔~𝟏≈
90%𝑄+,-. For this one peak flood, the measured time delays varied between 11𝑇F and
16𝑇F as illustrated in Figure 7. Thus in order to compare the results obtained when the
strategy involved constant time delay or varying time delay, we realized simulation for constant time delays underestimated or overvalued: 𝜏H = 𝜏z = 10𝑇F, 𝜏H = 𝜏z = 11𝑇F, 𝜏H = 𝜏z = 14𝑇F, 𝜏H = 𝜏z = 16𝑇F, 𝜏H = 𝜏z = 18𝑇F. In Figure 8, the 𝑄678)* value is given
in red (dotted) and results obtained for the four following cases are compared. The case one, when the gates are always open (unregulated reservoirs), is given in magenta. The case two, when the proposed strategy is applied with constant time delays: 𝜏H = 𝜏z = 11𝑇F, is given in blue (dotted – dashed). The case three, when the proposed strategy is applied with constant time delays: 𝜏H = 𝜏z = 16𝑇F, is given in magenta (dashed). The
case four, when the proposed strategy is applied with varying time delays expressed as function of flow and computed thanks to the Dynamic Parameterization block, is given in black. When the gates are always open, the peak flood is reduced however; the discharge exceeds the 𝑄+,- value. When time delays are computed, the 𝑄()* curve is between the 𝑄()* curves obtained for the time delays set to their variation interval bounds. In all these cases, the 𝑄()* maximum value is given, and denoted 𝑄-,† in the second column of the Table 1. Without the use of flood control reservoirs the peak flow reaches 777𝒎𝟑𝒔~𝟏,
when the gates are always open, the peak flow reaches 690𝒎𝟑𝒔~𝟏. When the proposed
strategy is applied, the peak flow decreases and it is lower than the 𝑄+,-value when the time delays are computed. When time delays are set to constant values, performance decreases, and we can conclude that it is preferred to overestimate the time delays.
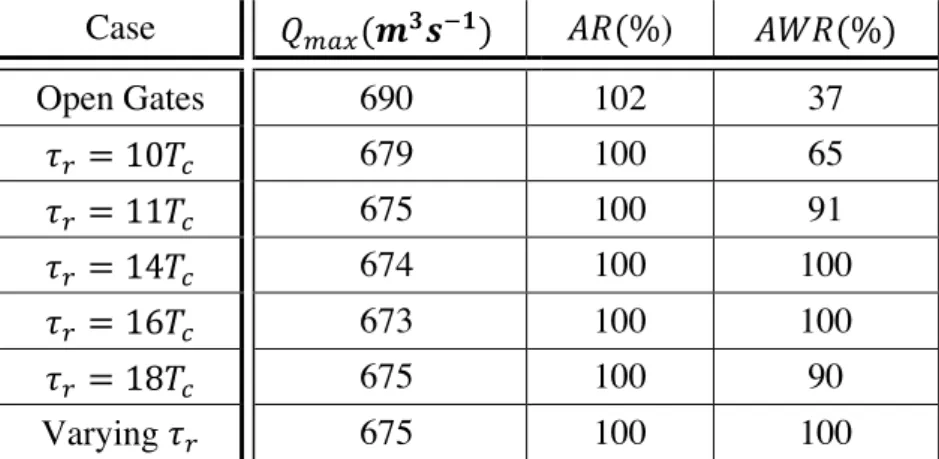
Case 𝑄-,†(𝒎𝟑𝒔~𝟏) 𝐴𝑅(%) 𝐴𝑊𝑅(%) Open Gates 690 102 37 𝜏&= 10𝑇F 679 100 65 𝜏&= 11𝑇F 675 100 91 𝜏&= 14𝑇F 674 100 100 𝜏&= 16𝑇F 673 100 100 𝜏&= 18𝑇F 675 100 90 Varying 𝜏& 675 100 100
Table 1: AR, and AWR values for the 1 peak scenario.
The values of the performance criteria obtained in the studied cases are given in Table 1. Whatever the method used for the time delays computation is, the ability to absorb the flood is increased when using the network flow. Indeed 𝐴𝑊𝑅 = 65% when the time delays are underestimated, and 𝐴𝑊𝑅 = 90% when the time delays are overvalued. When the time delays are set to the minimum value of their variation interval 𝐴𝑊𝑅 = 91%. When the time delays are computed or set to high enough values, 𝐴𝑊𝑅 = 100%, the peak flow is under the 𝑄+,-value. Finally, 𝐴𝑊𝑅 = 37% when the gates are not regulated. The 𝐴𝑅 value is better if it is as close as possible to 100%, which is the case for computed time delays. Finally, in all cases the water volume stored in the reservoir is upper than the estimated needed volume.
The gates’ opening height computed by the algorithm with varying time delays is given in blue in Figure 9(a) for the gate 𝐺H, in Figure 9(c) for the gate 𝐺z and in Figure 9(e) for the gate 𝐺}. The water level inside the reservoir is represented in black and the water level in the river in front of the gates in red. The water levels are measured with regard to the riverbed. In each figure, the gate is first opened in order to store water, thereafter, during the phase when the discharge is between 𝑄+,-and 𝑄5(the gate is closed and finally, the gate is opened in order to empty the reservoir.
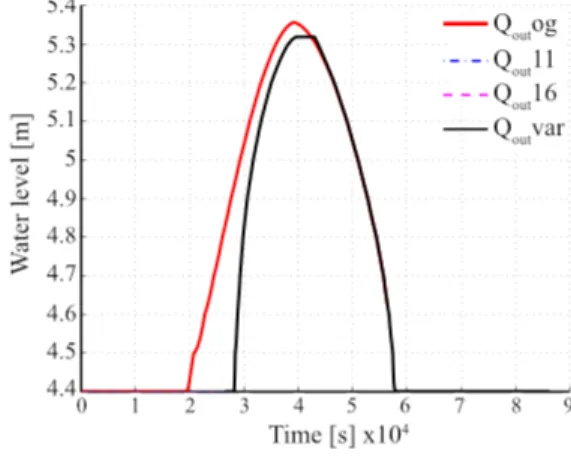
In the fourth illustrated cases, the water level inside the reservoirs is superimposed in Figure 9(b) for the gate 𝐺H, in Figure 9(d) for the gate 𝐺z and in Figure 9(e) for the gate 𝐺}. The always-open gates case is given in red. The proposed strategy applied with constant time delays: 𝜏H = 𝜏z = 11𝑇F is given in blue (dotted – dashed), with 𝜏H = 𝜏z = 16𝑇F in magenta (dashed) and with varying time delays in black. For each one of the three
gates, the green curve is always above the other ones, which indicates that the needed reservoirs’ capacity is lower when using the regulation scheme. Moreover, the reservoirs are filled later in that case and the water remains less time in the reservoirs, thus the agricultural zone are better preserved. The water level curve in the case of computed time
delays is between the curves obtained for the time delays set to their variation interval bounds.
(a) 𝐺H Gate opening and water levels inside and outside 𝐹𝐶𝑅H. (b) Comparison of water levels inside 𝐹𝐶𝑅H.
(c) 𝐺z Gate opening and water levels inside and outside 𝐹𝐶𝑅z. (d) Comparison of water levels inside 𝐹𝐶𝑅z.
(e) 𝐺} Gate opening and water levels inside and outside 𝐹𝐶𝑅}. (f) Comparison of water levels inside 𝐹𝐶𝑅}.
Figure 9: Gate opening and water levels for a 1-peak simulation with 𝑄+,-= 675𝑚}𝑠~H and 𝑄5(= 600𝑚}𝑠~H. The
water levels inside (outside) the reservoirs are denoted bd (fd) respectively.
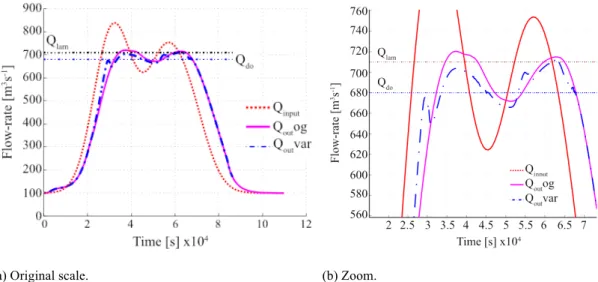
The second case studied is a flood episode with two peak flows, the first one is of 839𝒎𝟑𝒔~𝟏 occurring at 𝑘 = 324 i. e. around 9h after the beginning of the simulation,
the second is 754𝒎𝟑𝒔~𝟏 and occurs at 𝑘 = 570 i. e. around 16h after the beginning of
710𝒎𝟑𝒔~𝟏 and 𝑄
5( = 680𝒎𝟑𝒔~𝟏 ≈ 95%𝑄+,-. That case was proposed in order to
evaluate the ability of the method to attenuate a second flood episode. Moreover, 𝑄5( was set high enough to allow for a water draw-off from the reservoir after the first peak and before the second one and so that the ability to absorb the second flood exists. Because results obtained in the one peak flood episode shown that results were better in the computed time delay case, we compared for the two peaks flood episode only this case and the case when gates are always open. For this two peaks flood, the measured time delays varied between 11𝑇F and 16𝑇F, as illustrated in Figure 10.
Figure 10:𝜏Hand 𝜏z evolution for a 2-peaks simulation with 𝑄+,-= 710𝑚}𝑠~H and 𝑄5(= 680𝑚}𝑠~H.
(a) Original scale. (b) Zoom.
Figure 11: 𝑄678)* and 𝑄()* for a 2-peaks simulation with 𝑄+,-= 710𝑚}𝑠~H and 𝑄5(= 680𝑚}𝑠~H.
In Figure 11, the 𝑄678)* value is given in red (dotted), the always-open gates case in magenta. The proposed strategy applied with varying time delays is given in blue (dotted – dashed). When the gates are always open, the peak flood is reduced however; the discharge exceeds the 𝑄+,- value. When time delays are computed, the 𝑄()* curve is between the 𝑄()*curves obtained for the time delays set to their variation interval bounds. Without the use of flood control reservoirs the peak flow reaches 823𝑚}𝑠~H for the first
reaches 704𝑚}𝑠~Hfor the first wave and 713𝑚}𝑠~H for the second one. Applying the
strategy allows the discharge to remain under the 𝑄+,- value for the first wave and very
close to it for the second wave.
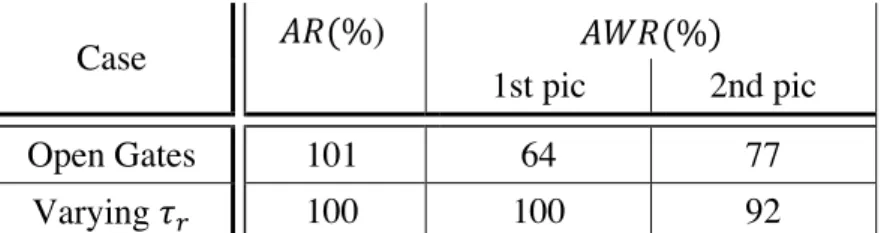
The values of the performance criteria computed for each case are given in Table 2. As in the first test, the ability to absorb the both flood waves is increased when using the proposed method. Indeed, for the first wave, 𝐴𝑊𝑅 = 100% when gates are regulated whereas 𝐴𝑊𝑅 = 64% when gates are not regulated. For the second wave 𝐴𝑊𝑅 = 92% when the strategy is used whereas 𝐴𝑊𝑅 = 77% when the gates remain open. Before the arrival of the second flood, we take advantage of the decrease of the water level in the river to release a certain amount of water from the reservoirs in the river. This enables us to better accommodate the second wave of flooding.
Case 𝐴𝑅(%) 𝐴𝑊𝑅(%)
1st pic 2nd pic
Open Gates 101 64 77
Varying 𝜏& 100 100 92
Table 2: AR, and AWR values for the 2 peaks scenario in the two different cases.
CONCLUSION
In this paper, a crisis management method included in a supervisory control scheme has been proposed.
• It consists in three blocks connected to a river process using reservoirs allowing the management of the flood situation.
• It allows calculating the water volumes to be stored or released through the use of a network flow.
• The variation of the time delays does not impact the network structure.
• Simulation results, for the case of a river with three reservoirs, have showed the effectiveness of the proposed method.
• The proposed simulated case has permitted to attest the feasibility of including varying time delays in the network.
• Future research will study the case of an extended catchment, thus the proposed scheme will consider a river network with longer delays, bifurcations and confluences.
ACKNOWLEDGMENTS
The authors want to thank Confederación Hidrográfica del Ebro for providing the case study used in this paper as well as for sharing their hydrological management expertise and Fluid Mechanics, LIFTEC-EINA, University of Zaragoza for providing the 1D-2D coupled simulator.
REFERENCES
Alfieri, L., Burek, P., Dutra, E., Krzeminski, B., Muraro, D., Thielen, J. and Pappenberger, F., 2013. GloFAS - global ensemble streamflow forecasting and flood early warning, Hydrol. Earth Syst. Sci., 17, 1161–1175.
Baldea, M. and Harjunkoski, I., 2014. Integrated production scheduling and process control: A systematic review, Computers & Chemical Engineering, 71 (4), 377–390.
Bedient, P. B., Huber, W. C. and Vieux, B. E., 2013. Hydrology and floodplain analysis, 5th Edition. Prentice Hall, Upper Saddle River, New Jersey, USA.
Chuntian, C., and Chau, K., 2002. Three-person multi-objective conflict decision in reservoir flood control. European Journal of Operational Research, 142 (3), 625–631. Duviella, E., Rajaoarisoa, L., Blesa, J. and Chuquet, K., June 2013. Adaptive and
predictive control architecture of inland navigation networks in a global change context: application to the Cuinchy-Fontinettes reach. In: 7th IFAC Conference on Manufacturing Modelling, Management, and Control. Saint Petersburg, Russia, pp. 2201–2206.
Figueiredo, J., Ayala Botto, M. and Rijo, M., 2013. SCADA system with predictive controller applied to irrigation canals. Control Engineering Practice 21 (6), 870–886. Fu, G., 2008. A fuzzy optimization method for multicriteria decision making: An
application to reservoir flood control operation. Expert Systems with Applications,
34, 145–149.
Hooijer, A., Klijn, F., Pedroli, G. B. M. and Van Os, A. G., 2004. Towards sustainable flood risk management in the Rhine and Meuse river basins: synopsis of the findings of IRMA-SPONGE, River Research and Applications, 20 (3), 343–357.
Isermann, R., 1997. Supervision, fault-detection and fault-diagnosis methods — An introduction. Control Engineering Practice, 5 (5), 639–652.
Karamouz, M., Szidarovszky, F. and Zahraie, B., 2003. Water Resources Systems Analysis. Lewis Publishers, New York, USA.
Karbowski, A., Malinowski, K., and Niewiadomska-Szynkiewicz, E., 2005. A hybrid analytic/rule-based approach to reservoir system management during flood. Decision Support Systems, 38 (4), 599–610.
Liechti, K., Panziera, L., Germann, U. and Zappa, M., 2013. The potential of radar-based ensemble forecasts for flash-flood early warning in the southern swiss alps. Hydrology and Earth System Sciences, 17 (10), 3853–3869.
Loucks, D., van Beek, E., Stedinger, J., Dijkman, J., and Villars, M. (2005). Water Resources Systems Planning and Management An Introduction to Methods, Models and Applications. United Nations Educational, Scientific and Cultural Organization, UNESCO 2005 Edition.
Merz, B., Hall, J., Disse, M. and Schumann, A. 2010. Fluvial flood risk management in a changing world, Natural Hazards and Earth System Sciences, 10, 509-527.
Mora, D., Taisch, M., Colombo, A. W., Mendes and J. M., Jul. 2012. Service-Oriented Architecture approach for Industrial ”System of Systems”: State-of-the-Art for Energy Management. In: 2012 10th IEEE International Conference on Industrial Informatics. Beijing, China, pp. 1246–1246.
Morales-Hernandez, M., Garcia-Navarro, P., Burguete, J. and Brufau, P., 2013. A conservative strategy to couple 1D and 2D models for shallow water flow simulation, Computers & Fluids, 81, 26–44.
Needham, J. T., Watkins Jr., D. W., Lund, J. R., and Nanda, S. K., 2000. Linear Programming for Flood Control In The Iowa And Des Moines Rivers. Journal of Water Resources Planning and Management, 126 (3), 118–127.
Nouasse, H., Chiron, P. and Archimède, B., 2013. A flood lamination strategy based on transportation network with time delay. Water Science & Technology, 68 (8), 1668– 1696.
Nouasse, H., Chiron, P. and Archimède, B., Sept. 2013. A water storage and release strategy for flood management based on transportation network with time delay. In: 2013 IEEE 18th Conference on Emerging Technologies Factory Automation. Cagliari, Italy, pp.1–8.
Nouasse, H., Chiron and P., Archimède, B., Oct. 2013. Transportation network model with time delay for flood lamination strategy. In : 2013 XXIV International Conference on Information, Communication and Automation Technologies. Sarajevo, Bosnia and Herzegovina, pp. 1–8.
Pengel, B., Shirshov, G.S., Krzhizhanovskaya, V.V., Melnikova, N.B., Koelewijn, A.R., Pyayt, A.L. and Mokhov, I.I., 2013. Flood Early Warning System: Sensors and Internet. IAHS Red Book N 357, Floods: From Risk to Opportunity. A. Chavoshian and K. Takeuchi (Eds), IAHS Press (International Association of Hydrological Sciences), Oxfordshire, UK, pp. 445-453.
Pfitscher, L.L., Bernardon, D.P., Kopp, L. M., Heckler, M. V T, Behrens, J., Montani, P.B. and Thome, B., 2012. Automatic control of irrigation systems aiming at high energy efficiency in rice crops. In: 2012 8th International Caribbean Conference on Devices, Circuits and Systems. Playa del Carmen, Mexico, pp. 1–4.
Plate, Erich J. (2002). Flood risk and flood management. Journal of Hydrology, 267 (1-2), 2–11.
Romera, J., Ocampo-Martinez, C., Puig, V. and Quevedo, J., 2013. Flooding management using hybrid model predictive control: application to the Spanish Ebro River. Journal of Hydroinformatics 15 (2), 366–380.
Thieken A. H., Kreibich H., Müller M., and Merz B., 2007. Coping with floods: Preparedness, response and recovery of flood-affected residents in Germany in 2002. Hydrological Sciences Journal, 52 (5), 1016–1037.
Wagenknecht, A. and Rueppel U., 2013. Process Driven Emergency Management Platform for Flood Response Integrating web GIS Technologies, International Journal of Civil & Environmental Engineering, 13 (4), 1–8.
APPENDIX
Symbol
𝑄()* The output river discharge 𝑄+,- The attenuation threshold
𝑛" The number of flood control reservoirs and gates.
𝐹𝐶𝑅& The 𝑟th flood control reservoir
𝐺& The gate controlling the 𝑟th flood control reservoir
𝜏& The time delay from the gate 𝐺& to the following gate 𝐺&CH
𝑄5( The release threshold 𝑇F The control period
𝐻W The time horizon
𝑛 The number of control period in the time horizon
𝑄"M The discharge measured at the 𝑟th gate
𝑆 The wetted cross section
𝑑"M,"MPQ The distance between the 𝑟th gate and the (𝑟 + 1)th gate
𝐴𝑅(%) The Attenuation Rate 𝐴𝑊𝑅(%) The Attenuation Wave Rate
𝑄-X, The mean effective attenuation flow
𝑄()*(𝑘) The output river discharge measured at the date 𝑘𝑇F
𝑄Fo(𝑘) The output river discharge measured at the date 𝑘𝑇F when the gates are
closed
𝑄-,† The maximum value of the output river discharge during the time horizon