Université de Montréal
Mémoire intitulé :
New insights on ammonia metabolism in endothelial cells
of the blood brain barrier
par Mariana Macedo de Oliveira
Programme des Sciences biomédicales Faculté de Médecine
Mémoire présenté en vue de l’obtention du grade de Maitrise en sciences biomédicales, Médecine expérimentale
Évalué par le jury suivant: Dr. Pierre Haddad, Président rapporteur Dr. Christopher Rose, Directeur de recherche
Dr. Jean-François Cailhier, membre du jury
Décembre, 2016
Résumé
L'encéphalopathie hépatique (HE) est un syndrome neuropsychiatrique complexe, une complication majeure de la maladie du foie. L'œdème cytotoxique est une complication grave de l'encéphalopathie hépatique, connu comme étant le résultat d'un gonflement des astrocytes. Les facteurs pathogéniques dérivés du sang tels que l'ammoniaque (NH4+) et le stress oxydatif (SO) sont connus pour être synergiquement impliqués. Les cellules endothéliales (CE) de la barrière hémato-encéphalique (BHE), régulant le passage vers le cerveau, sont les premières cellules à entrer en contact avec les molécules circulantes. L'effet de l'ammoniaque et du SO sur le transport et le métabolisme des CE n'a jamais été complètement exploré. Par conséquent, notre objectif était d'évaluer les effets de NH4+ et des espèces réactives de l'oxygène (ROS) sur les CE de la BHE en utilisant des systèmes de modèles in vivo et in vitro. Il a été démontré que le cotransporteur Na-K-2Cl (NKCC1) était impliqué dans la pathogenèse de l'œdème cérébral dans de nombreuses affections neurologiques. Le NKCC1 peut transporter NH4+ vers le cerveau et est régulé par les ROS. Par conséquent, l'expression de NKCC1 a été évaluée dans des CE primaires soumises à différentes concentrations de ROS et de NH4+ ainsi que dans des microvaisseaux cérébraux (MVC) isolés chez le rat BDL (bile-duct ligated), un modèle d'EH induit par une maladie hépatique chronique. Aucune régulation à la hausse de NKCC n'était présente chez les CE traitées ou les MVC. La glutamine synthétase (GS) est une enzyme qui joue un rôle compensatoire important dans la détoxification du NH4+ au cours de la maladie du foie. La GS est exprimée dans le muscle et le cerveau (astrocytes), mais n'a jamais été totalement explorée dans les CE de la BHE. L'expression et l'activité de la protéine GS ont été trouvées dans les CE de la BHE in vitro (CE primaires) et in vivo (MVC isolés de rats naïfs). Dans le modèle BDL, l'expression de GS dans les MVC n'était pas significativement différente des témoins (SHAM). Par ailleurs, nous avons traité des CE avec du milieu conditionné à partir de plasma de rats BDL et avons trouvé une diminution de l’expression de la protéine GS et de l'activité par rapport aux SHAM. De plus, les CE traitées avec NH4+ augmentaient en activité de GS tandis que les traitements avec SO avec et sans NH4+ diminuent l'activité de GS. Globalement, ces résultats démontrent pour la première fois que la GS est présente dans les CE, à la fois in vivo et in vitro. La GS est régulée à la baisse dans les CE traitées avec du plasma de BDL (mais pas dans les MVC de BDL). Il est intéressant de noter que le NH4+ stimule l'activité de GS dans les CE, alors que le SO inhibe l'activité de GS, ce qui justifie possiblement les résultats de nos études avec les milieux conditionnés. Nous supposons que le SO empêche la régulation à la hausse de GS de la BHE, en diminuant la capacité des CE à détoxifier l'ammoniaque et à limiter l'entrée d'ammoniaque dans le cerveau. Nous envisageons qu'une régulation à la hausse de GS dans les CE de la BHE pourrait devenir une nouvelle cible thérapeutique de l'EH.
Mots-clés : Encéphalopathie hépatique, hyperammoniémie, cellules endothéliales, œdème cérébral, glutamine synthétase, NKCC1
Abstract
Hepatic encephalopathy (HE) is a complex neuropsychiatric syndrome, which is a major complication of liver disease. Cytotoxic edema is a serious complication of HE, known to be the result of astrocyte swelling. Blood derived pathogenic factors such as ammonia (NH4+) and oxidative stress’ (OS) are known to be synergistically implicated. Endothelial cells (EC) of the blood brain barrier (BBB) are the first cells regulating passage into the brain and to contact blood-derived molecules. The effect of ammonia and oxidative stress on EC transport and metabolism has never been thoroughly explored. Therefore, our aim was to evaluate the effects of NH4+ and reactive oxygen species (ROS) on EC of the BBB using in vivo and in vitro models systems. The Na–K–2Cl cotransporter (NKCC1) has been demonstrated to be involved in the pathogenesis of brain edema in numerous neurological conditions. NKCC1 can transport NH4+ into the brain and is regulated by ROS. Therefore, the expression of NKCC1 was evaluated in primary EC submitted to different concentrations of ROS and NH4+ as well as in cerebral microvessels (CMV) isolated from the bile-duct ligated (BDL) rat, a model HE induced by chronic liver disease. No upregulation of NKCC1 was present in either the treated EC or CMV. Glutamine synthetase (GS) is an enzyme with an important compensatory role in NH4+ detoxification during liver disease. GS is expressed in muscle and brain (astrocytes) but has never been thoroughly explored in ECs of the BBB. GS protein expression and activity was found in EC of the BBB in vitro (primary EC) and in vivo (CMV isolated from naive rats). In the BDL model, GS expression in CMVs was not significantly different from SHAM-operated controls. In addition, we treated ECs with conditioned medium from plasma of BDL rats and found a decrease in GS protein and activity when compared to SHAM. Furthermore, EC treated with NH4+ increased GS activity while treatments with ROS with and without NH4+ decreased GS activity. Overall these results demonstrate for the first time that GS is present in EC both in
vivo and in vitro. GS is downregulated in EC treated with BDL plasma (but not in BDL CMV).
Interestingly, NH4+ stimulates GS activity in ECs, while ROS inhibits GS activity, possibly justifying the results found from the conditioned medium studies. We speculate that ROS prevents the upregulation of GS in the BBB, decreasing the capacity of the EC to detoxify ammonia and to limit ammonia entry into the brain. We foresee that upregulating GS in ECs of the BBB could become a new therapeutic target for HE.
Keywords: Hepatic encephalopathy, hyperammonemia, endothelial cells, brain edema, glutamine synthetase, NKCC1
List of contents
Résumé ... i
Abstract ... ii
List of contents ... iii
List of tables ... vii
List of figures ... viii
List of abbreviations ... ix
Aknoledgments ... Erreur ! Signet non défini. Introduction ... 11
Hepatic encephalopathy ... 11
Liver ... 11
Vascularity ... 11
Function ... 12
Central Nervous System ... 15
Vasculature ... 17 Cell types ... 18 Liver disease ... 19 Types of HE ... 20 Pathogenesis of HE ... 22 Ammonia ... 22 Oxidative stress ... 24 Treatments of HE ... 26 Ammonia metabolism ... 28 Glutamine synthetase ... 28 Glutaminase ... 31
Pericytes ... 34
Junctional Complexes ... 35
Brain edema ... 36
Pathogenesis of brain edema in HE ... 38
Na-K–Cl cotransporter ... 39
Presentation ... 39
Functions ... 40
Regulation ... 41
Animal models of HE ... 43
The bile duct ligated rat ... 44
Aim of the project ... 45
Material and Methods ... 46
Materials ... 46
In vivo ... 46
The bile duct ligated rat (BDL) ... 46
Samples preparation ... 48
Isolation of cerebral microvessels ... 48
In vitro ... 49
Cell culture ... 49
Treatments ... 49
Preparation of cells and tissue lysates ... 49
RNA extraction ... 50
Viability assessment ... 50
Alamar blue assay ... 50
Evaluation of mRNA expression ... 51
rtPCR ... 51
Evaluation of protein expression for GS and NKCC1/NKCC1-P ... 52
Western blot ... 52
Statistics ... 55
Results ... 56
1. Viability of endothelial cells of the blood-brain barrier in presence of ammonia and oxidative stress ... 56
Alamar Blue Assay ... 56
2. NKCC1 expression in the endothelial cells of the blood-brain barrier ... 59
NKCC1/NKCC1-P is not upregulated in RBMEC submitted to oxidative stress and/or hyperammonemia. ... 59
NKCC1/NKCC1-P is not upregulated in endothelial cells of BDL animals ... 60
3. GS is present on endothelial cells of the BBB ... 62
GS mRNA in RBMEC ... 62
GS protein expression in brain endothelial cells ... 62
GS activity in brain endothelial cells ... 62
GS immunofluorescence in brain endothelial cells ... 63
4. GS in endothelial cells during hyperammonemia, ROS and liver disease ... 66
GS in chronic liver disease ... 66
GS in RBMEC following treatment with BDL vs SHAM conditioned media ... 67
GS in RBMEC subjected to ammonia and oxidative stress ... 69
Discussion ... 71
NKCC1 ... 71
HE effects in cortex and cerebellum ... 71
Bumetanide and brain edema ... 72
Role of NKCC1 in edema ... 72
BDL, brain edema and the synergistic effect between ammonia and ROS ... 73
NKCC1 is not regulated in ECs submitted to ammonia and ROS ... 73
NKCC1 is not upregulated in CMV of BDL rats when compared to SHAM operated controls ... 75
Extra hepatic GS and importance in hyperammonemia ... 78
GS is found in the BBB’s EC and CMV... 78
GS mRNA expression ... 78
Protein expression of GS ... 78
GS activity ... 79
Immunofluorescence ... 79
Importance of GS in different cell types ... 80
Ammonia-lowering strategies ... 81
GS regulation ... 84
Tyrosine nitration ... 84
Lysine acetylation ... 84
Other factors ... 84
GS regulation by liver disease and ammonia/ROS ... 85
GS is not altered in CMV in BDL vs SHAM ... 85
GS is downregulated in RBMEC exposed to conditioned medium from plasma of BDL and SHAM rats ... 85
GS is regulated in RBMEC treated with ammonia and ROS ... 87
Future studies ... 88
NKCC1 and edema ... 88
GS and ammonia metabolism in EC ... 88
Conclusion ... 90
List of tables
Table 1: Classification of HE ... 22 Table 2: HE treatments ... 27 Table 3: Animal models of HE. ... 44
List of figures
Figure 1: The liver anatomy ... 12
Figure 2: The urea cycle ... 14
Figure 3: Early central nervous system ... 15
Figure 4: Brain’s anatomy ... 16
Figure 5: Brain’s arterial vasculature ... 18
Figure 6: Glutamine synthetase structure ... 29
Figure 7: Glutamine synthetase reaction ... 30
Figure 8: The glutamine-glutamate cycle ... 31
Figure 9: The overall structure of protein glutaminase ... 32
Figure 10: The blood-brain barrier ... 33
Figure 11: Junctional complexes of the BBB ... 35
Figure 12: The mechanisms of brain edema ... 37
Figure 13: Schematics of NKCC1 ... 40
Figure 14: BDL surgery ... 47
Figure 15 : Cerebral microvessels ... 48
Figure 16: The Alamar blue test’s reaction ... 51
Figure 17 : Cell viability in RBMECS exposed to oxidative stress and ammonia ... 58
Figure 18: Protein expression of NKCC1/NKCC1-P in RBMEC exposed to ammonia and oxidative stress ... 60
Figure 19: NKCC1 and NKCC1-P/NKCC1 protein expression in CMV ... 61
Figure 20: GS is present in RBMEC ... 64
Figure 21: GS expression in CMV from naive rats ... 65
Figure 22: GS protein expression in CMV from BDL and SHAM animals ... 67
Figure 23: GS expression in RBMEC treated with conditioned medium ... 68
Figure 24: GS activity of RBMEC exposed to ammonia ... 69
Figure 25: GS activity of RBMEC exposed to oxidative stress with or without ammonia ... 70
List of abbreviations
ALF: Acute liver failureBBB: Blood-brain barrier BDL: Bile-duct ligation CLD: Chronic liver disease CHE: Covert HE
CNS: Central nervous system EC: Endothelial cells
GA: Glutaminase
GS: Glutamine synthetase HE: Hepatic encephalopathy OHE: Overt HE
OP: Ornithine phenylacetate PIC: Protease inhibitor cocktail
RBMEC: Rat brain microvascular endothelial cells TNF: Tumor necrosis factor
Acknowledgments
First, I would like to thank Dr. Christopher Rose for the opportunity of being part of his team, for his incentive, availability and inspiration.
Secondly, I would like thank Mélanie Tremblay for her precious advice and for teaching me numerous techniques that allowed me to complete my master’s degree, Cristina Bosoi for her hard work and competence that provided the foundation for this project and Marc-André Clément for always being there, either to help me with the project or to refresh my ideas over a cup of coffee.
Finally, I would like to thank Rafaela Almeida for her advice and all the members of the Hepato-Neuro lab for sharing their knowledge and making this two years enriching and enjoyable.
Introduction
Hepatic encephalopathy
Hepatic encephalopathy (HE) is a serious neuropsychiatric disorder that affects up to 80% of patients with liver disease (Bajaj, 2008). A major complication of either acute and chronic liver disease, HE develops when the ailing liver can no longer perform properly, including detoxification, leading to a build up of toxins in the blood which affect the brain. HE has a range of symptoms going from attention and learning deficits and motor incoordination to stupor, coma and death. HE has an impact on the patients’ survival, quality of life and neurological outcome following liver transplantation (Bajaj et al., 2011; Sotil et al., 2009; Stewart et al., 2007). Although HE patients present a major burden on health care systems (Neff, 2010a), there is still no optimal treatment available, and more research is needed to fully understand this syndrome and develop efficient treatments.
Liver
The liver is the second largest organ in the body, weighing approximately 2-3% of total body weight. The liver is morphologically divided in two main lobes (left and right) and two accessory lobes (quadrate and caudate) (Bismuth, 1982). The functional unit of the liver is the hepatocyte. Hepatocytes are epithelial cells grouped in interconnected plaques forming the hepatic lobules, with each lobule being served by branches of the hepatic artery, portal and hepatic veins and biliary ducts (figure 1).
Vascularity
The liver has a unique vascular setting in the body, since it receives both arterial and venous blood. The liver is fed by the common hepatic artery that separates into two branches (left and right arteries) that perfuse the respective lobes. The hepatic drainage arises via the intrahepatic vein that splits into three hepatic veins that drain into the inferior vena cava. The
nutrients and toxins from the gastro-intestinal tract (GIT), pancreas and spleen into the liver and is responsible for approximately 70-80% of all the blood entering the liver (Junqueira and Carneiro 2016). The biliary system typically follows the portal system and is composed by multiple intrahepatic ducts responsible for the formation and transport of the bile (Abdel-Misih and Bloomston, 2010).
A B
Figure 1: The liver anatomy
(A) gross liver anatomy, (B) hepatic lobule anatomy.
Function
The liver regulates several systemic processes in the body. It is responsible for adjusting metabolites in the blood, for processing and storing nutrients, for producing coagulation factors and plasmatic proteins, for detoxifying potentially harmful molecules and has a role in the digestion of lipids.
Bile production
The bile, secreted by the hepatocytes, is rich in water, bile acids, fats and bilirubin. It is responsible for fat emulsification which is central for lipid absorption in the small intestine. After production, the bile is stored, concentrated and enriched in bicarbonate by the gallbladder, to be further released into the duodenum for digestion during a meal. Different than that found in humans and other mammals such as mouse, cat and dogs, the rat does not possess a
gallbladder, but rats secrete large volumes and higher concentrations of bile in comparison to other animals (McMaster, 1922).
Detoxification
As a process of major importance, the neutralization of toxic substances by the liver is imperative for homeostasis. The most important toxin metabolized by the liver is ammonia, which is produced in the gut via nitrogen metabolism and urease bacteria.
Urea Cycle
The urea cycle is solely found in the liver and primarily responsible for ammonia detoxification through its generation of non-toxic urea which is then excreted by the kidney. A large portion of ammonia enters the liver via the portal vein and reaches the periportal hepatocytes where ureagenesis takes place (Figure 2).
The urea cycle involves carbamyl phosphate synthetase (CPS I), a periportal hepatocyte
mitochondrial enzyme, which mediates the formation of carbamyl phosphate from NH3, HCO3
-and ATP. Glutamate -and acetyl-CoA form N-acetyl-glutamate (NAG) by the action of the enzyme NAG synthetase. Carbamyl phosphate is then condensed with ornithine, forming citrulline by action of the ornithine transcarbamylase (OTC). Citrulline is then released into the cytosol, where it condenses with aspartate to form argininosuccinate via argininosuccinate synthetase (ASS). Argininosuccinate is then converted into fumarate and arginine by argininosuccinate lyase (ASL) in the cytosol. Fumarate is then oxidized in the tricarboxylic acid (TCA) cycle, and arginine is transformed into urea and ornithine by the enzyme hepatic arginase. Several factors of the cycle are regulated by protein intake (NAG, OTC) or by starvation (citrulline, arginase). (Yudkoff, 1999). The produced urea is then transported to the kidney where it is secreted.
Although high in capacity, the urea cycle has a low affinity for ammonia and therefore not all ammonia arising from the portal vein is detoxified promptly by periportal hepatocytes. As a result of that, the perivenous hepatocytes are equipped with the enzyme glutamine
Figure 2: The urea cycle
The urea cycle is formed by series of reactions which are responsible for detoxifying ammonia. In the urea cycle, two molecules of ammonia enter in order to form urea. The first one forms carbamylphosphate inside the mitochondrion, the second one is included in aspartate, which is then converted into argininosuccinate.
Urea cycle disorder
Inborn errors of urea metabolism, known as urea cycle disorders (UCD), are associated with full or partial deficiency in any of the enzymes of the urea cycle. The incidence of UCDs is from 1:8000 to 1:44000, but these numbers might be underestimated due to undiagnosed cases in partial deficiency or abrupt death in infants. Among the affected enzymes, OTC deficiency is the most common and arginase deficiency the least (Allen, 2013).
Aside arginase deficiency, hyperammonemia is the hallmark of the syndrome, and the symptoms differ according to whether it is acute or chronic (Gropman et al., 2007). Infants with severe deficiency develop an acute hyperammonemia with quick development of symptoms leading to hyperammonemic encephalopathy after birth, starting with poor feeding and lethargy that can progress to coma (Burton, 2000). Chronic hyperammonemia presentation includes
headaches, confusion, lethargy, protein avoidance, behavioural changes and learning deficits (Häberle, 2011).
Central Nervous System
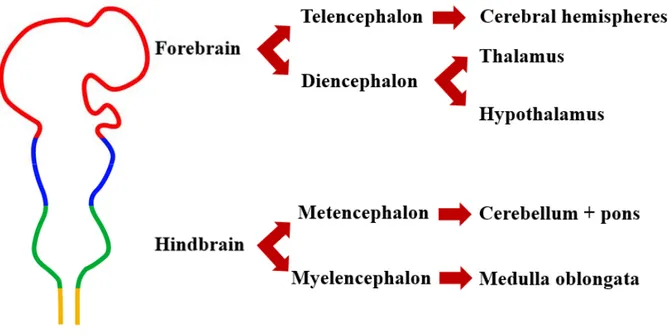
The central nervous system (CNS) is the most complex system in the body. It coordinates voluntary (speech, locomotion) and involuntary (breath, blink) movements, receives and responds to sensorial information and regulates several processes such as behaviour (day/night cycle) and growth. The CNS consists of the brain and spinal cord, and is responsible for centralized control upon the rest of the body. The brain is a complex structure and can be divided according to its embryological development into forebrain, midbrain and hindbrain (figure 3). The forebrain will form the cerebral hemispheres, thalamus and hypothalamus. The hindbrain will consist of the medulla, pons and cerebellum.
Figure 3: Early central nervous system
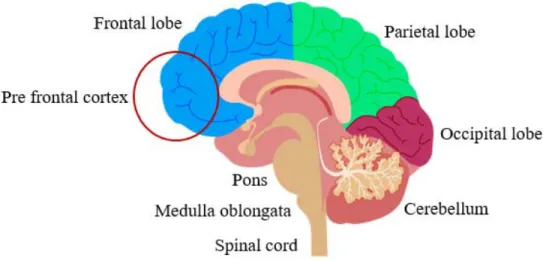
The telencephalon is the largest part of the brain, highly folded in humans, and presents numerous sulcus and gyri. It is divided into four lobes: frontal, parietal, temporal and occipital (figure 4). The frontal lobe controls several functions such as problem solving, behaviour, attention, movement coordination and personality. The frontal cortex can be further divided into pre-frontal cortex (PFC), which corresponds to the anterior part of the frontal lobe. The PFC receives highly processed information from other forebrain systems and is related with modulation of social behaviour, ability to retain concentration, expression of the personality, decision making and learning. The PFC is crucial for complex behaviour and impairments in this area have a significant impact on quality of life (Miller et al., 2002).
Positioned below the occipital lobe, the cerebellum is composed by external highly folded gray matter. It is generally divided into two lobes; the anterior and posterior lobes, plus a vermiform structure vertically oriented called the vermis. Although it might have a role in some cognitive activities, the main function of the cerebellum is to exert fine motor control allowing the body to move properly, influencing balance, posture, motor learning and coordination (Fine et al., 2002).
Figure 4: Brain’s anatomy
Brain’s structures showed in a sagittal plan. Temporal lobe is not visible due to the section plan. Image adapted from dreamstime image bank.
Vasculature
The brain is perfused by vertebral (2 branches) and carotid (4 branches) arteries which join an anastomotic structure called Circle of Willis. The Circle of Willis is at the base of the skull and the cerebral arteries (anterior, middle, posterior) come from it. The circulation of blood by anastomotic structures such as the Circle of Willis protects the effect of blockage of one cerebral artery and consequently compromise an entire lobe by allowing the circulation through collateral vessels. The cerebral arteries run close to the dura mater and then infiltrate into the meninges, becoming the penetrating arteries. These arteries are still in contact with a layer of the dura mater, and as they run deeper, they become arterioles and then capillaries (figure 5). The capillaries then make direct contact with the brain via astrocyte foot processes, becoming a part of the blood-brain barrier (BBB). Blood poor in oxygen is carried to the post-capillary veins converging into cerebral veins which merge into the sinuses (inferior, superior, straight, sigmoid, transverse, occipital), and finally join the jugular veins. Because the capillaries are the major site of molecule exchange, they present only a monolayer of endothelial cells and no muscular or collagen layers, making the presence of the BBB critical for the CNS protection.
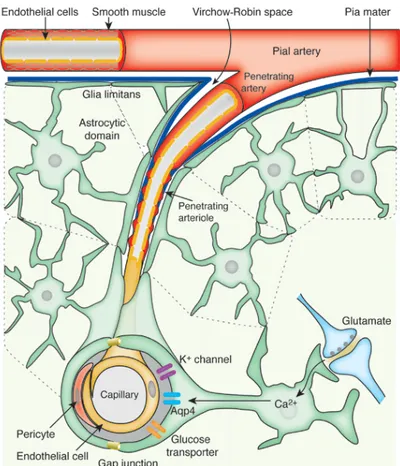
Figure 5: Brain’s arterial vasculature
The Virchow-Robin space represents the area between the penetrating artery and the surrounding pia mater. Image from (Iadecola and Nedergaard, 2007).
Cell types
The brain is formed by several types of cells; neurons and glia (astrocytes, oligodendrocytes and microglia). Neurons are responsible for reception, transmission and the processing of inhibitory and excitatory stimuli. Via numerous transporters/pumps and ion channels, these cells generate and propagate electrical signals and transform them into chemical signals via the release of neurotransmitters. Regulating the brain’s microenvironment and providing support to the neurons, the glial cells are far more numerous in the brain, accounting for up to 90% of the cells in the CNS. The glia family involves oligodendrocytes which produce the myelin sheath for the neurons in the CNS, the ependymal cells which produce the
and the astrocytes. Astrocytes are star-shaped cells responsible for support and communication between the neurons and blood capillaries and controls the ionic and molecular extracellular environment on the brain. The astrocytic foot processes transfer molecules and ions from the blood to the neurons. In addition, astrocytes synthesize molecules such as lactate which are transported and used as energy source by neurons (Pellerin et al., 1998). Finally, astrocytes play a role in protecting the brain by being part of the BBB, protecting the neurons and other central cells from potential blood-derived toxins.
Liver disease
Liver disease is a generic term which covers several types of hepatic insults. It presents a major burden for health systems with costs as great as 157 million dollars just related to in-hospital procedures (Canadian Liver Foundation 2013). Even with treatment being available, the Canadian Liver Foundation predicts an increase in death related to liver disease in the next years (Canadian Liver Foundation 2013).
Acute liver failure
Acute liver failure (ALF) encompasses a number of conditions which are marked by severe and rapid liver cell dysfunction and massive necrosis of hepatocytes, with the presence
of coagulopathy and HE, without any pre-existing liver disease (Lee, 2012). Patients with ALF
present at first non-specific symptoms such as malaise and nausea, which are followed by jaundice, quick onset of altered mental status and coma. ALF presents high morbidity and mortality rates, being often caused by viral hepatitis, autoimmune liver disease and drug-induced liver injury (Ostapowicz et al., 2002).
Chronic liver disease
Chronic liver disease (CLD) is responsible for over 80% of primary liver cancers, of which hepatocellular carcinoma (HCC) is the most frequent, and are a major public health problem worldwide. Just in Canada, 2748 deaths were attributed to CLD and liver cirrhosis (eleventh leading cause of death) in 2008. In addition CLD is the fifth leading cause of death in
Having a slow progression (from 5 to 50 years), CLD is the most common type of liver disease. The hepatic injury regularly culminates in fibrosis and then cirrhosis, which is marked by tissue scaring with replacement of liver parenchyma by fibrotic tissue and distortion of tissue architecture. The main causes of CLD are excessive alcohol consumption, viral hepatitis and
non alcoholic steatohepatitis (NASH) (Pellicoro et al., 2014), with NASH presently being the
leading cause of liver disease in Canada (Canadian Liver Foundation 2013). CLD can lead to
complications, regardless of the aetiology of the underlying disease. While compensated patients with liver disease have no indications of their condition, decompensated patients present symptoms due to cirrhosis. Due to stiffening of hepatic structures, CLD patients develop portal hypertension which consequently could cause variceal bleeding. In addition, many times these patients present with ascites (accumulation of fluid in the abdominal cavity), sarcopenia (loss of muscular mass), jaundice (development of yellow skin) and HE.
Types of HE
The American Association for the Study of Liver Disease (AASLD) and the European
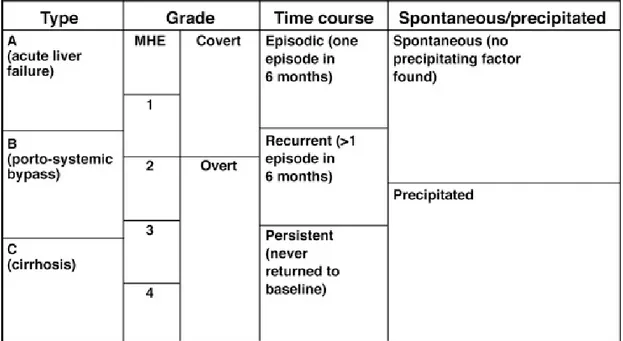
Association for the Study of the Liver (EASL) guidelines recommend that HE should be classified according with the type of underlying disease, severity of manifestations, time course, and precipitating factors (Vilstrup et al., 2014). Based on the type of liver disease from which it arises, HE can be classified as: type A, associated with acute liver disease (ALF); type B, associated with portal-systemic bypass without any existing liver disease and type C, associated with chronic liver disease (CLD).
Patients with type A are generally in critical state, presenting rapid progression of cerebral edema which, in up to 25% of the cases, evolves to life-threatening intracranial
hypertension and might culminate in brain stem herniation and death (Bernal et al., 2007). Type
B HE is associated with a congenital malformation rarely found in humans (Tivers et al., 2014),
but it might develop when a transjugular intrahepatic portosystemic shunt (TIPS) is done in
order to treat portal hypertension (Madoff et al., 2004). These conditions allow the blood from the gut to bypass the liver, resulting in an increase of toxins in circulation. Type B is also important as a surgical animal model of HE (Butterworth et al., 2009), presenting typical
(Bustamante et al., 1999). It can be subdivided according to its severity in covert (CHE) and overt HE (OHE).
CHE represent a mild form of HE, with no clinically obvious symptoms present. However, patients with CHE presents abnormal cognitive and neuropsychological skills, having a detrimental effect on ability of perform complex tasks such as driving and decreased life quality (Bajaj et al., 2011). Due to its subtle presentation, the assessment of CHE is challenging and requires the use of sensitive tools. Testing is done using psychometric tests such as PHES (Psychometric Hepatic Encephalopathy Score), referred as the “gold standard” for CHE assessment. PHES is a paper-pencil test in which patients are challenged for attention and processing speed, among other factors. Although highly sensitive and specific, paper-pencil tests are time-consuming. The EncephalApp Stroop is a free phone application that evaluates the patient’s psychomotor speed and cognitive flexibility. With high accuracy, the Stroop test is simple to perform and easily evaluated (Patidar and Bajaj, 2015). In addition to psychometric testing, other tests, including the Critical Flicker Frequency (CFF) might help in CHE diagnosis as it is simple, quick and language independent (Torlot et al., 2013).
OHE is the clinically obvious form of HE. It is usually associated with the presence of a precipitant factor such as constipation, infections and GIT bleeding (Devrajani et al., 2009). It is also possible that no precipitant factors are found associated with an episode, characterizing a spontaneous case. OHE is classified according to the West-Haven criteria (Table 1). Currently, minimal HE (Psychometric or neuropsychological alterations without clinical evidence of mental change) and grade I (superficial lack of awareness, euphoria or anxiety, shortened attention span, altered sleep rhythm) are incorporated in CHE. OHE then comprises grades II (presence of lethargy or apathy, time disorientation, obvious personality change, inappropriate behaviour, motor incoordination and asterixis), III (somnolence to stupor, confusion, gross disorientation, bizarre behaviour but still responsive to stimuli) and IV (coma) (Vilstrup et al., 2014). In addition, the presence of OHE can be occasional (episodic HE), having more than one episode within 6 months (recurrent) or continuous (persistent HE).
Table 1: Classification of HE
Grades 0 (Minimal HE) and 1 from the West-Haven criteria, which have no obvious clinical signs of the syndrome, are now known as covert HE. The grades 2 to 4 are known as overt HE. Table from (Patidar and Bajaj, 2015)
Pathogenesis of HE
HE is known to be a multifactorial complex syndrome with the underlying mechanisms still not fully understood. Nonetheless, the hyperammonemia, oxidative stress, inflammation and infection are known to play important roles.
Ammonia
Although the pathogenesis of HE is believed to be multifactorial, ammonia toxicity is considered to be central in the development of this syndrome. In liver disease, the loss of hepatic tissue and consequently hepatic function, is responsible for impaired ammonia detoxification, leading to an increase in this toxin. In addition, alteration of the gut microbiota during liver
disease, favors the dominance of ammonia-producing bacteria. (Bajaj et al., 2012; Chen et al.,
Presentation
Ammonia exists as two forms, a weak acid (NH4+) and a weak base (NH3) with the ratio
of NH3/ NH4+ being given by the Henderson-Hasselbalch equation:
NH3/ NH4+ = 10- (pKa-pH)
Since ammonia has a pKa ~9.1, at pH 7,4 and at 37˚C, only 2% of the ammonia is
presented as NH3, while approximately 98% is presenting as NH4+ (Lockwood et al., 1980).
Because NH3 is a gas, it can freely cross biological membranes via diffusion. The ionic form,
NH4+can also cross biological membranes, but via specific transporters. Since NH4+has similar
ionic properties as potassium (similar radius and diffusion coefficient) it can be transported by potassium carriers, such as the sodium-potassium-chloride co-transporter (NKCC), ATPase transporters Na+/K+ and H+/K+ among others (Bosoi and Rose, 2009). In addition, ammonia can cross membranes through ammonia transporters: the Rhesus associated glycoprotein (RhCG and RhBG), found in several cell types, including brain capillaries (Huang and Liu, 2001; Nakhoul and Hamm, 2013).
Toxicity
The effect of ammonia on brain function is well documented. Once inside the brain, increased ammonia causes changes in pH, alterations in membrane potential by competing with K+, and changes in cell metabolism, since ammonia is a common substrate and product for many reactions (Bosoi and Rose, 2009).
Astrocytes exposed to ammonia leads to cell swelling with ammonia-induced oxidative and nitrosative stress playing a role (Jayakumar et al., 2008). Ammonia also reduces mitochondrial function by several mechanisms. It affects the TCA cycle via the inhibition of α-ketoglutarate dehydrogenase and pyruvate dehydrogenase (Katunuma et al., 1966; Rama Rao and Norenberg, 2012) and the electron transport chain (Rao et al., 1997), resulting in impaired energy metabolism. In addition, ammonia influences the glutamate receptor
N-methyl-D-may represent the main mechanism for glutamate’s toxicity in hyperammonemia (Görg et al., 2010a).
Furthermore, hyperammonemia has been demonstrated to be implicated in circadian rhythm impairments, as proven by the work of Ahabrach and colleagues in which Wistar rats were submitted chronically to an ammonium rich diet. Ammonia fed rats showed alterations in the rhythm of spontaneous ambulatory activity and hormonal secretion of cortisol and cortisone, which suggests that it is implicated in patients with CLD (Ahabrach et al., 2010). In another study, rats submitted to the same ammonia diet showed impaired brain activity, which was expressed by failure in different learning tasks (Arias et al., 2014).
Hyperammonemia is an important part of the pathogenesis of CLD, reaching levels around 150-250 µM, and its levels correlate with HE severity in patients (Ong et al., 2003; Qureshi et al., 2014). Ammonia-lowering therapies are shown to decrease brain edema in animal models of HE (Bosoi et al., 2011). Since hyperammonemia is present in most HE patients, ammonia lowering strategies are shown to improve cognitive functions, health related quality of life (Prasad et al., 2007) and prevent new episodes of overt HE (Sharma et al., 2009).
In ALF, ammonia concentrations rise quickly and are higher than in CLD, generally resulting in brain edema and intracranial hypertension. An ALF model consisting of pigs submitted to hepatectomy showed ammonia levels that were up to 1,2 mM and correlated with raised intracranial pressure (Zwirner et al., 2010). Death from brain edema and intracranial hypertension is also well recognized in human ALF, in which high ammonia levels (above 200 µg/dL) allied with HE are associated with rapid onset of brain herniation (Vaquero et al., 2003).
Oxidative stress
Oxidative stress is known to be involved in several neuropsychiatric syndromes. In HE, several factors might be responsible for oxidative stress generation, including the ailing liver, high levels of ammonia or the presence of other factors such as inflammation.
Presentation
oxidants and pro-oxidants respectively. ROS are highly reactive molecules containing oxygen such as nitric oxide (NO), hydrogen peroxide (H2O2) and the anions superoxide (O2-) and hydroxyl (OH-). ROS are highly generated from the mitochondrial electron transport chain and
as by-products of cellular enzymes such as NADPH oxidases, xanthine oxidase and nitric oxide synthase (Norenberg et al., 2004).
ROS in health
ROS are responsible for cell signaling and regulation of several functions, being
involved in cell oxygen sensing, which is critical during limited oxygen availability (Guzy and
Schumacker, 2006), effective immune response by activated phagocytes and skeletal muscle
glucose uptake (Alfadda and Sallam, 2012), apoptosis and cell differentiation, among others.
ROS are normally produced in the human body as a consequence of aerobic respiration and substrate oxidation, but elevated levels can cause deleterious effects. Therefore, the presence of antioxidants enzymes such as superoxide dismutase, glutathione peroxidase, and catalase are essential for the balance between pro and antioxidants (Matés et al., 1999).
ROS in HE
The influence of ROS on the pathogenesis of HE is well established, but the role of systemic and central ROS is a subject of debate. Görg and colleagues found increased oxidative stress in post-mortem brains of liver-diseased patients to be correlated with the presence of HE (Görg et al., 2010b), stressing the relationship of central ROS and HE. In this study, patients’ brains presented increased levels of tyrosine-nitrated proteins, heat shock protein-27 and 8-hydroxyguanosine (RNA oxidation marker). On the other hand, different studies have showed that systemic levels of ROS are related to the presence of HE. Negru and colleagues found systemically increased levels of free radicals in HE due to alcoholic liver disease (Negru et al., 1999). Agreeing with that, blood levels of the antioxidant glutathione peroxidase and other antioxidant/oxidative markers were correlated with the presence of minimal HE in cirrhotic patients (Irimia et al., 2013; Montoliu et al., 2011; Sangeetha et al., 2016).
Treatments of HE
HE treatments focus on treating precipitating factors (e.g. GIT bleeding, infection and constipation among others) and lowering blood ammonia levels (table 2). Since CHE is highly underdiagnosed, currently only patients that present OHE episodes are treated. Various treatments are available to treat HE, such as non-absorbable disaccharide (lactulose) and antibiotics such as rifaximin. Lactulose, a laxative that decreases ammonia production by accelerating bowel movement, is the first-line treatment for HE. Besides its laxative function, it is assumed that lactulose acts on the growth of beneficial intestinal flora and decrease of intestinal pH (Jiang et al., 2015; Riggio et al., 1990). Patience compliance with lactulose treatment might present a challenge due to adverse effects (diarrhea, flatulence and abdominal pain) and the complicated dosage regimen which requires that the oral lactulose solution must be titrated in order to maintain two soft stools per day (Neff, 2010b). Rifaximin is a non-absorbable antibiotic which due to lower incidence of gastrointestinal effects, presents better patient compliance, which translates in less HE episodes and hospitalizations costs (Neff, 2010b). Even so, its high cost represents a drawback and obstacle from becoming the first line treatment for HE.
Table 2: HE treatments
Metabolic ammonia scavengers such as glycerol phenylbutyrate (GPB), ornithine L-aspartate (LOLA) and ornithine phenylacetate (OP) (table 2) have the potential of increasing ammonia’s removal by alternative pathways, such as glutamine synthesis by the enzyme glutamine synthetase. Other ammonia scavengers such as sodium benzoate and sodium phenylacetate are generally used for urea cycle disorders, but can also be used for HE management when irresponsive to other treatments (Ah Mew et al., 1993; Misel et al., 2013). Finally, branched-chain amino acids (BCAA)-enriched formulations and probiotics might be used since they showed improvement of features of HE (Vilstrup et al., 2014). Most HE therapies have not been thoroughly tested. In addition to that, the fact that there is no ideal treatment for HE so far, depicts the importance of finding new therapeutic strategies.
Ammonia metabolism
Glutamine synthetase
In liver disease, the loss of hepatic detoxifying function causes hyperammonemia. The neurological complications caused by hyperammonemia are primarily associated with ammonia entering the brain. In the setting of liver disease, enzymes of nitrogen metabolism such as glutamine synthetase (GS), have an important role.
GS is a glutamate-ammonia ligase present in animals, plants and bacteria. With a
molecular weight of 44 kDa, GS is the product of GLUL gene (Wang et al., 1996) which is
highly conserved within living organisms (Spodenkiewicz et al., 2016). In humans, GLUL is
found in chromosome 1 at 1q31 position (Helou et al., 1997), and its transcript has 1122 bp and
comprises 6 exons encoding a 373 amino-acid polypeptide (human liver) (Häberle et al., 2005).
In addition, three GLUL-like genes were described and a 54 kDa GS-like protein was isolated from human brain, although their function is not clear (Boksha et al., 2002; Wang et al., 1996).
The enzyme is found in the cytoplasm of most mammalian cells, including brain (Matthews et
al., 2010).
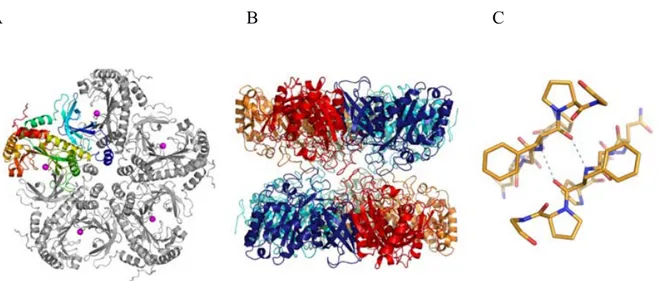
The 373 amino acid protein has three domains (figure 6): a N-terminal (residues 3-24),
a β-grasp domain (25-112) and a catalytic domain (residues 113-373) (Krajewski et al., 2008).
Four to six monomers together form a ring in a way that the catalytic domain of each subunit aligns with the β-grasp domain of the next (Boksha et al., 2002). Two rings are stacked oppositely-oriented and the functional GS becomes a octameric (human), decameric (canine) or
dodecameric (bacteria) structure (Boksha et al., 2002; Krajewski et al., 2008). The number of
monomers that form the ring depends on the type (GS type I is present in prokaryotes and GS type II in eukaryotes) and on the different isoforms of the enzyme inside each type. The ring orientation favors the position of the active sites toward substrates, with the bonds between the two stacked rings being weaker than the ones holding the monomers together.
A B C
Figure 6: Glutamine synthetase structure
Representation of GS structure from canine cells. (A) the subunit is colored from blue (N-terminus) to red. The blue-cyan corresponds to the β-grasp domain, and the rest represents the C-terminal catalytic domain. The magenta spheres correspond to magnesium ions. (B) The active sites in the second pentamer are placed between the ones in the first and are opposed. (C) the hydrogen bonding interaction between the two pentamer rings is represented. (Krajewski et al. 2008).
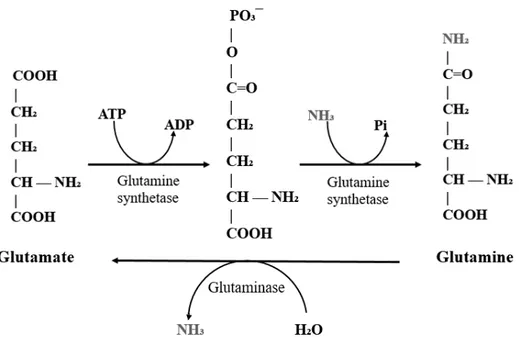
GS plays a key role in two major functions: detoxifying nitrogen metabolic waste and regulating brain neurotransmission. The detoxification of systemic ammonia occurs by a two-step reaction depending of ATP and Mg2+ or Mn2+ (figure 7). Besides that, GS can catalyze the
conversion of glutamate + hydroxylamine into γ-glutamyl hydroxamate, which is the basis for the assays measuring GS activity. GS is responsible for half of the hepatic and likely most of
the extra-hepatic detoxifying capacity in hyperammonemic conditions (Hakvoort et al., 2016),
representing a high affinity (but low capacity) ammonia detoxifying mechanism. Aside from perivenous hepatocytes in the liver, GS has been found to be expressed in kidney, heart, skeletal
muscle and in CNS (specially in astrocytes) (Anlauf and Derouiche, 2013; Iqbal and Ottaway,
Figure 7: Glutamine synthetase reaction
GS catalyzes the two step amidation of glutamate into glutamine. First, glutamate is phosphorylated and forms γ-glutamyl phosphate, which then reacts with an ammonia molecule resulting in a glutamine. The inverse reaction is catalyzed by the enzyme glutaminase, which turns glutamine into glutamate and releases ammonia.
GS is present in astrocytes (Anlauf and Derouiche, 2013) and is responsible for regulation of neurotransmitter production and recycling (glutamine-glutamate cycle). After glutamate is released on the post-synaptic cleft, it is taken up by astrocytic transporters and
converted into glutamine by GS, enter the tri-carboxylic acid (TCA) cycleor enter the cycle for
GABA formation. Part of the recently formed glutamine is shuttled to the neuron, where it is converted into glutamate by the enzyme glutaminase (GA), completing the glutamate-glutamine cycle (figure 8) (Cooper and Jeitner, 2016). GS regulates excitatory neurotransmission by limiting glutamate availability. In addition, since glutamine is a major precursor for
γ-aminobutyric acid (GABA) synthesis (Schousboe et al., 2013), GS also plays a role regulating
inhibitory neurotransmission. Because of that, disruption of GS is known to cause severe neuropsychiatric disorders (Spodenkiewicz et al., 2016).
Figure 8: The glutamine-glutamate cycle
The glutamine produced at the astrocytes is transported to the neurons where it will be converted by the neuronal glutaminase into glutamate. Glutamate then is released or enters the GABA cycle.
Tri-carboxylic acid (TCA), phosphate-activated glutaminase (PAG), adenosine di-phosphate (ADP), adenosine tri-phosphate (ATP), phosphate (Pi).
Glutaminase
Glutaminase (GA) plays essential roles in cell nitrogen metabolism, being responsible for the deamidation of glutamine into glutamate, releasing an ammonia ion. Mammalian GA is encoded by two different genes, resulting in different isoforms: the kidney types (KGA and
GAC) formed as spliced variants of the GLS gene (Elgadi et al., 1999) and liver types (LGA
brain tissue possessing all GA isoforms except for GAC. In addition, the levels of each type of GA depend on the cell type and the individual species (Márquez et al., 2012).
The GA is a dimeric protein which has approximately 54 kDa. It is composed by 2 chains containing 305 residues each, with 8 helices (H) that comprise 23% of the amino acid content, or 71 residues and 23 beta sheet strands (S) that comprise 21% or 95 residues of the protein (figure 9). A N-terminus is formed starting from H3, and the GA structure is stabilized by four disulfide bonds. An active site cleft is located on the protein surface surrounded by S6, S7, S10, S11, H4, H6 with the catalytic residues being Cys-156, His-197, and Asp-217, localized in a catalytic pocket (Hashizume et al., 2011).
Figure 9: The overall structure of protein glutaminase
Ribbon diagrams drawn in left and right stereo from different directions. Disulfide bonds are in yellow with labeled residue numbers. The catalytic residue, Cys-156, is in red. Image from (Hashizume et al., 2011).
GA plays important roles in different organs. In the gut, it transforms glutamine from the diet into ammonia and glutamate, which will then reach the liver. The liver itself has glutaminase activity in order to feed the urea cycle with ammonia. Finally, in the brain GA is
present in neurons (Olalla et al., 2002), where it is responsible for converting glutamine from
The blood-brain barrier
The blood-brain barrier (BBB) is the most important biological barrier in the body. Highly regulated, it physically and biochemically limits the transport of molecules into the brain thereby creating a unique controlled micro-environment. The BBB restricts the transcellular passage of charged, non-lipophilic and large molecules, acting as a shield from blood-derived harmful molecules, allowing for the CNS to properly function. In addition, enzymes within the cells of the BBB can metabolize and prevent certain molecules from entering the brain (Brownson et al., 1994). The BBB is composed by astrocyte foot processes wrapped around a monolayer of endothelial cells with the adjacent pericytes (Figure 10).
Figure 10: The blood-brain barrier
The BBB is composed by endothelial cells (E) and pericytes (P) sharing a basement membrane. Both structures are wrapped around astrocytic foot processes (A). Picture from (Allt and Lawrenson, 2001)
fenestrated, have very little vesicular transport and possess specific junctional complexes, which restricts the passage of molecules into the ECs (Liu et al., 2012; Stewart, 2000). These cells also have high mitochondrial density in order to produce enough energy to sustain active transport systems (Oldendorf and Brown, 1975). Ions (K+, Cl¯, Na+), proteins (albumin), amino acids, nutrients (glucose) and other molecules have to be actively carried into the ECs by transporters, pumps and receptor mediated transcytosis (Wang et al., 2009b). In addition, outward transporters such as ATP-binding cassette (ABC) transporters, are known to expulse potentially harmful molecules therefore protecting the brain (Elali and Hermann, 2011).
Astrocytes
In addition to providing nutrients to neurons, astrocytes are an integral part of the BBB. Their foot processes involve the endothelium and are known to provide structural stability (Caley and Maxwell, 1970). Furthermore, astrocytes interact with the endothelium and are responsible in regulating the barrier phenotype. Cultured astrocytes induce tightening of the endothelium when implanted into leaky areas, and direct contact between these cells and ECs is necessary for optimal BBB properties (Janzer and Raff, 1987), but the relationship between the two cell types is complex. As astrocytes have a role regulating the expression of molecules from the junctional complex of the endothelium (Tao-Cheng et al., 1987), ECs also regulate astrocyte function.
Pericytes
Pericytes are perivascular cells with numerous projections involving the adjacent endothelium. Present in a high density in the BBB (1:3 pericytes/EC instead of 1:100 in vessels outside the BBB)(Allt and Lawrenson, 2001), these cells belong to the smooth muscle cell lineage and therefore are able to regulate capillary blood flow through contraction and relaxation (Hamilton et al., 2010; Peppiatt et al., 2006).
Like astrocytes, pericytes interact with ECs and contribute to vessel stability, although
the mechanisms are still unclear (Zlokovic, 2008). In vitro studies demonstrated that pericytes
stabilize the capillaries formed by endothelial cells cultivated with astrocytes by preventing apoptosis of the ECs (Ramsauer et al., 2002). In addition, there is evidence that pericytes induce
deposition and, its assemble (Stratman and Davis, 2012). Pericytes degeneration is associated with neurological conditions such as epilepsy and multiple sclerosis, showing that this cell type is essential for barrier and brain regulation (Claudio et al., 1995; Liwnicz et al., 1990).
Junctional Complexes
The junctional complexes are formed by a group of intricate proteins, linked to each other and to the cell’s cytoskeleton. These complexes are important to the endothelial barrier formation and paracellular transport of blood-derived molecules (figure 11).
Figure 11: Junctional complexes of the BBB
Tight Junctions
Tight junctions (TJ) are a type of paracellular adhesion complex which play a central
role isolating the intercellular space in endothelium and epithelium (Anderson and Van Itallie,
molecules associated with zona occludens (ZO) 1 to 3, cingulin and other accessory proteins
(Ballabh et al., 2004).
Part of a family with 24 members, claudins are the main barrier-forming proteins. They form dimers which binds to other claudins in adjacent endothelial cells and to ZO proteins.
(Stamatovic et al., 2008). Occludins are integral membrane proteins exclusively found in TJs. This protein forms a dimer that binds to F-actin in the cytoskeleton or to ZO proteins that will then bind to the cell’s cytoskeleton (Liu et al., 2012), and its decrease is linked to increased BBB permeability in ALF (Chen et al., 2009). The junctional adhesion molecules are responsible for keeping TJ stability (Bradfield et al., 2007) by participating in TJ formation and binding to other junctional components such as ZO. The ZO interact directly and with most transmembrane proteins bridging the connection between them and the cell cytoskeleton (Liu et al., 2012). This interaction is necessary for TJ’s function and stability and, because of that, loss of ZO leads to increased BBB permeability (Hawkins and Davis, 2005).
Adherens Junctions
Adherens junctions (AJ) are composed by numerous membrane proteins, such as catenin and cadherin. Catenin are linked to the cell cytoskeleton and are bound to the cytoplasmic
domains of the cadherin (Ballabh et al., 2004). Components of AJ are known to interact and
influence TJ. Interactions between catenin from the adherens and ZO from the tight junctions
influence TJ assembly through the induction of claudin-5 transcription by VE-cadherin (Matter
and Balda, 2003). AJ are responsible for initiating and stabilizing intercellular adhesion and
regulation of the actin cytoskeleton and transcriptional regulation among others (Hartsock and
Nelson, 2008).
Brain edema
Brain edema is one of the most important feature of HE, being also documented in several neurological disorders such as stroke and traumatic brain injury (Córdoba et al., 2001; Ropper, 1984; Unterberg et al., 2004). In type A HE, edema is associated with a change in brain volume
culminating in brain stem herniation and death in up to 55% of these patients (Bernal et al., 2013). In CLD, brain edema is present in compensated (Córdoba et al., 2001) and decompensated patients (Donovan et al., 1998), although rarely progressing to intracranial hypertension.
The development of edema evolves through two different mechanisms: cytotoxic or vasogenic (Figure 12). Vasogenic edema is defined as an accumulation of water in the brain due to disruption of the BBB, and is known to occurs in sepsis (Cotena and Piazza, 2012). Increased permeability due to a physical breakdown of the BBB indicates a severe dysregulation of the tight junctions bridging the endothelial cells together, and consequently molecules that normally do not enter the brain are therefore capable of passing between the cells (paracellular route). Breakdown of the BBB allows the entrance and accumulation of plasma constituents and subsequently water in the extracellular space, leading to edema (Cui et al., 2013).
When BBB breakdown is absent, the increase in osmolytes movement into the brain through an intact BBB causes a change in osmotic pressure inside the cells, which will culminate in water entrance and increase in cell volume, characterizing cytotoxic edema. These molecules (such as NH4+ and other ions) pass through the cells (transcellular route) of the BBB possibly due to the regulation of transporters and channels located on the endothelial cells, and then reach the brain. The astrocytes are the most known targets of cytotoxic swelling, being evaluated in
In vasogenic edema osmolytes pass through the BBB paracellularly due to the lack of TJs, while in cytotoxic edema they pass transcellularly. Figure modified from (Tait et al., 2008)
Pathogenesis of brain edema in HE
Several factors are involved in the pathogenesis of brain edema such as inflammation, oxidative stress and hyperammonemia. Two main theories for the role of hyperammonemia and glutamine have been formulated: the “osmolyte” and the “Trojan horse”. In the former, the principle is that once ammonia is inside the astrocyte, GS will transform ammonia into glutamine, which will accumulate and change the osmotic pressure inside the astrocyte, provoking water entrance and therefore leading to cell swelling (Scott et al., 2013). In the Trojan’s horse hypothesis, glutamine formed by GS is transported into the mitochondria and then converted into glutamate + ammonia by GA. The ammonia build up in the mitochondria causing oxidative stress and impairing the energy metabolism of the cell, which will lead to energy failure and subsequent cellular edema (Albrecht and Norenberg, 2006). Regardless of the mechanism, animal models of HE, when treated with ammonia-lowering agents, showed decrease in brain water, highlighting the importance of this toxin in brain edema (Davies et al., 2009; Ytrebø et al., 2009).
Studies conducted by our laboratory assessed brain edema in the bile duct ligated (BDL), a model of CLD. Results showed that both ammonia and systemic oxidative stress are imperative for the development of brain swelling. Animals that presented only hyperammonemia such as a type B HE model or BDL animals treated with antioxidants (allopurinol) showed less brain water content when compared with hyperammonemia plus ROS, emphasizing the importance of oxidative stress (Bosoi et al., 2012, 2014). On the other hand, the decrease in ammonia concentrations alone, by using the ammonia scavenger AST-120, also caused a decrease in brain water content (Bosoi et al., 2011), showing that ROS alone are not sufficient to cause edema. Finally, the use of pro-oxidant regimens to induce oxidative stress in hyperammonemic type B HE model with no prior edema resulted in the development of brain swelling, stressing the possible synergistic effect between these two toxins. Since the BBB in the BDL rat is not disrupted, it is likely that the origin of the edema is cytotoxic (Bosoi et al., 2012). Finally, because ROS in BDL are only systemic and not central, it is likely that the cells of the BBB, the
Na-K–Cl cotransporter
Several blood-derived molecules can affect the proteins of the endothelial cells of the BBB such as receptors (vascular endothelial growth factor, chemokines) and transporters (amino acids, glucose and ions such as the Na–K–2Cl cotransporter (NKCC)), leading to cell dysfunction. Cytotoxic brain edema is caused by increased osmolyte entry into the brain, and ion transporters might play a central role. The NKCC are part of the cation–chloride cotransporter family (Gillen et al., 1996), and are known to be implicated in cell swelling in
vitro and in vivo.
Presentation
Also known as Bumetanide-Sensitive Cotransporter (BSC), NKCCs are integral membrane proteins with 12 transmembrane domains (figure 13). This transporter carry ions
across cellular membranes and into the cells (Geck et al., 1980; Haas et al., 1982), depending
on the ionic gradient. The binding of the ions is ordered, with the first binding of a Na+ followed
by a Cl−, a K+ and finally Cl−. Inside the cell, the ions are released in the same order that they
were uptaken (Lytle et al., 1998), respecting an electroneutral stoichiometry of 1 Na+:1 K+:2 Cl−
for most cells (Haas, 1989; Russell, 2000) or 2 Na+:1 K+:3 Cl− for at least one cell type (Russell,
1983) in normal ionic conditions.
Two isoforms of the Na-K-Cl cotransporter were identified so far, NKCC1 and NKCC2.
Although 61% identical to each other (Payne and Forbush, 1994), these isoforms are localized
in different membrane domains, where they play different physiological roles. The BSC1 transporter, also known as NKCC2, has 121kDa, with approximately 1100 amino acid residues
encoded by the Slc12a1 gene on chromosome 15q15–q21.1 (Payne and Forbush, 1994). It is
found mainly in the apical portion of mammalian kidney cells where it has a role in ion reabsorption (Ares et al., 2011; Kaplan et al., 1996). Mutations on this gene in humans are rare
and associated with clinically reduced blood pressure and protection from hypertension (Ji et
depending on the species (D’Andrea et al., 1996; Lytle et al., 1992; Tanimura et al., 1995), on sodium dodecyl sulfate polyacrylamide gels (SDS-PAGE) due to its glycosylation.
Figure 13: Schematics of NKCC1
TM = transmembrane domain. The transporter possesses a central domain with 12 TM sites, a N- and a C-terminal (Russell, 2000).
Functions
NKCC1 is an ubiquitary transporter that has two important roles: secretory activity and cell volume regulation. In secretory epithelia, NKCC1 from the basolateral cellular membrane internalize ions (active osmolytes), forcing the entry of water into the cells by osmotic pressure. In other locations, such as the endothelial cells of the BBB, NKCC1 is found mostly in the apical
membrane, facing the lumen of the vessels (O’Donnell et al., 2004). This location agrees with
its role of transporting ions and water from the blood and into the brain, contributing to the formation of the interstitial fluid. Osmolytes have a major influence in water movement across membranes, which give ionic channels such as NKCC1 an important role in cell volume
regulation (Russell, 2000). NKCC1 responds to cell volume and ion content and is implicated
The influence of NKCC1 in cell volume regulation is well documented, and dysregulation of this process is shown to be related to cellular (cytotoxic) edema. In HE, many factors can dysregulate NKCC1, culminating in brain edema. In a model of ALF induced by
thioacetamide, with hyperammonemia, inflammation and oxidative stress (Demirel et al., 2012;
Sathyasaikumar et al., 2007), an increase in brain NKCC1 total protein and phosphorylation was presented. The increase in NKCC1 protein was also associated with increase in brain water,
which was attenuated by bumetanide (Jayakumar et al., 2011). Astrocyte swelling is a central
feature of brain edema in HE. When astrocytes were exposed to up to 5mM of ammonia, NKCC1 expression and phosphorylation was found increased and cell swelling was observed. In addition, high ammonia levels are linked with oxidative and nitrosative stress. In fact, NKCC1 was shown to be nitrated/oxidized and treatment with anti-oxidants and nitric oxide
synthase decreased swelling and decreased NKCC1 phosphorylation and activity (Jayakumar et
al., 2008).
Regulation
Phosphorylation
Activation of NKCC1 occurs following the phosphorylation of serine and threonine
residues of its cytosolic terminus (Flatman, 2002). The most relevant kinases involved in the
process are Ste20 Proline Alanine-rich Kinase (SPAK) and the Oxidative Stress Response kinase (OSR1). The phosphorylation process starts with physical interaction of the with no
lysine kinase (WNK) with SPAK/OSR1. WNK phosphorylates SPAK/OSR1 at the catalytic and
regulatory domains, activating them. Finally, SPAK/OSR1 activate and phosphorylate NKCC1
(Gagnon et al., 2006). The SPAK/OSR1 phosphorylation sites at NKCC1 are two amino acid residues with a RFxV motif in the N-terminus, being only one motif sufficient and essential for
transporter activation (Piechotta et al., 2002). At the same time, activated WNK and activated
SPAK/OSR1 act by phosphorylating and inactivating KCC (K+, 2Cl¯ extrusion transporter). The
and it can facilitate its phosphorylation even without upstream WNK activation (Markadieu and Delpire, 2014; Ponce-Coria et al., 2012).
Other kinases might also be involved in the phosphorylation process. In endothelial cells, p38 and Jun amino-terminal Mitogen Activated Protein Kinases (MAPK) activation in ischemic conditions (hypoxia and aglycemia) was linked to increase in NKCC1 activity, and the inhibition of these kinases by specific blockers prevented the effect (Wallace et al., 2012). Brain edema in traumatic brain injury was related to increased NKCC1, and the water content was decreased by bumetanide. In this model, MAPK were related to the increase in NKCC1 mRNA and protein expression (Lu et al., 2008)
Regulation by ion concentration
First, since the functioning of the transporter depends on the simultaneous presence of Na+, K+ and Cl¯, the amount of each ion can affect its activity. Hyperammonemia can upregulate
the transporter possibly by increasing its substrate, since ammonia and K+ share similar ionic
properties.
Glycosylation
Glycosylation of NKCC1 on the large TM7-TM8 loop is essential for its membrane expression, activity and affinity for loop diuretics (Markadieu and Delpire, 2014). In fact, when glycosylation was inhibited by tunicamycin, a severe reduction of NKCC1 activity was observed. In addition, mutation on the glycosylation sites on the N-terminus site linked to
glycosylation (N442) causes increase in Cl- and a decrease in bumetanide binding (Paredes et
al., 2006).
Others
Other factors might play a role in NKCC1 regulation, possibly by implicating one or more of the factors listed above, e.g. hormones, cytokines, signaling cascades, growth factors,
Synthetic Inhibitors
Finally, NKCC1 is known to be inactivated by loop diuretics (furosemide, bumetanide),
by binding at the transmembrane domains 2-7 and 11-12 (figure 13) (Payne and Forbush, 1995).
Bumetanide is considered the one with highest inhibitory capacity.
Animal models of HE
Studies in humans are challenging due to high costs, sample variability and accessibility and ethical concerns, therefore the use of animal’s models remains the most reliable option. Type A HE models results from severe inflammatory and necrotic liver disease with rapid progression of symptoms to coma. Type A models are induced following the acute administration of hepatic toxins (galactosamine, acetaminophen, thioacetamide and azoxymethane), which will lead to rapid hepatic necrosis and severe liver injury (table 3). Type B models are induced surgically following a porto-caval anastomosis in which the portal vein is ligated to the vena cava, enabling gut-derived toxins from the liver to direct enter the systemic circulation. This model presents hyperammonemia and minimal HE without liver injury (Butterworth et al., 2009). There are no optimal models of type C HE so far. Laboratory animals do not respond to hepatitis virus, alcohol or fat intake like humans. Although biliary cirrhosis represents only a small fraction of the CLD aetiologies in humans, the BDL rat is a strong model of type C HE presenting several features of the human disease such as jaundice, portal hypertension, portal-systemic shunting, immune system dysfunction and bacterial translocation (Dunn et al., 1991; Greve et al., 1990; Kountouras et al., 1984).
Table 3: Animal models of HE.
HE
type Model Mechanism Characteristics
A Thioacetamide Hepatic necrosis Hyperammonemia, brain edema, oxidative stress (Rama Rao et al., 2010)
A Azoxymethane Hepatic necrosis Hyperammonemia, brain edema (Nguyen et al., 2006) A Acetaminophen Hepatic necrosis Hyperammonemia, brain
edema, oxidative stress (Fontana, 2008)
A Galactosamine Hepatic necrosis Hyperammonemia, brain edema, oxidative stress (Gamal et al., 2014) B Porto-caval
anastomosis
Non-detoxification of toxins without hepatic injury
Hyperammonemia (Bosoi et al., 2014)
C Bile duct ligation Extra-hepatic cholestasis
Hyperammonemia, brain edema, oxidative stress (Bosoi et al., 2012)
The bile duct ligated rat
The bile duct ligated rat (BDL) is a model of extra-hepatic cholestasis, in which a resection of the common bile duct is made resulting in hepatic build-up of bile and subsequent fibrosis and cirrhosis. Marked by the development of minimal/covert HE (4-6 weeks), the BDL rat presents systemic and central hyperammonemia, systemic oxidative stress (Bosoi et al., 2012) and brain pro-inflammatory cytokine TNF-alpha (Sheen et al., 2016).
Brain swelling is a well-known feature of this model (Bosoi et al., 2011; Dhanda et al., 2013). The use of permeability tests by our lab found that the BBB is not broken and the edema in the BDL rat thus arise from cytotoxic origin (Bosoi et al., 2012).
Aim of the project
Brain edema is a serious complication of HE, but its pathogenesis is still unclear. Cytotoxic edema is known to affect astrocytes, with ammonia and ROS toxicity being involved. EC of the BBB are the first cells in contact with possible blood-derived harmful molecules, but surprisingly their role in ammonia metabolism and brain edema has never been thoroughly explored. Therefore, the aim of this study is to evaluate the effects of hyperammonemia and ROS on the BBB in the pathogenesis of brain edema in vivo and in vitro by:
1- Assessing the effect of liver disease, ammonia and oxidative stress on NKCC1 expression in EC’s of BBB in vitro and in vivo
2- Exploring GS and ammonia metabolism in health and liver disease, with varying ROS and ammonia conditions in EC’s of the BBB in vitro and in vivo.