Unveiling two new trichome-specific promoters of Nicotiana tabacum
12
Mathieu Pottier$, Raphaëlle Laterre, Astrid Van Wessem, Aldana M. Ramirez, Xavier 3
Herman, Marc Boutryand Charles Hachez* 4
5
Louvain Institute of Biomolecular Science and Technology, University of Louvain, 1348 6
Louvain-la-Neuve, Belgium 7
8 $
Current address: InBioS-PhytoSYSTEMS, Laboratory of Plant Physiology, University of 9
Liège, B-4000, Liège, Belgium 10
11
* Corresponding author: Charles Hachez, charles.hachez@uclouvain.be, + 32 10 47 37 96 12 13 ORCID: 14 Mathieu Pottier: 0000-0003-1551-4699 15 Marc Boutry: 0000-0002-2315-6900 16 Charles Hachez: 0000-0002-3688-7614 17 18
Author contributions MP, RL, CH and MB designed the experiments and analyzed the data. 19
MP, RL, AVW, AR, XH and MB performed experiments. CH, MP and MB wrote the 20
manuscript. 21
22
Acknowledgments The authors are grateful to Joseph Nader for his technical contribution. 23
This work was supported by the Belgian Fund for Scientific Research (Grant ID: MIS – 24
F.4522.17), the Interuniversity Poles of Attraction Program (Belgian State, Scientific, 25
Technical and Cultural Services), and an EU Marie Skłodowska-Curie fellowship (Project ID: 26
658932) to MP. 27
28
Conflict of Interest The authors declare that they have no conflict of interest. 29
Abstract
30Main conclusion pRbcS-T1 and pMALD1, two new trichome-specific promoters of 31
Nicotiana tabacum, were identified and their strength and specificity were compared to 32
those of previously described promoters in this species. 33
34
Abstract Nicotiana tabacum has emerged as a suitable host for metabolic engineering of 35
terpenoids and derivatives in tall glandular trichomes, which actively synthesize and secrete 36
specialized metabolites. However, implementation of an entire biosynthetic pathway in 37
glandular trichomes requires the identification of trichome-specific promoters to appropriately 38
drive the expression of the transgenes needed to set up the desired pathway. In this context, 39
RT-qPCR analysis was carried out on wild-type N. tabacum plants to compare the expression 40
pattern and gene expression level of NtRbS-T1 and NtMALD1, two newly identified genes 41
expressed in glandular trichomes, with those of NtCYP71D16, NtCBTS2α, NtCPS2, and 42
NtLTP1, which were reported in the literature to be specifically expressed in glandular 43
trichomes. We show that NtRbcS-T1 and NtMALD1 are specifically expressed in glandular 44
trichomes like NtCYP71D16, NtCBTS2α, and NtCPS2, while NtLTP1 is also expressed in 45
other leaf tissues as well as in the stem. Transcriptional fusions of each of the six promoters to 46
the GUS-VENUS reporter gene were introduced in N. tabacum by Agrobacterium-mediated 47
transformation. Almost all transgenic lines displayed GUS activity in tall glandular trichomes, 48
indicating that the appropriate cis regulatory elements were included in the selected promoter 49
regions. However, unlike for the other promoters, no trichome-specific line was obtained for 50
pNtLTP1:GUS-VENUS, thus in agreement with the RT-qPCR data. These data thus provide 51
two new transcription promoters that could be used in metabolic engineering of glandular 52
trichomes. 53
54
Keywords Rubisco small subunit, Major Allergen Mal D 1.0501, Cembratrien-ol Synthase, 55
Copal-8-ol diphosphate Synthase, Lipid Transfer Protein, Cytochrome P450 oxygenase 56
Introduction
57Trichomes are epidermal outgrowths covering most of aerial tissues in a large number of 58
plant species. Several types of trichomes (unicellular or multicellular, glandular or non-59
glandular) can be observed in a single plant species. Among those, glandular trichomes are 60
characterized by cells forming a glandular structure that secretes or stores specialized (also 61
called secondary) metabolites (e.g., phenylpropanoids, flavonoids, acyl sugars, 62
methylketones, and terpenoids). Many of these possess antimicrobial and antifungal 63
properties or act as a defense barrier against herbivorous insects (Schilmiller et al. 2008). 64
The specialized metabolites secreted by glandular trichomes, which might represent up to 65
17 % of the leaf dry weight in Nicotiana tabacum (tobacco), have been largely exploited over 66
centuries (Wagner et al. 2004). One of their most ancient uses originates from their aromatic 67
properties and fragrances. Besides, these specialized metabolites constitute an interesting 68
source of pharmaceuticals and food additives. Some specialized metabolites are only found in 69
a single plant species or even a single plant cultivar and often at low concentration (e.g., taxol 70
found in Taxus sp., artemisinin in Artemisia annua or cannabinoids in Cannabis sativa). 71
Therefore, natural resources are often insufficient to reach the global need (Van Agtmael et al. 72
1999; Yoon et al. 2013), while the complex stereochemistry of these compounds often 73
prevents their full chemical synthesis in a cost-effective way. 74
In order to increase the overall yield, metabolic engineering strategies are undertaken in a 75
variety of host species (Kirby and Keasling 2009; Marienhagen and Bott 2013). Advances in 76
plant biotechnology and increasing knowledge in specialized metabolism also make possible 77
to exploit plants as production platforms. One of the main advantages of using them is that 78
they are photoautotrophic organisms, therefore requiring simple and cheap growth conditions, 79
which accounts for a cost-effective production (Kempinski et al. 2015). In addition, their 80
ability to deal with membrane proteins such as P450 enzymes and posttranslational 81
modifications such as glycosylation, are two key features frequently limiting in prokaryotic 82
hosts (van Herpen et al. 2010). 83
Terpenoids and derivatives are the most abundant plant specialized metabolites in terms of 84
sheer number and chemical diversity (for review, see Croteau et al. 2000; Bouvier et al. 2005; 85
Gershenzon and Dudareva 2007) and N. tabacum has emerged as one of the most suitable 86
plant hosts for their biosynthesis (Moses and Pollier 2013; Lange et al. 2013; Wang et al. 87
2016). Indeed, N. tabacum synthesizes a very high amount of a limited range of specialized 88
metabolites (Huchelmann et al. 2017). This combined to its high biomass, its fast growth rate, 89
and its easy genetic transformation make it an interesting host to implement the biosynthesis 90
pathways of terpenoid compounds and derivatives thereof. 91
However, engineering terpenoid biosynthetic pathways using ubiquist promoters 92
frequently leads to severe phenotypes including dwarfism, chlorosis, and decreased seed 93
production due to the cytotoxicity of these compounds or detrimental impact on the 94
biosynthesis of essential metabolites (Saxena et al. 2014; Gwak et al. 2017; reviewed in 95
Huchelmann et al. 2017). To avoid these adverse effects, a fine control of the spatiotemporal 96
expression of the transgenes, restricting the biosynthesis of potentially cytotoxic metabolites 97
to specialized organs, is desirable (Huchelmann et al. 2017). Since N. tabacum glandular 98
trichomes contain an important pool of terpenoid precursors and have naturally evolved to 99
deal with high concentrations of terpenoids, they make ideal targets to develop such a 100
metabolic engineering approach. For this purpose, identification of trichome-specific 101
transcription promoters is required. 102
A proteomic comparison was recently performed in N. tabacum between proteins 103
extracted from tall glandular trichomes and those extracted from other plant organs (Laterre et 104
al. 2017). This led to the identification of 47 proteins that were more abundant in tall 105
glandular trichomes, the most enriched ones being a putative PR-10 type pathogenesis-related 106
protein, namely Major Allergen Mal D 1.0501 (MALD1) and a Ribulose-1,5-Bisphosphate 107
Carboxylase/oxygenase Small subunit (RbcS-T1) (Laterre et al. 2017). For both, semi-108
quantitative RT-PCR supports trichome-specific localization of their corresponding 109
transcripts (Harada et al. 2010; Laterre et al. 2017). 110
This suggests that the NtMALD1 and NtRbcS-T promoters may confer trichome-specificity, 111
as those of CYtochrome P450 oxygenase 71D16 (NtCYP71D16), Copal-8-ol diPhosphate 112
Synthase 2 (NtCPS2), Lipid Transfer Protein 1 (NtLTP1), and CemBraTrien-ol Synthase 2α 113
(NsCBTS2α) previously described (Wang et al. 2002; Ennajdaoui et al. 2010; Choi et al. 2012; 114
Sallaud et al. 2012). However, these six genes were investigated separately, preventing one to 115
compare their transcript levels. In addition, for some of them, cell-type specificity monitored 116
by the GUS reporter gene was not described in other organs than leaves. The present study 117
thus aimed at comparing the expression patterns and expression levels of NtCYP71D16, 118
NtCBTS2α, NtCPS2, NtLTP1, NtRbS-T1, and NtMALD1 in N. tabacum. Their transcript levels 119
in trichomes and different organs were compared. Transcriptional fusions of each promoter to 120
GUS-VENUS were expressed in transgenic N. tabacum plants. GUS staining corroborate 121
transcripts data and indicate that all promoters, except for pNtLTP1, can be used to drive 122
trichome-specific expression. 123
124
Materials and methods
125Plant material and plant growth conditions 126
Nicotiana tabacum cv Petit Havana SR1 (Maliga et al. 1973) plants were used in this work. 127
For the in vitro cultures, seeds were sterilized by immersion in 1 ml 70% (v/v) ethanol for 1 128
min and then in 1 ml 50% (v/v) commercial bleach for 2 min. Seeds were then washed three 129
times with 1 ml of sterile MilliQ water and kept at 4°C, in the dark, during 48 h for 130
stratification. Sterilized seeds were sown on solid Murashige and Skoog (MS) medium [4.33 131
g.l-1 MS salts (MP Biochemicals, Solon, OH, USA; www.mpbio.com), 3% (w/v) sucrose, 1% 132
(w/v) agar, pH 5.8 (KOH)] and placed in the growth chamber at 25°C under a 16 h 133
photoperiod (50 μmol photon m-2 sec-1). For the soil cultures, seeds were stratified before 134
being sown in potting soil (DCM, Grobbendonk, Belgium; dcm-info.com). Isolated plantlets 135
coming from potting soil or in vitro conditions were transferred to Jiffy pots (Gronud, 136
Norway; www.jiffypot.com) before being transferred to bigger pots containing potting soil 137
(DCM). Plants on soil were grown under controlled conditions, in a phytotron set at 25°C and 138
with a 16 h photoperiod (300 μmol photon m-2 sec-1). 139
140
Tissue isolation, RNA extraction and cDNA synthesis 141
Trichomes were removed from tissues of 6-week-old plants following the cold-brushing 142
method (Wang et al. 2001). For gene expression in trichomes during leaf development, the 143
analysis was performed in triplicate. Trichomes were isolated from leaves at different 144
developmental stages defined here by leaf length: < 2.5 cm (stage I), between 2.5 cm and 6.5 145
cm (stage II), between 6.5 cm and 15 cm (stage III), and > 15 cm (stage IV). For gene 146
expression in different tissues, the analysis was performed in three to five replicates on roots, 147
trichomes-free stems, trichomes-free leaves, and leaf trichomes (pool of leaves from stage I to 148
stage III) from 6-week-old plants, and flowers from 10-week-old plants. For each biological 149
replicate (except for isolated trichomes), 100 mg of material was pre-ground in liquid nitrogen 150
using a mortar and pestle. Pre-ground tissues and isolated trichomes were ground in 2 mL 151
Precellys tubes containing 200 μl of ceramic beads Zirmil (0.5 mm, Saint Gobain Zipro, Le 152
Pontet, France) and 500 μl of lysis/2-Mercaptoethanol solution of the SpectrumTM Plant Total 153
RNA Kit (Sigma-Aldrich, St. Louis, Missouri, USA; http://www.sigmaaldrich.com). Samples 154
were subjected to four consecutive 30 s grinding periods at 6,000 rpm using a Precellys 24 155
(Bertin Technologies, Montigny-le-Bretonneux, France). The homogenates were centrifuged 156
at 1,000 g for 3 min (Eppendorf 5430, Hamburg, Germany). The subsequent steps of the RNA 157
extraction were performed on the supernatants according to the manufacturer’s specifications, 158
except that the 56 °C incubation step was omitted. RNA was eluted in 50 µl elution buffer and 159
quantified using a spectrophotometer (Nanodrop® ND-1000, Isogen Life Science,The 160
Netherlands; www.isogen-lifescience.com). Genomic DNA contamination was eliminated by 161
using the On-Column DNase I Digestion Set (Sigma-Aldrich, St. Louis, Missouri, USA; 162
www.sigmaaldrich.com). The RNA was finally flash frozen in liquid nitrogen and stored at -163
80°C. DNA-free RNA (500 µg) was used for reverse transcription using the Moloney Murine 164
Leukemia Virus Reverse transcriptase (Promega, Madison, Wisconsin, USA; 165
be.promega.com) and oligo(dT)18. Reverse transcription mixture was added according to the 166
manufacturer’s specifications. After adding the transcriptase, samples were incubated for 5 167
min at 25°C, followed by 1 h at 42°C and 5 min at 85°C, placed on ice for 5 min, aliquoted, 168 and stored at -20°C. 169 170 Gene expression 171
Gene-specific RT-qPCR primers listed in Supplemental Table S1 were designed at the 172
3’end of the coding sequence, (size, about 100 bp; melting temperature, 60°C) using 173
OligoPerfect™ Designer (www.thermofisher.com). cDNA (5 µl, 17 fold diluted) was used as 174
a template in 20 µl RT-qPCR reaction, which also contained 10 µl of the Power SYBR green 175
PCR master mix of qPCR master mix plus for SYBR Green I (Eurogentec, Seraing, Belgium, 176
https://secure.eurogentec.com/eu-home.html ) and 5 µl of primer mix (1.3 µM each). 177
Amplification was performed on an ABI 7500 Real-Time PCR system (Waltham, 178
Massachusetts, USA; http://www.thermofisher.com). Primer specificity was confirmed by 179
analysis of the melting curves. For each tissue, primer amplification efficiency (≥ 95%) was 180
determined using five standards from serial dilutions of a cDNA pool of the biological 181
replicates used for gene expression analysis. Relative transcript levels were calculated 182
following the 2–∆∆Ct method (Livak and Schmittgen 2001) with the geometric mean of 183
mitochondrial ATP-synthase β-subunit (NtATP2), ubiquitin (NtUBQ), and elongation factor α 184
(NtEF1α) transcripts used as reference for comparison between different tissues (three to five 185
replicates), and of NtATP2, NtUBQ, and actin (NtACTIN), for comparison between different 186
leaf developmental stages (three replicates). For absolute quantification (three replicates), 187
PCR products amplified by gene-specific RT-qPCR primers listed in Supplemental Table S1 188
were cloned in pGEM-T Easy vector (Promega, Madison, Wisconsin, USA) prior to their 189
sequencing. Constructs were linearized by PstI restriction, purified using Nucleospin Extract 190
II kit (Macherey-Nagel, Düren, Germany) and rigorously quantified through UV (260 nm) 191
absorption using a spectrophotometer (Nanodrop® ND-1000, Isogen Life Science, The 192
Netherlands; www.isogen-lifescience.com). For each quantified purified linear plasmid, the 193
copy number was determined according to the following equation (Godornes et al. 2007): 194
copy number = (vector amount [g]) × 6.023 × 10²³ [molecules/mole]) / (660 [g/mole/base] × 195
size of the vector+insert [bases]. Absolute transcript levels were then determined through the 196
absolute standard curve method. Thus, for each studied gene, standards (2 x 10⁶, 2 x 10⁵, 2 x 197
104, 2 x 10³ copies) obtained by serial dilution of the purified linear plasmids were included in 198
duplicate in q-PCR plates used to study gene expression during trichome development. 199
200
Generation of plants expressing PROMOTER:GUS-VENUS fusions 201
The transcription promoter regions of NtRbcS-T1 (1993 pb; GenBank accession: 202
MG493459.1) and NtMALD1 (1974 pb; GenBank accession: MG493458.1) were identified 203
blasting the EST corresponding to NtRbcS-T1 (GenBank accession: DV157962) and 204
NtMALD1 (GenBank accession: FS387666) coding sequences to the genome of N.
205
tabacum TN90 in the Solgenomics database (http://solgenomics.net). The promoter regions of 206
NsCBTS2α (985 bp; GenBank accession: HM241151.1), NtLTP1 (849 bp; GenBank
207
accession: AB625593.1), NtCYP71D16 (1852 pb; GenBank accession: AF166332.1), and 208
NtCPS2 (1448 bp; GenBank accession: HE588139.1) were defined as previously (Wang et al. 209
2002; Ennajdaoui et al. 2010; Choi et al. 2012; Sallaud et al. 2012). Promoter regions were 210
amplified by PCR using as a template genomic DNA prepared from N. tabacum or N. 211
sylvestris leaves and the primers listed in Supplemental Table S2. The amplified fragments 212
were inserted in the pGEM®-T Easy Vector (Promega, Madison, Wisconsin, USA; 213
www.promega.com) and sequenced. Cloned fragments were cleaved using HindIII (or NotI 214
for pNtMALD1 and pNtRbcS-T1) and KpnI, prior to their insertion in a pAUX3131 construct 215
(Navarre et al. 2011), upstream of the GUS-VENUS coding sequence. The fusion construct 216
was excised using I-SceI and inserted into the pPZP-RCS2-nptII plant expression vector 217
(Goderis et al. 2002), also cut with I-SceI. The construct was introduced into Agrobacterium 218
tumefaciens LBA4404 virGN54D (van der Fits et al. 2000) for subsequent N. tabacum leaf 219
disc transformation (Horsch et al. 1986). For each construct, 24 to 45 independent transgenic 220
lines were generated and finally transferred to soil to be analyzed by GUS staining. 221
GUS histochemical analysis 223
Histochemical staining of plant tissues for GUS activity was conducted during 3h30 as 224
described previously (Bienert et al. 2012). However, to allow substrate access to the 225
trichomes covered by the oily exudate, incubation was performed in the presence of 1% 226 Triton X-100. 227 228 Statistical analysis 229
All tests were performed using the R software. For q-PCR, data were analyzed using 230
kruskal.test (Kruskal–Wallis) function for multiple comparisons. For multiple comparisons, 231
nparcomp package was used to perform Tukey post-hoc test when significant differences 232
were detected (P < 0.05). Different letters indicate significant differences between samples. 233
234
Results
235236
In a 2D gel analysis of glandular trichome proteins from N. tabacum, several spots were 237
identified as trichome-specific proteins, among which RbcS-T1 and MALD1 (Laterre et al. 238
2017). Here, the RNA levels of NtRbS-T1 and NtMALD1 as well as of NtLTP1, NtCYP71D16, 239
NtCBTS2α, and NtCPS2 previously reported as genes specifically expressed in tall glandular 240
trichomes, were compared in trichomes and different N. tabacum organs. To do so, leaves 241
were frozen in liquid nitrogen and carefully scratched with a brush to collect the trichomes. 242
RT-qPCR assays were then performed on RNA extracted from trichomes, roots, trichome-free 243
leaves, and trichome-free stems of six-week-old plants as well as from flowers of 10-week-244
old plants. Unlike for leaves and stems, trichomes could not be retrieved from flower sepals 245
and petals. Because different organs had to be compared, it was important to use reference 246
genes, whose expression little varies according to the organ. The transcript levels of ubiquitin 247
(NtUBQ), mitochondrial ATP-synthase β-subunit (NtATP2), actin (NtACTIN), and elongation 248
factor α (NtEF1α), frequently described as reference genes, were thus monitored. On the basis 249
of this analysis, we found that NtUBQ, NtATP2, and NtEF1α genes were the most stable, 250
therefore the geometric mean of their transcripts was used to normalize the data 251
(Supplemental Fig. S1). For each studied gene, the relative expression level in trichomes was 252
arbitrarily set to one. All six investigated genes showed a higher relative expression level in 253
isolated trichomes compared to the levels observed in roots, leaves, stems or flowers (Fig. 1). 254
NtCYP71D16, NtCBTS2α, NtCPS2, NtRbS-T1, and NtMALD1 exhibited very low or even
255
undetectable expression in roots, trichome-free leaves and trichome-free stems, while higher 256
transcript levels were found for NtLTP1 in leaves and stems. Expression was observed in 257
flowers for the six genes but, as noted above, sepal and petal trichomes could not be removed 258
from these organs. 259
As most of these genes are involved in the biosynthesis (NtCYP71D16, NtCBTS2α, and 260
NtCPS2) or transport (NtLTP1) of specialized metabolites secreted by mature glands, we 261
wondered whether the leaf developmental stage could impact their expression in trichomes. 262
Thus, glandular trichomes were isolated from leaves at different developmental stages, 263
arbitrarily defined by the leaf length: < 2.5 cm (stage I), between 2.5 cm and 6.5 cm (stage II), 264
between 6.5 cm and 15 cm (stage III), and > 15 cm (stage IV). In this experiment, NtUBQ, 265
NtATP2, and NtACTIN transcripts were the most stable, therefore the geometric mean of their 266
transcripts was used to normalize the data (Supplemental Fig. S2). While the transcript level 267
of NtLTP1 appeared stable during leaf development, expression of the other five genes 268
steadily increased until stage III where it reached a plateau (Fig. 2). The opposite trend was 269
observed for elongation factor α (NtEF1α), which peaked at stage I (Supplemental Fig. S2), 270
confirming that the observed increasing level of these five genes is not an artifact of the 271
normalization method. Among them, NtRbcS-T1 was the gene for which the transcript level 272
increased the most with leaf development (4-fold increase). Expression of NtCBTS2α and 273
NtCYP71D16 involved in the biosynthesis of cembrenes, the major subgroup of diterpenes 274
produced by N. tabacum glandular trichomes, also exhibited a large increase (3.8- and 3.6-275
fold, respectively) (Fig. 2). A more moderate increase was found for NtMALD1 (2.6-fold) and 276
NtCPS2 (2.4-fold) transcripts, the latter being involved in the biosynthesis of another 277
subgroup of diterpenes, namely labdanes. 278
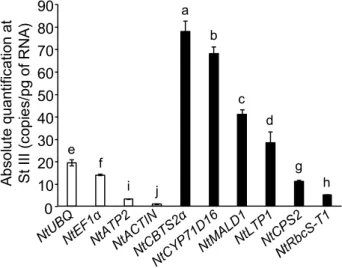
The absolute expression levels of all six genes of interest was then determined using the 279
absolute standard curve method in isolated trichomes for developmental stage III at which all 280
genes reached a maximal expression, (Fig. 3, see Material and methods for details). Several 281
control genes, some of which were used to normalize the relative expression data shown in 282
Figures 1 and 2, were also added to the study for comparison purposes. Among control genes, 283
the absolute expression levels (Fig. 3) were in agreement with previously published data in 284
other Solanaceae species (Lu et al. 2012; Lacerda et al. 2015). Genes involved in cembrene 285
production, NtCBTS2α (78.0 copies/pg), and NtCYP71D16 (67.9 copies/pg), were the most 286
expressed genes at stage III (Fig. 3), while a lower expression was found at this stage for 287
NtMALD1 (40.8 copies/pg), NtLTP1 (28.2 copies/pg), NtCPS2 (labdane diterpenes, 11.1 288
copies/pg) and NtRbS-T1 (5.1 copies/pg). 289
To further confirm the trichome-specific expression pattern observed by RT-qPCR, we 290
generated transcriptional reporter lines using a GUS-VENUS coding sequence. In the 2D gel 291
analysis which led to the identification of trichome-specific proteins, two spots had been 292
identified as trichome-specific RbcS (Laterre et al. 2017). At that time, only the N. 293
benthamiana genome sequence was available and a RbcS transcription promoter (pNbRbcS-294
T) corresponding to the minor RbcS spot had been retrieved from this species and 295
characterized (Laterre et al. 2017). Once the sequence of a N. tabacum genome became 296
available, we identified pNtRbcS-T1 (accession: MG493459.1) as the promoter of the gene 297
corresponding to the major trichome RbcS spot (NtRbcS-T1; accession: DV157962). The 298
NtMALD1 promoter (accession: MG493458.1), corresponding to the NtMALD1 spot 299
(accession: FS387666) was identified as well. The GUS-VENUS coding sequence was fused 300
to N. tabacum genomic fragments of 1993 bp and 1974 bp upstream of the translation 301
initiation codon of NtRbcS-T1 and NtMALD1, respectively (Fig. 4). For the other genes, the 302
previously published promoter regions, i.e. 985 bp (NsCBTS2α), 849 bp (NtLTP1), 1852 bp 303
(NtCYP71D16), and 1448 bp (NtCPS2) (Wang et al. 2002; Ennajdaoui et al. 2010; Choi et al. 304
2012; Sallaud et al. 2012) were isolated and similarly fused to the GUS-VENUS coding 305
sequence. These constructs were introduced in N. tabacum through Agrobacterium 306
tumefaciens-mediated transformation. For each construct, 24 to 45 independent transgenic 307
lines were generated and their GUS activity was monitored in T0 and then confirmed on T1 308
lines. A large majority (83-95%) of the generated lines displayed GUS activity in tall 309
glandular trichomes. This indicates that appropriate cis-sequences required for expression in 310
tall glandular trichomes are present in the promoter sequences fused to the reporter gene. With 311
the exception of the pNtLTP1:GUS-VENUS reporter (see below), several lines for the other 312
constructs had their GUS activity restricted to glandular trichomes on aerial parts of the plant 313
(examples are displayed for each construct in Fig. 5a-r and Supplemental Fig. 3) while no 314
signal was recorded in roots (Supplemental Fig. 3). In these lines, trichome expression was 315
further confirmed by following VENUS fluorescence on living tissue by confocal microscopy 316
(Fig. 5). The NtCPS2 promoter provided strong expression in both leaf short and tall 317
glandular trichomes, while the other four constructs only labelled tall glandular trichomes 318
(Fig. 5j-l). 319
For each of these five constructs, other lines had their expression extended to other cell 320
types, with a pattern and an intensity varying according to the line, a typical consequence of 321
the position effect (see discussion). As an exception, all pNtLTP1:GUS-VENUS lines 322
displayed GUS activity in various leaf and stem tissues (Fig. 5p-r and Supplemental Fig. 3), 323
confirming the absence of trichome specificity revealed by RT-qPCR data. 324
325
Discussion
326327
In this work, the tissue-specific expression pattern of six N. tabacum genes, namely 328
NtLTP1, NtCYP71D16, NtCBTS2α, NtCPS2, NtRbcS-T1, and NtMALD1, was analyzed. In 329
fact, although these genes were previously described as specific, their trichome-330
specific expression at the transcript level had not yet been quantified and compared. We 331
performed this comparison through RT-qPCR using RNA isolated from trichomes and 332
different plant organs as well as GUS-VENUS reporter genes using, when available, 333
previously published promoter sequences. 334
RT-qPCR analysis showed that all these genes except for NtLTP1, are specifically 335
expressed in trichomes in N. tabacum (Fig. 1). Regarding NtLTP1 transcripts, they were also 336
identified in leaf and stem tissues cleared from trichomes (Fig. 1). This observation is in line 337
with previously published semi-quantitative RT-PCR which showed that NtLTP1 is expressed 338
in different organs (Fig. 1; Harada et al., 2010). Apart from NtLTP1, whose expression was 339
almost constant during leaf development, that of the other five genes was lower at an early 340
stage of leaf development and reached a maximum at stage III (Fig. 2), presumably when the 341
specialized metabolism in which they are involved is fully operating. This is also true for 342
NtRbcS-T1 and this observation is in agreement with the hypothesis that in glandular 343
trichomes, Rubisco recycles the CO2 released by the specialized metabolism (Pottier et al. 344
2018). These expression data may help choose appropriate trichome-specific promoters to 345
drive the expression of a transgene for metabolic engineering purposes. Although 346
NtCYP71D16 and NtCBTS2α lead to higher expression level in trichomes at stage III of leaf 347
development, NtCPS2 and NtMALD1 promoters should lead to a more homogenous 348
expression of transgenes among leaves at different developmental stages. 349
Our analysis of GUS-VENUS reporter lines revealed that, in almost all of them, the six 350
promoters drove gene expression in the head cells of tall glandular trichomes of N. tabacum 351
(Fig. 5). However, in agreement with the transcript level analysis (Fig. 1; Harada et al., 2010), 352
we observed GUS reporter activity in other organs than trichomes in all the lines expressing 353
the NtLTP1:GUS-VENUS construct (Fig. 5p-r and Supplemental Fig. S4p-r). The examination 354
of similar lines by Choi et al., (2012) has also revealed some GUS reporter activity in other 355
cell types than trichomes while the expression in the stem was not displayed. We thus 356
conclude that the NtLTP1 promoter does not confer trichome-specific expression. On the 357
contrary, trichome-specific GUS activity was observed in lines expressing any of the five 358
other constructs (Fig. 5 and Supplemental Fig. S4), which is consistent with our RT-qPCR 359
analysis (Fig. 1). However, other lines displayed GUS expression in trichomes, but also in 360
other cell types, with a profile varying from line to line for a given reporter construct (data not 361
shown). This likely results from a position effect due to the random insertion of the T-DNA in 362
the plant cell genome. The genomic environment surrounding the integrated cassette 363
(structure of chromatin, presence of enhancers/silencers near the insertion site) is known to 364
alter the expression level and profile of transgenes (Kohli et al. 2010; Hernandez-Garcia and 365
Finer 2014). Between independent lines, and thus different insertion sites, this position effect 366
differs according to the proximal endogenous regulatory elements. 367
In conclusion, a key and unique feature of glandular trichomes is their ability to synthesize 368
and secrete large amounts of a limited panel of specialized metabolites. Taking advantage of 369
the pool of natural precursors to produce specific metabolites in glandular trichomes by 370
metabolic engineering would therefore be of high biotechnological interest. This requires the 371
availability of transcriptional promoters specifically active in these structures that could be 372
used to efficiently drive the expression of the transgenes coding for the enzymes needed to 373
implement the pathway in a cell-type specific way. In this respect, the identification of the 374
NtMALD1 and NtRbS-T1 promoters and their comparison with previously identified trichome-375
specific promoters are promising tools for expressing entire biosynthesis pathways in 376
glandular trichomes of N. tabacum. 377
379
Supplementary data
380Supplemental Fig. 1 Transcript levels of control genes in different organs of N. tabacum 381
Supplemental Fig. 2 Transcript levels of control genes in trichomes isolated from N. 382
tabacum leaves at different developmental stages 383
Supplemental Fig. 3 GUS activity in various tissues of N. tabacum transgenic lines. 384
Supplemental Table S1 List of primers used for RT-qPCR. 385
Supplemental Table S2 List of primers used to amplify the promoter sequences. 386
References
388Bienert MD, Delannoy M, Navarre C, Boutry M (2012) NtSCP1 from Tobacco Is an 389
Extracellular Serine Carboxypeptidase III That Has an Impact on Cell Elongation. Plant 390
Physiol 158:1220–1229. https://doi.org/10.1104/pp.111.192088 391
Bouvier F, Rahier A, Camara B (2005) Biogenesis, molecular regulation and function of plant 392
isoprenoids. Prog Lipid Res 44:357–429. https://doi.org/10.1016/j.plipres.2005.09.003 393
Choi YE, Lim S, Kim H-J, et al (2012) Tobacco NtLTP1, a glandular-specific lipid transfer 394
protein, is required for lipid secretion from glandular trichomes. Plant J 70:480–91. 395
https://doi.org/10.1111/j.1365-313X.2011.04886.x 396
Croteau R, Kutchan TM, Lewis NG (2000) Natural Products (Secondary Metabolites). In: 397
Buchanan B, Gruissem W, Jones R (eds) Biochemistry & Molecular Biology of Plants. 398
American Society of Plant Physiologists, pp 1250–1318 399
Ennajdaoui H, Vachon G, Giacalone C, et al (2010) Trichome specific expression of the 400
tobacco (Nicotiana sylvestris) cembratrien-ol synthase genes is controlled by both 401
activating and repressing cis-regions. Plant Mol Biol 73:673–85. 402
https://doi.org/10.1007/s11103-010-9648-x 403
Gershenzon J, Dudareva N (2007) The function of terpene natural products in the natural 404
world. Nat Chem Biol 3:408–414. https://doi.org/10.1038/nchembio.2007.5 405
Goderis IJWM, De Bolle MFC, François IEJA, et al (2002) A set of modular plant 406
transformation vectors allowing flexible insertion of up to six expression units. Plant 407
Mol Biol 50:17–27. https://doi.org/10.1023/A:1016052416053 408
Godornes C, Troy B, Molini BJ, et al (2007) Quantitation of rabbit cytokine mRNA by real-409
time RT-PCR. 38:1–7. https://doi.org/10.1016/j.cyto.2007.04.002 410
Gwak YS, Han JY, Adhikari PB, et al (2017) Heterologous production of a ginsenoside 411
saponin (compound K) and its precursors in transgenic tobacco impairs the vegetative 412
and reproductive growth. Planta 245:1105–1119. https://doi.org/10.1007/s00425-017-413
2668-x 414
Harada E, Kim J-AA, Meyer AJ, et al (2010) Expression profiling of tobacco leaf trichomes 415
identifies genes for biotic and abiotic stresses. Plant Cell Physiol 51:1627–1637. 416
https://doi.org/10.1093/pcp/pcq118 417
Hernandez-Garcia CM, Finer JJ (2014) Identification and validation of promoters and cis-418
acting regulatory elements. Plant Sci 217–218:109–119. 419
https://doi.org/10.1016/j.plantsci.2013.12.007 420
Horsch RB, Klee HJ, Stachel S, et al (1986) Analysis of Agrobacterium tumefaciens virulence 421
mutants in leaf discs. Proc Natl Acad Sci U S A 83:2571–2575. 422
https://doi.org/10.1073/pnas.83.8.2571 423
Huchelmann A, Boutry M, Hachez C (2017) Plant glandular trichomes: natural cell factories 424
of high biotechnological interest. Plant Physiol 175:6–22. 425
https://doi.org/10.1104/pp.17.00727 426
Kempinski C, Jiang Z, Bell S, Chappell J (2015) Metabolic engineering of higher plants and 427
algae for isoprenoid production. In: Schrader J, Bohlmann J (eds) Biotechnology of 428
Isoprenoids. Springer International Publishing, Cham, pp 161–199 429
Kirby J, Keasling JD (2009) Biosynthesis of Plant Isoprenoids: Perspectives for Microbial 430
Engineering. Annu Rev Plant Biol 60:335–55. 431
https://doi.org/10.1146/annurev.arplant.043008.091955 432
Kohli A, Miro B, Twyman RM (2010) Chapter 7 Transgene Integration, Expression and 433
Stability in Plants: Strategies for Improvements. In: C. Kole et al. (ed) Transgenic Crop 434
Plants. Springer-Verlag, Berlin, Heidelberg, pp 201–237 435
Lacerda ALM, Fonseca LN, Blawid R, et al (2015) Reference gene selection for qPCR 436
analysis in bipartite begomovirus interaction and validation in additional tomato-437
virus pathosystems. PLoS One 10:1–17. https://doi.org/10.1371/journal.pone.0136820 438
Lange BM, Ahkami A, Markus Lange B, Ahkami A (2013) Metabolic engineering of plant 439
monoterpenes, sesquiterpenes and diterpenes-current status and future opportunities. 440
Plant Biotechnol J 11:169–96. https://doi.org/10.1111/pbi.12022 441
Laterre R, Pottier M, Remacle C, Boutry M (2017) Photosynthetic Trichomes Contain a 442
Specific Rubisco with a Modified pH-Dependent Activity. Plant Physiol 173:2110–2120. 443
https://doi.org/10.1104/pp.17.00062 444
Livak KJ, Schmittgen TD (2001) Analysis of relative gene expression data using real-time 445
quantitative PCR and the 2-ΔΔCT method. Methods 25:402–408. 446
https://doi.org/10.1006/meth.2001.1262 447
Lu Y, Xie L, Chen J (2012) A novel procedure for absolute real-time quantification of gene 448
expression patterns. Plant Methods 8:1–11. https://doi.org/10.1186/1746-4811-8-9 449
Maliga P, Sz-Breznovits A, Márton L (1973) Streptomycin-resistant plants from callus culture 450
of haploid tobacco. Nat New Biol 244:29–30 451
Marienhagen J, Bott M (2013) Metabolic engineering of microorganisms for the synthesis of 452
plant natural products. J Biotechnol 163:166–178. 453
https://doi.org/10.1016/j.jbiotec.2012.06.001 454
Moses T, Pollier J (2013) Bioengineering of plant (tri) terpenoids: from metabolic 455
engineering of plants to synthetic biology in vivo and in vitro. New Phytol 200:27–43. 456
https://doi.org/10.1111/nph.12325 457
Navarre C, Sallets A, Gauthy E, et al (2011) Isolation of heat shock-induced Nicotiana 458
tabacum transcription promoters and their potential as a tool for plant research and 459
biotechnology. Transgenic Res 20:799–810. https://doi.org/10.1007/s11248-010-9459-5 460
Pottier M, Gilis D, Boutry M (2018) The Hidden Face of Rubisco. Trends Plant Sci 23:382– 461
392. https://doi.org/10.1016/j.tplants.2018.02.006 462
Sallaud C, Giacalone C, Töpfer R, et al (2012) Characterization of two genes for the 463
biosynthesis of the labdane diterpene Z-abienol in tobacco (Nicotiana tabacum) 464
glandular trichomes. Plant J 72:1–17. https://doi.org/10.1111/j.1365-313X.2012.05068.x 465
Saxena B, Subramaniyan M, Malhotra K, et al (2014) Metabolic engineering of chloroplasts 466
for artemisinic acid biosynthesis and impact on plant growth. J Biosci 39:33–41. 467
https://doi.org/10.1007/s12038-013-9402-z 468
Schilmiller AL, Last RL, Pichersky E (2008) Harnessing plant trichome biochemistry for the 469
production of useful compounds. Plant J 54:702–11. https://doi.org/10.1111/j.1365-470
313X.2008.03432.x 471
Van Agtmael MA, Eggelte TA, Van Boxtel CJ (1999) Artemisinin drugs in the treatment of 472
malaria: From medicinal herb to registered medication. Trends Pharmacol Sci 20:199– 473
205. https://doi.org/10.1016/S0165-6147(99)01302-4 474
van der Fits L, Deakin E, Hoge J, Memelink J (2000) The ternary transformation system: 475
constitutive virG on a compatible plasmid dramatically increases Agrobacterium-476
mediated plant transformation. Plant Mol Biol 43:495–502 477
van Herpen TWJM, Cankar K, Nogueira M, et al (2010) Nicotiana benthamiana as a 478
production platform for artemisinin precursors. PLoS One 5:e14222. 479
https://doi.org/10.1371/journal.pone.0014222 480
Wagner GJ, Wang E, Shepherd RW (2004) New approaches for studying and exploiting an 481
old protuberance, the plant trichome. Ann Bot 93:3–11. 482
https://doi.org/10.1093/aob/mch011 483
Wang B, Kashkooli AB, Sallets A, et al (2016) Transient production of artemisinin in 484
Nicotiana benthamiana is boosted by a specific lipid transfer protein from A. annua. 485
Metab Eng 38:159–169. https://doi.org/10.1016/j.ymben.2016.07.004 486
Wang E, Gan S, Wagner GJ (2002) Isolation and characterization of the CYP71D16 487
trichome-specific promoter from Nicotiana tabacum L. J Exp Bot 53:1891–1897. 488
https://doi.org/10.1093/jxb/erf054 489
Wang E, Wang R, DeParasis J, et al (2001) Suppression of a P450 hydroxylase gene in plant 490
trichome glands enhances natural-product-based aphid resistance. Nat Biotechnol 491
19:371–374. https://doi.org/10.1038/86770 492
Yoon JM, Zhao L, Shanks J V (2013) Metabolic Engineering with Plants for a Sustainable 493
Biobased Economy. Annu Rev Chem Biomol Eng 4:211–37. 494
https://doi.org/10.1146/annurev-chembioeng-061312-103320 495
Figure legends
497Fig. 1 Transcript levels in different organs of N. tabacum. Transcript levels were normalized 498
to the mean of those of NtATP2 and NtUBQ genes. Results are shown as mean ± SD of three 499
to five repeats. Different letters indicate significant differences according to a Kruskal-Wallis 500
test (p < 0.05) followed by a Tukey post hoc test 501
Fig. 2 Transcript levels in trichomes isolated from N. tabacum leaves at different 502
developmental stages. Transcript levels were normalized to the geometric mean of those of 503
NtUBQ, NtATP2, and NtACTIN genes. St: leaf developmental stage. Stage 1: leaf length < 2.5 504
cm; stage II: leaf length between 2.5 cm and 6.5 cm; stage III: leaf length between 6.5 cm and 505
15 cm; stage IV: leaf length > 15 cm. Results are shown as mean ± SD of three repeats. 506
Different letters indicate significant differences according to a Kruskal-Wallis test (p < 0.05) 507
followed by a Tukey post hoc test 508
Fig. 3 Absolute transcript levels at stage III of leaf development in N. tabacum. Absolute 509
transcript levels were determined as indicated in the Material and methods. Results are shown 510
as mean ± SD of three repeats. Different letters indicate significant differences according to a 511
Kruskal-Wallis test (p < 0.05) followed by a Tukey post hoc test 512
513
Fig. 4 Molecular constructs used to generate transgenic N. tabacum expressing the 514
GUSVENUS reporter gene under the control of trichome-specific promoters. The transcription 515
promoter regions of NtRbcS-T1 (MG493459.1), NtMALD1 (MG493458.1), NsCBTS2α 516
(HM241151.1), NtLTP1 (AB625593.1), NtCYP71D16 (AF166332.1), and NtCPS2 517
(HE588139.1) were amplified and cloned as described in the Material and methods 518
519
Fig. 5 GUS-VENUS activity in leaves and stems of N. tabacum transgenic lines. Venus 520
detection by confocal imaging and GUS staining were performed on transgenic lines 521
expressing GUS-VENUS under the control of the promoter region of NtMALD1 (a-c), 522
NtRbcS-T1 (d-f), NsCBTS2α (g-i), CPS2 (j-l, white arrowheads point to the labelling of short 523
glandular trichomes), NtCYP71D16 (m-o), and NtLTP1 (p-r). Left panels: 3D reconstruction 524
of leaf tissue expressing the VENUS reporter as detected by confocal microscopy. Green: 525
VENUS signal, magenta: chlorophyll autofluorescence. Middle panels: GUS staining in leaf 526
cross-sections. Right panels: GUS staining in stem cross-sections. Scale bars: 200 μm 527
0.00 0.02 0.04 0.06 0.08 1.00 0.02 0.04 0.06 0.08 1.00 0.00 0.00 0.02 0.04 0.06 0.08 1.00 0.00 0.02 0.04 0.06 0.08 1.00 0.00 0.02 0.04 0.06 0.08 1.00 R e la tiv e e xp re ss io n 0.00 0.02 0.04 0.06 0.08 1.00 NtCBTS2α NtCPS2 NtRbcS-T1 NtMALD1 NtCYP71D16 NtLTP1 R e la tiv e e xp re ss io n R e la tiv e e xp re ss io n R e la tiv e e xp re ss io n R e la tiv e e xp re ss io n R e la tiv e e xp re ss io n a d c c b a b c e d a c e d a b c e d a b c d cd a b b c b b b
Fig. 1 Transcript levels in different organs of N. tabacum. Transcript levels were normalized to the geometric mean of those of NtATP2, NtUBQ, and NtEF1α genes. Results are shown as mean ± SD of three to five repeats. Different letters indicate significant differences according to a Kruskal-Wallis test (p < 0.05) followed by a Tukey post hoc test
R e la tiv e e xp re ss io n R e la tiv e e xp re ss io n R e la tiv e e xp re ss io n St I St II St III St IV St I St II St III St IV St I St II St III St IV St I St II St III St IV St I St II St III St IV R e la tiv e e xp re ss io n R e la tiv e e xp re ss io n R e la tiv e e xp re ss io n St I St II St III St IV NtCBTS2α NtCPS2 NtRbcS-T1 NtMALD1 NtCYP71D16 NtLTP1 a b c a a b c a a b c a a a a a a b c a 0.00 0.50 1.00 1.50 2.00 2.50 3.00 3.50 4.00 4.50 a a b c 0.00 0.50 1.00 1.50 2.00 2.50 3.00 3.50 4.00 0.00 0.20 0.40 0.60 0.80 1.00 1.20 1.40 1.60 0.00 0.40 0.80 1.20 1.60 2.00 2.40 2.80 0.00 0.40 0.80 1.20 1.60 2.00 2.40 2.80 0.00 0.50 1.00 1.50 2.00 2.50 3.00 3.50 4.00 4.50
Fig. 2 Transcript levels in trichomes isolated from N. tabacum leaves at different developmental stages. Transcript levels were normalized to the geometric mean of those of NtUBQ, NtATP2, and NtACTIN genes. St: leaf developmental stage. Stage 1: leaf length < 2.5 cm; stage II: leaf length between 2.5 cm and 6.5 cm; stage III: leaf length between 6.5 cm and 15 cm; stage IV: leaf length > 15 cm. Results are shown as mean ± SD of three repeats. Different letters indicate significant differences according to a Kruskal-Wallis test (p < 0.05) followed by a Tukey post hoc test
Fig. 3 Absolute transcript levels at stage III of leaf development in N. tabacum. Absolute transcript levels were determined as indicated in the Materials and methods. Results are shown as mean ± SD of three repeats. Different letters indicate significant differences according to a Kruskal-Wallis test (p < 0.05) followed by a Tukey post hoc test 0 10 20 30 40 50 60 70 80 90 A b so lu te q ua nt ifi ca tio n a t S t III ( co p ie s/ p g o f R N A ) a b c d g h e f i j
Fig. 4 Molecular constructs used to generate transgenic N. tabacum expressing the GUSVENUS reporter gene under the control of trichome-specific promoters. The transcription promoter regions of NtRbcS-T1 (MG493459.1), NtMALD1
(MG493458.1), NsCBTS2α (HM241151.1), NtLTP1 (AB625593.1),
NtCYP71D16 (AF166332.1), and NtCPS2 (HE588139.1) were amplified and cloned as described in the Materials and methods
pNtRbcS-T1 (1993 pb) GUSVENUS coding sequence
pNtMALD1 (1974 pb) GUSVENUS coding sequence
pNsCBTS2α (985 pb) GUSVENUS coding sequence
pNtLTP1 (849 pb) GUSVENUS coding sequence
pNtCPS2 (1448 pb) GUSVENUS coding sequence
Fig. 5 GUS-VENUS activity in leaves and stems of N. tabacum transgenic lines. Venus detection by confocal imaging and GUS staining were performed on transgenic lines expressing GUS-VENUS under the control of the promoter region of NtMALD1 (a-c), NtRbcS-T1 (d-f), NsCBTS2α (g-i), NtCPS2 (j-l, white arrowheads point to the labelling of short glandular trichomes), NtCYP71D16 (m-o), and NtLTP1 (p-r, not trichome-specific). Left panels: 3D reconstruction of leaf tissue expressing the VENUS reporter as detected by confocal microscopy. Green: VENUS signal, magenta: chlorophyll autofluorescence. Middle panels: