UNIVERSITÉ DU QUÉBEC
INSTITUT NATIONAL DE LA RECHERCHE SCIENTIFIQUE
CENTRE – URBANISATION CULTURE SOCIÉTÉ
AN EXAMINATION OF CHILD PEDESTRIAN SAFETY: CROSSING
BEHAVIORS, ROAD ENVIRONMENT, AND RULE COMPLIANCE NEAR
PARKS IN MONTREAL, CANADA
Par
Mojgan RAFIEI
Maîtrise en étude urbaines
Mémoire présenté pour obtenir le grade de
Maître ès sciences, M.Sc.
Maîtrise en études urbaines
Programme offert conjointement par l’INRS et l’UQAM
Août 2018
© Mojgan RAFIEI, 2018
Ce mémoire intitulé
AN EXAMINATION OF CHILD PEDESTRIAN SAFETY: CROSSING
BEHAVIORS, ROAD ENVIRONMENT, AND RULE COMPLIANCE NEAR
PARKS IN MONTREAL, CANADA
et présenté par
Mojgan RAFIEI
a été évalué par un jury composé de
Mme Marie-Soleil CLOUTIER, directrice de recherche, Institut national de la recherche
scientifique
Mme Pham HIEN, examinatrice interne, UQAM
Mme Mariana BRUSSONI, examinatrice externe, UBC
ABSTRACT
In the past decades, physical activity of children has declined due to many reasons, such as unsafe roads, which can negatively influence parents’ attitudes toward allowing their children to spend time outdoors. Urban parks, as natural and outdoor places, can promote children’s physical activity and psychological health. However, child pedestrians' safety on roads next to parks has not been fully investigated. In order to fill this research gap, this study examines child pedestrians' safety considering four rule compliance measures: temporal, spatial and velocity compliance and visual search.
We employed a naturalistic approach to observe behaviors, road environment, and car interaction while children were crossing roads near parks. In this study, street crossings of 731 children were observed at 17 crosswalks around four parks in Montreal, Canada in the summer of 2017. Then, Chi-square tests were used to verify if the individual, situational, behavioral, and road environment characteristics are significantly associated with rules compliance. These characteristics were explored through mixed-effect logistic regression with the same set of independent variables. Our results showed that parental close supervision, stopping at the curb before crossing, and the pedestrian countdown display had positive association with rule compliance. Moreover, about 50% of children started crossing at the same time as the adult companion. In the remaining group, more rule violations were observed when the adult initiated the crossing. As for effects of vehicles interacting with child pedestrians, a mixed impact on four rule compliance was observed: more spatial compliance and visual search, but less temporal and velocity compliance.
The current study outcomes can be used to provide safer road environment near urban parks. In this regard, longer crossing signal and pedestrian countdown display at traffic lights are quite advantageous.
Keywords: road traffic safety, crossing behavior, child pedestrian, rule compliance, intersection, urban parks
RÉSUMÉ
L'activité physique des enfants a diminué dans la dernière décennie pour de nombreuses raisons, notamment les routes dangereuses qui empêchent les parents de laisser leurs enfants jouer à l’extérieur. En parallèle, nous savons que les parcs urbains peuvent promouvoir l’activité physique et la santé mentale des enfants. Pourtant, peu de travaux de recherche se sont intéressés à la sécurité routière des enfants piétons à proximité des parcs. C’est pourquoi la présente étude examine leur sécurité en tenant compte de la conformité aux règles relatives aux piétons.
L’approche naturaliste a été adoptée afin d’observer les comportements des enfants, l'environnement routier et les interactions avec les voitures durant la traversée. Les tests Khi-deux ont été réalisés pour mettre en évidence les caractéristiques individuelles, situationnelles, comportementales et de l’environnement routier associées à la conformité aux règles. Ces caractéristiques ont été analysées à l’aide des modèles de régression logistique à effets mixtes. Les résultats ont montré que la supervision des adultes, s'arrêter au bord du trottoir avant de traverser et la présence d'un compte à rebours sont positivement associées à la conformité aux règles. Environ 50% des enfants ont commencé à traverser en même temps que le compagnon adulte. Dans le groupe restant, plus de violations de règles ont été observées lorsque l'adulte a initié la traversée. L’interaction piéton-voiture a eu un impact mitigé sur la conformité aux quatre règles, ce qui a eu pour effet d’améliorer la conformité spatiale et la recherche visuelle, mais de réduire la conformité temporelle ainsi que la vélocité.
Nos résultats pourraient être utiles pour les municipalités désirant améliorer la sécurité des enfants autour des parcs urbains. À ce titre, allonger les temps de traversée et ajouter des décomptes numériques aux intersections avec feux semblent avoir un effet positif en ce sens.
Mots-clés : sécurité routière, comportement de traversée, conformité des enfants piétons, intersections, parcs urbains.
ACKNOWLEDGEMENTS
First of all, I would like to appreciate my supervisor, Professor Marie-Soleil Cloutier for her motivation, knowledge, patience, and academic and financial supports. She helped me during every single stage of my thesis which could not come to end without her everyday support. I learnt a lot from her valuable comments and informative discussions. I also appreciate her for letting me attend two conferences that gave me many opportunities.
I acknowledge LAPS for providing me a peaceful atmosphere and great tools for conducting a productive research. Moreover, my deep thanks go to my fellow lab mates at LAPS, especially Wiem for all her helps, supports, and helpful discussions. I acknowledge INRS for the financial support and the great Professors and employees, especially Wassila Foul and Marie-Ève Dugas. Finally, I sincerely thank my dear father, mother, each of my sisters, and my brother for their encouragement and supports throughout my life. I especially thank Rezvan, her spouse Alireza, my nephew Radeen, my friends Amir, Youssef, and all other people helped me during these years.
TABLE OF CONTENTS
List of tables ... x
List of figures ... x
List of abbreviations ... xii
Introduction ... 1
CHAPTER 1: Background: children active transportation, safety, and importance of urban parks ... 3
1.1 Road insecurity and decline in children active transportation ... 3
1.2 Safety concept and unintentional injuries ... 4
1.2.1 Safety concept ... 4
1.2.2 Unintentional Injuries (UI) in children ... 6
1.3 Urban parks and children’s safety ... 7
1.3.1 Safe route to parks for children ... 8
1.4 Research question and conceptual framework ... 9
CHAPTER 2: Literature review: child pedestrian injuries and rule compliance ... 11
2.1 Factors influencing child pedestrian injury ... 11
2.1.1 Individual demographics: children’s age and gender ... 11
2.1.2 Situational Characteristics while walking/crossing as a pedestrian ... 13
2.1.3 Behavior characteristics ... 16
2.1.4 Road environment characteristics ... 19
2.2 Pedestrian rule compliance ... 22
2.2.1 Temporal crossing compliance (compliance with signal timing at signalized intersections) ... 23
2.2.2 Spatial compliance (crossing in/at the crosswalk) ... 23
2.2.3 Velocity (crossing speed) ... 24
2.2.4 Visual search (before crossing) ... 24
CHAPTER 3: Methodology ... 26
3.1 Operative framework ... 26
3.2.1 Park selection ... 28
3.2.2 Selection of intersections and crosswalks ... 31
3.3 Creation of the data collection tools: Direct observation of child pedestrian behavior while crossing ... 40
3.3.1 Individual and situational factors ... 40
3.3.2 Behavioral factors ... 41
3.3.3 Observation grid for road environment ... 42
3.3.4 Observation form for vehicle-pedestrian interactions ... 43
3.4 Data collection ... 44
3.5 Data (re)coding and analysis ... 45
3.5.1 Independent variables ... 46
3.5.2 Dependent variables ... 47
3.5.3 Statistical analyses ... 48
CHAPTER 4: Results: an examination of child pedestrian rule compliance at crosswalks around parks in Montreal, Canada ... 51
4.1 Abstract ... 52
4.2 Introduction ... 53
4.3 Factors associated with child pedestrian safety and compliance ... 54
4.3.1 Individual characteristics ... 54
4.3.2 Situational characteristics ... 54
4.3.3 Behavioral characteristics ... 55
4.3.4 Road environment characteristics ... 55
4.4 Methods ... 57
4.4.1 Site selection ... 57
4.4.2 Observation protocol... 58
4.4.3 Crosswalks characteristics ... 58
4.4.4 Retained individual, situational, and behavioral categories ... 61
4.6 Statistical analyses... 63
4.7 Results ... 64
4.7.1 Bivariate analysis ... 64
4.7.2 Mixed-effects logistic models ... 67
4.8 Discussion ... 69
4.8.1 Age: the only significant individual factor ... 69
4.8.2 Adult companion and car interaction affect child pedestrians rule compliance ... 69
4.8.3 Stopping at the curb and looking at road-related elements: two significant factors before crossing ... 70
4.8.4 Road elements: many significant factors... 70
4.8.5 What role for the park as a destination ... 71
4.9 Conclusion ... 71
CHAPTER 5: Discussion ... 73
5.1 Age category: the only significant individual factor ... 73
5.2 Adult companion and car interaction affects child pedestrians rule compliance ... 73
5.3 Stopping at the curb and looking at road-related elements: two significant factors before crossing ... 74
5.4 Road elements: many significance factors ... 74
5.5 What role for the park as destination? ... 75
5.6 Limitation of the study ... 76
Conclusion ... 77
Appendix 1: Behavior observation form ... 78
Appendix 2 : Road environment observation form ... 80
Appendix 3 : Vehicle interaction observation form ... 82
Appendix 4 : Synthése du mémoire en francais... 83
Introduction ... 83
Méthodologie ... 86
Résultats ... 90
Conclusion ... 96
LIST OF TABLES
Table 3.1 Typology of urban parks on the island of Montreal ... 28
Table 3.2 Summary of selected crosswalks around parks ... 31
Table 3.3 Composite variables of rule compliance ... 48
Table 3.4 Retained independent variables in the multivariate model ... 50
Table 4.1 Crossing characteristics and number of crosswalks ... 59
Table 4.2 Retained individual, situational and behavioral categories ... 62
Table 4.3 Number and percentage of outcomes for rule compliance indicators ... 63
Table 4.4 Descriptive statistics ... 66
Table 4.5 Mixed-effects logistic models of rule compliance (Odds ratios) ... 68
LIST OF FIGURES
Figure 1.1 Two dimensions of safety ... 4Figure 1.2 Two links between safety and health of children ... 5
Figure 1.3 The system approach to road safety ... 6
Figure 1.4 Operative framework employed in the current study ... 10
Figure 2.1 Conceptual model of child pedestrian safety with emphasis on the supervision ... 13
Figure 2.2 Levels in pedestrian behavior ... 17
Figure 3.1 Operative framework used in the current study ... 26
Figure 3.2 Selected boroughs... 27
Figure 3.3 Different steps in choosing the parks ... 29
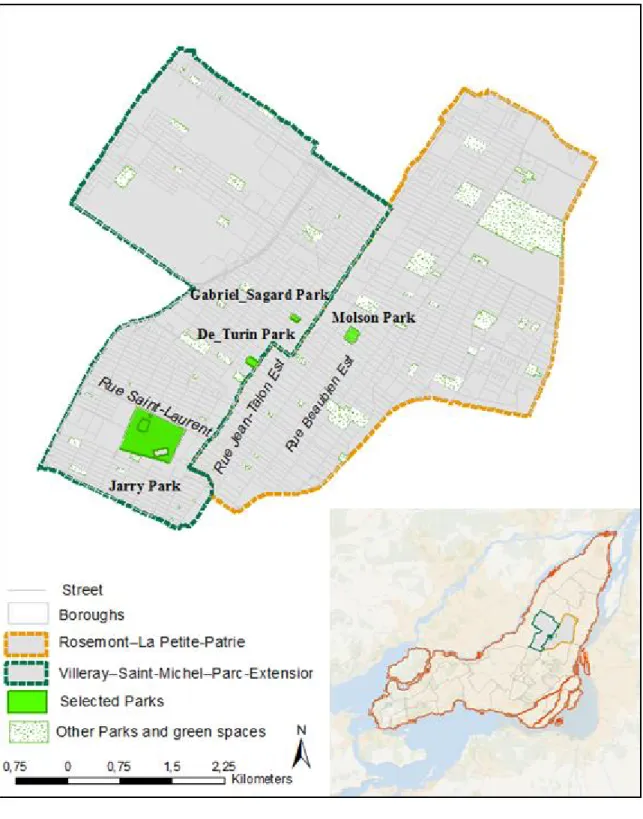
Figure 3.4 Location of Selected Parks ... 30
Figure 3.5 Selected crosswalks around Jarry Park ... 32
Figure 3.6 Selected crosswalks around Jarry Park ... 33
Figure 3.7 Selected crosswalks around De-Turin Park ... 34
Figure 3.8 Selected crosswalks around De-Turin Park ... 35
Figure 3.9 Selected crosswalks around Molson Park ... 36
Figure 3.10 Selected crosswalks around Molson Park ... 37
Figure 3.11 Selected crosswalks around Gabriel-Sagard Park ... 38
Figure 3.12 Selected crosswalks around Gabriel-Sagard Park ... 39 Figure 3.13 Individual and Situational factors in observation grid for crossing behavior . 41
Figure 3.14 Behavior factors in observation grid for crossing behavior ... 42
Figure 3.15 Road environment characteristics ... 43
Figure 3.16 Vehicle-Pedestrian interaction variables ... 44
Figure 3.17 Observation Zone ... 45
Figure 4.1 Location of selected park in Island of Montreal ... 57
LIST OF ABBREVIATIONS
AMT Agence Métropolitaine de TransportCCMTA Canadian Council of Motor Transportation Administrators CMVTC Canadian Motor Vehicle Traffic Collision
CIHR Canadian Institute of Health Research
ESSAIM Environnement scolaire sécuritaire et analyse des interventions municipales INRS Institut National de la Recherche Scientifique
GP RED GreenPlay Research, Education, and Development MAPISE la Marche À Pied pour les SEniors
MUTCD Manual on Uniform Traffic Control Devices NICE National Institute for health and Care Excellence NRPA National Recreation and Park Association
QHSC Quebec Highway Safety Code
RPP Rosemont-La Petite-Patrie SAS Statistical Analysis System
SRTP Safe Route to Park
SWOV Institute for Road Safety Research
UI Unintentional Injuries
VRU Vulnerable Road Users
VSP Villeray-Saint Michel-Parc extension WHO World Health Organization
INTRODUCTION
Regular physical activity is necessary for children’s health because it decreases the incidence of chronic disease and influences children’s energy level. Children with the adequate physical activity are more likely to have a healthy lifestyle in the future, and its benefits are seen over their lifespan. For children who live within a reasonable walking distance from a school, park, and playground, active transport can be a great opportunity for them to have physical activity on a regular basis. Since the benefits of children’s physical activity affect their lifespan, a decrease in this type of activity is a major concern for children around the world. However, it was reported by Tremblay, Brownrigg and Deans (2008) that children and young Canadians spend less time to walk to and from their destination, such as school, parks, and extracurricular activity spots as significant sources of physical activity. This is partly attributed to the road safety concerns making the parents drive them to destinations.
Children are one of the major groups in society that face road risks. According to a Safe Kids Canada report (2007), one of the most important death causes for children under 14 years old was pedestrian injuries. More specifically, about 18% of the deaths were for children between five and nine years old as a result of a collision with motor vehicles. Previous research mainly focused on the safety of child pedestrians around their schools, as the school was their main destination. Although parks and playgrounds are also known as frequent destinations for children especially in urban settings, few studies examined children’s safety on the road around parks.
The current study aims to fill this gap regarding child pedestrian safety via examination of individual, situational, behavioral and road environment characteristics determining whether children comply with various road safety rules during street crossings towards parks. Hence, the overall objective of this study is to examine child pedestrian's safety around parks by considering four rule compliance measures: temporal, spatial and velocity compliance, and visual search. This thesis is organized into five chapters. The first chapter explores the basic safety concept, unintentional injuries (UI) of children, importance of urban parks, and safe routes to parks for children. This chapter presents various elements including the research question, objectives, and the conceptual framework. The second chapter explains in more details influential factors on child pedestrian injury and various pedestrian rules compliance.
The third chapter presents the methodological approach used to carry out the present study, including the study areas, the creation of data collection tools, and the methods of analysis. The fourth chapter is a manuscript submitted to the Journal of Environmental Psychology which presents the results of predictive models of rule compliance. Finally, the last chapter includes the discussion on the results using the factors that could explain child pedestrian compliance with various road safety measures. This chapter also provides the limitation of the current study and the conclusion.
CHAPTER 1: BACKGROUND: CHILDREN ACTIVE TRANSPORTATION,
SAFETY, AND IMPORTANCE OF URBAN PARKS
1.1 Road insecurity and decline in children active transportation
In many developed countries, one hour of physical activity per day has been the suggested norm for children (Carver, Timperio and Crawford 2008; Tremblay et al. 2016). Since many children seem to fail to accomplish this daily prescription (Weiler et al. 2014), any opportunity to stay active should be explored. For instance, time spent outdoors leads to an increase in the regular physical activity of children, which can decrease the chances of chronic health problems such as obesity (Bouchard, Blair and Haskell 2007). Sallis et al. (2004) stated that active transportation is another way of getting those daily minutes of physical activity.
Routine travel in the form of commuting to school offers opportunities for walking at an early age for students and their parents (Bouchard, Blair and Haskell 2007). However, despite all the benefits of the physical activity, many parents today drive their children to schools, parks, and playgrounds (Tremblay, Brownrigg and Deans 2008). This is reflected in recent statistics in Canada where active transportation decreased from 25% to 19% between 1998 and 2005 (Turcotte 2008). In the Montreal region, a similar decrease in the active transportation from 45% to 34% between 1993 and 2003 can be seen among of children 6–12 years old (L’Agence Métropolitaine de Transport 1998,2003).
High traffic-risk perception is one of the reasons leading parents to using other types of transportation to school for their children (Cloutier, Bergeron and Apparicio 2011), which reduces children’s opportunities to be physically active. Other examples illustrate this risk perception: in New Zealand, parents are worried about their children mostly due to the road safety, personal injuries, stranger danger, and bullying (Carver, Timperio and Crawford 2008). Another study by Gielen et al. (2004) in Maryland, USA, showed that about 70% of parents limited their children from playing outdoors because of danger associated with cars and trucks. Furthermore, for most English children between 9 and 11 years old, the important concern was safety on main roads (Matthews 1995). To some extent, road insecurity while crossing streets might be a good reason for parents and children to avoid walking to their destinations for safety reasons, either real or perceived.
1.2 Safety concept and unintentional injuries
1.2.1 Safety conceptAccording to the first international conference of World Health Organization (WHO) on injury prevention and control, safety is the control of those hazards leading to physical and psychological harm in order to preserve individual and community health; all people need safety to achieve their goals in life (World Health Organization 1989). Following this idea, safety should be seen as a fundamental human right and should be equal for all individuals and communities (World Health Organization 1989). In other words, safety as a basic need of humans is a necessity to raise the level of health and the social welfare of societies (Svanström 1999).
Another concept introduces safety as a dynamic process in terms of safety promotion (Maurice et al. 1997). The goal of safety promotion is to achieve optimum conditions of safety that are the ultimate requirement of human beings. Maurice et al. (1997) implied that accidents not only were not uncontrolled events, but also could be avoided once the risk factors of an activity were elucidated. This is in contrast to the concept of safety that states that accidents are uncontrolled occurrences leading to individual’s harm and injury (World Health Organization 1989).
Maurice et al. (1997) stated that safety consists of two different dimensions (Figure 1.1): one is objective which is evaluated by behavior and environment parameters; the other is subjective, which is based on the feeling of safety or insecurity in the society. Forde (1993) believed that both dimensions affect each other, and all societies should adapt their safety promotion considering these components. To provide two-way and active relations between objective and subjective dimensions, one should recognize and evaluate the problems and plan for interventions (Maurice et al. 1997). In this figure and the other ones come afterwards, the arrows show causal relations.
Figure 1.1 Two dimensions of safety
Maslow (1968) introduced the concept of safety as a psychological need of humans to improve their health. He stated that behaviors and environmental conditions are another items affecting the safety and health of a society. According to Maslow’s thoughts, health as an outcome of the level of safety would be determined by behavior and environment. As depicted in Figure 1.2, children’s behaviors and the road environment resulted in the child pedestrian safety, and consequently the children’s health.
Figure 1.2 Two links between safety and health of children
Source: inspired by Maslow (1968)
Pedestrians are Vulnerable Road Users (VRU), this term applies to those who are at risk in traffic more than others. The Institute for Road Safety Research (SWOV) suggested three criteria to distinguish VRU from other road users: the absence of a protective “shell” in traffic to protect against kinetic energy (e.g. pedestrians, cyclists, and to some extent, motorcyclists); task capability (e.g. children and older adults); and resilience in case of injuries (e.g. older adults and people with disabilities) (Hakkert and Braimaister 2002). Because of these criteria, the injury and death risk associated with each transport mode is unequal. A small, light, slow pedestrian such as a child cannot rapidly absorb the kinetic energy of a heavy vehicle moving without sustaining severe injury, and this is why we should prevent those collisions through a systematic approach. Historically, pedestrians are important road users who are not considered enough in the improvement of road user safety (Canadian Motor Vehicle Traffic Collision 2013). The safe system approach developed in Europe to tackle the road injury burden stresses the need to act on many levels at the same time for safe speeds, safe vehicles and safe roads and roadsides (Figure 1.3). In the system approach, humans are found to be vulnerable to injury, and it is believed that a safe road traffic system could significantly reduce the human vulnerability (World Health Organization 2009). Accordingly, evidence-based research supports built environment interventions of any type as long as they are locally appropriate, and suggests not to rely solely on educational interventions. The role of education is to generate public support and compliance with more effective built environment interventions, but not to stand alone as a solution(Wu et al. 2007).
Figure 1.3 The system approach to road safety
Source: CCMTA (CCMTA 2013)
1.2.2 Unintentional Injuries (UI) in children
The National Institute for health and Care Excellence (NICE) (2016) studied injuries in children under 15 years old at home and used the term Unintentional Injury (UI) instead of accidents. UI was also used by Davis and Pless (2001) to emphasize that the injuries are usually predictable and preventable. NICE (2016) reported that the possibility of unintentional injuries occurrence depends on several factors: individual characteristics such as age, behavior characteristics such as risk taking, and the environment factors. These factors can be considered as effective parameters to predict the children's injuries.
Unintentional injuries are the main reason for the hospitalization and death of children, particularly for child pedestrians (Peden 2008; Turner et al. 2004). Injuries in child pedestrians younger than 14 years represent about 12% of all injuries leading to death (CCMTA 2013). Encountering child pedestrians and motor vehicles are the most common reasons for fatality and injuries in young ages in the most of industrialized countries (Meir, Oron-Gilad and Parmet 2015). In Canada, between 1994 and 2003, about 56 child pedestrians under the age of 14 years died every year, and about 780 in the same age category were hospitalized with serious injuries (Safe Kids Canada 2007). According to Safe Kids Canada (2007), about 70% of the mortality cases and 50% of those
suffering from serious injuries were reported where there was no form of traffic control. This report also stated that for child pedestrians between five and nine years old, those injuries leading to death are due to motor vehicle accidents, and injuries of pedestrians among 10 and 14 years old are possibly related to risk taking and inattention to vehicles (Safe Kids Canada 2007). Another study for the period between 2003 and 2012 for Canadian children under 14 years old stated that 12% of UI leading to death happened as a result of child pedestrians being struck by a vehicle (Parachute Canada 2016).
1.3 Urban parks and children’s safety
Urban parks play a key role in the urban landscape, environment, and ecological services. These parks are important to improve the social, physical, and psychological conditions of citizens, including children (Chiesura 2004; Bedimo-Rung, Mowen and Cohen 2005; Ho et al. 2003). One of the major consistent predictors of children’s physical activity is the time spent outdoors, and parks provide the best settings for it (Ho et al. 2003). Children’s outdoor play, after school gives them a balanced life, because of the connections they build with nature. Although children's skills, autonomy, and creativity increase by learning how to work with facilities in playgrounds (Alberta Recreation and Park Association 2010), Herrington and Brussoni (2015) stated that today’s boring and over-controlled playgrounds are among the places that are least open to autonomy and creativity, particularly if kids are supervised.
Neighborhood characteristics surrounding parks, their accessibilities, safety perceptions (not only about the roads but also about attacks), and aesthetics influence the use of parks by nearby residents (Bedimo-Rung, Mowen and Cohen 2005). In contrast, the most common barriers to using parks for all ages are personal safety concerns, long distance between home and park, and poor quality of park facilities (Scott and Munson 1994; Cordell et al. 1999).
Reviewing the previous research concerning children and urban parks showed that they have been mainly carried out in two major streams: those looking at the health benefits of using parks and those looking at reasons to visit them (or not), which is the scope of the current study.
1.3.1 Safe route to parks for children
Parks and playgrounds are the most important destinations of children after school (Timperio et al. 2004). Despite this fact, few research studies target the safety of roads near parks compared to those on safety and quality of facilities in the parks (Allen et al. 2013), or on accessibility and equity in their spatial distribution (Reyes, Páez and Morency 2014). This study will focus on those research that address safe routes to parks. They provide useful tools and planning guidelines but some have research-based evidence.
National Recreation and Park Association (NRPA) (2016) employed a framework called "Safe Routes to Parks" to assess if policies and practices support safe and equitable access to parks for all users including children. They identified and prioritized parks based on demographic, traffic, health, and location information. Then, these data were used to suggest design safety factors on streets within and leading to parks, including signs and signals, traffic calming devices, marked crosswalks, and bike lanes.
The Safe Routes to Play (SRTP) created by GP RED (GreenPlay Research, Education, and Development) is another planning process to increase safe routes to play for children focusing on active transportation, such as walking and biking, implemented in Lebanon, New Hampshire. According to the parent survey results, within their neighborhood, children usually tended to either walk or bike to playgrounds, but when it came to playing outside their neighborhood, the majority of them preferred to use a vehicle. In this regard, parents stated some reasons for not using active transportation, in order of importance: lack of pathways, road traffic, distance, speed of traffic along route, safety at intersections and crossings, and violence or crime (Research Education and Development 2014).
Ferenchak and Marshall (2017) studied child pedestrians' safety on roads around parks and schools. They considered the urban locations where child pedestrians were facing fatal collisions with vehicles. Their results demonstrated that the risk around parks was higher than that around schools in all of their case studies. They suggested that, in addition to schools, parks are important locations to focuseon in the field of child pedestrian fatalities.
1.4 Research question and conceptual framework
The literature reviews have demonstrated that little attention has been paid to the road safety conditions around parks. Most of the studies referred to the safety of equipment and facilities in the park, proximity, and accessibility of the park to children. It is surprising that there are few studies on safety of children walking to parks and playgrounds. As child pedestrians' behaviors play a crucial role in their safety while crossing streets, this research concerns the factors with respect to child pedestrians affecting their safe crossing. Hence, the main question of this study is: which characteristics are related to the safe crossing behavior of child pedestrian by considering rule compliance near parks?
In the past two decades, ecological models have been widely used by researchers to guide behavior of populations in order to reduce potential health problems (Norman et al. 2006). Sallis et al. (1993)believed that the health and well-being of children resulted from interactions between behavioral, environmental, social, family, and public policy factors. In order to evaluate this belief, they employed an ecological model to assess children’s physical activity behaviors, such as walking to school or using a park.
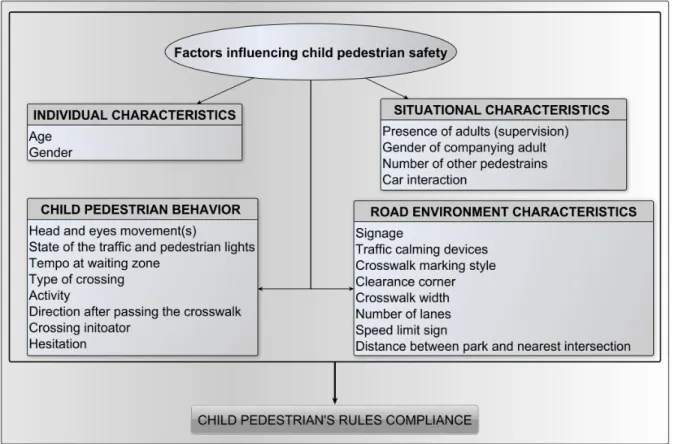
Inspired by above-mentioned studies, we would like to introduce our own view in order to answer our research question. Figure 1.4 highlights our operative framework presenting the individual, situational, behavioral, and road environmental characteristics. We expected that these four groups of factors would be associated with the likelihood of child pedestrian’s rule compliance, which in turn influence crossing safety. It is worth mentioning that in our operative framework, compliance to pedestrian road rules and child's crossing safety are considered at the same level of pedestrian safety, as also pointed out by Şimşekoğlu and Akin and Sisiopiku (Şimşekoğlu 2015; Akin and Sisiopiku 2007). In this regard, Şimşekoğlu (2015) stated that low level of compliance with road rules and unsafe behaviors from either drivers or pedestrians are the main reasons for the low level of pedestrians' safety. In other words, appropriate usage of crosswalks (complying with rules) by pedestrians and motor vehicles users increases the safety of pedestrians (Akin and Sisiopiku 2007). The detailed description of our framework is provided in Chapter 3.
Figure 1.4 Operative framework employed in the current study
CHAPTER 2: LITERATURE REVIEW: CHILD PEDESTRIAN INJURIES
AND RULE COMPLIANCE
Now that we have stated our research question, the second chapter will review the literature on two aspects: factors influencing child pedestrian injuries and rule of compliance, which are the two main elements of our question.
2.1 Factors influencing child pedestrian injury
Many studies in the last decades investigated the factors influencing the safety of children on roads. In fact, pedestrian injury risk has multiple complex explanatory factors, such as human and environmental ones (Cinnamon, Schuurman and Hameed 2011). With regards to the presence of a variety of risk factors influencing the safety of children, Fuselli et al. (2012) stated that a great number of children and young people’s injuries are preventable. In addition, Desapriya et al. (2011) stated that child pedestrian fatalities could be highly preventable by control and modification of risk factors related to behavior, social, and environmental characteristics. Because injuries remain the leading cause of children’s and youths’ death and disability, prevention must be incorporated into strategies aimed at improving child’s health (Yanchar et al. 2012).
Road traffic injuries involving children are known to be a consequence of the interaction of a variety of factors (Petch and Henson 2000). Four categories sum up most of the main influential factors on child pedestrian injury risk: individual demographics, situational, behavioral, and road environment characteristics (Schuurman et al. 2009; Rosenbloom, Ben-Eliyahu and Nemrodov 2008; Wazana et al. 1997). These factors are presented in more details in the following sections.
2.1.1 Individual demographics: children’s age and gender
Demographic characteristics such as age, gender are known as predictors of child pedestrian injuries (Assailly 1997; Parachute Canada 2016; Schieber Richard and Vegega Maria 2002; Schuurman et al. 2009). According to a study by Connelly and Isler (1996) based on international road accident statistics, younger child pedestrians are more at risk than older ones. Children between five and seven years old are at a higher risk in Britain, while New Zealand, the United States, and Canada have the highest estimated rate of accidents for five to nine years old children.
Age matters for two reasons: Firstly, it is important to perceive what is significant in the surroundings (Bolstad and Hess 2000), and the awareness of what is happening around a person is related to experience (Bolstad 2001). Hence, younger children, with lack of adequate knowledge and experience, are less competent in traffic when compared with older ones (Dunbar, Hill and Lewis 2001; Whitebread and Neilson 2000). Secondly, crossing the street includes complex processes and behaviors, which are not developed in young children (CCMTA 2013). Younger children’s ability to recognize safe behaviors in road crossing starts to develop from about six to ten years old, following their cognitive development (Oxley et al. 2005). In other words, older children can avoid the errors leading to injury because of a better understanding of road issues (Rosenbloom, Ben-Eliyahu and Nemrodov 2008).
According to a study by Schieber and Vegega (2002), children’s ability to be aware of traffic signs and simple traffic rules are determined by their cognitive development level. Perceptual development defines children’s abilities to diagnose oncoming car speed, and to visually pay attention to the environmental elements. Due to the lack of cognitive ability and perception at a younger age, children are more at risk (Dunbar, Hill and Lewis 2001; Whitebread and Neilson 2000). In other words, there are some factors that jeopardize children in roads: they might be not able to correctly evaluate traffic situations; their decisions might be not followed by an appropriate behavior which is common in their age group; and they might inappropriately react to traffic situations (Rosenbloom, Ben-Eliyahu and Nemrodov 2008). Hence, children more than other pedestrians need to cross where roads are safer, where we give them sufficient time to cross before vehicles arrive, and where traffic situation is easy to respond to (Te Velde et al. 2005). Boys (and men), no matter how old they are, tend to exhibit more risky behaviors, in part because they have more confidence in their ability to deal with accidents (Granié 2007).Two factors, higher risk exposure and behavioral differences, contribute to a higher number of pedestrian accidents involving boys (Assailly 1997). Some explanations from previous studies, illustrated by Barton and Schwebel (2007), explain the gender differences in injury rates by the boys’ tendency to exhibit more uncontrolled behavior, and a higher chance of repeating risky behaviors compared to girls. In other words, since boy pedestrians have a tendency to be less attentive to the road rules than girls (Granié 2007), often the rate of injuries and fatalities among boys are higher than for girls (Connelly and Isler 1996).
2.1.2 Situational Characteristics while walking/crossing as a pedestrian
Situational factors while crossing, such as parental supervision, have an influence on safety and compliance of pedestrians (Cinnamon, Schuurman and Hameed 2011). Therefore, situational factors considered in the current study include presence of adults (supervision), adults' gender, presence of other pedestrians, occurrence of a child pedestrian-vehicle interaction, and presence of parked cars within crosswalks.
A. Adult Supervision
Road supervision by parents could prevent most injuries among young children, and the absence of or delinquency in supervision could lead to a variety of child pedestrian injuries (Morrongiello 2005). In other words, parental supervision performs the role of children protector from the pedestrian injury risks (Schwebel, Davis and O’Neal 2012), because accompanying adults can intervene when the child behaves dangerously in a pedestrian environment (Barton and Schwebel 2007). Figure 2.1 highlights a dynamic process including environment and child variables shaped by situational factors determining the safety of child pedestrians. “Caregiver” (supervisor) was also added to this model by Morrongiello al. (2005) as the most effective factor to reduce child injuries.
Figure 2.1 Conceptual model of child pedestrian safety with emphasis on the supervision
Source: inspired by Morrongiello et al. (2005)
Since children are normally under the supervision of parents (depending on their age and culture), parental factors have been known for a long time as important factors in examining childhood
pedestrian injuries (Lam 2001). However, as stated by Schwebel, Davis and O’Neal (2012), the positive influence of parental supervision on child pedestrians is not straightforward. For instance, some previous studies stated that children are less likely to run while holding hands with an adult companion (Fu and Zou 2016; Granié 2007; van der Molen 1982). Similarly, the study by Zeedyk and Kelly (2003) shows that the majority of adult-child pairs waited for the next green light before crossing. On the contrary, another study pointed out that the presence of adults did not have an influence on the decrease of some critical behaviors, including not stopping before crossing, and not looking before crossing (Rosenbloom, Ben-Eliyahu and Nemrodov 2008). Also, when children are crossing street with adults, both girls and boys exhibit the same behavior, except for holding hands: more adults took a girl’s hand than a boy’s (Zeedyk and Kelly 2003).
B. Gender of adult companion
Previous studies have stated that gender differences were related to the level of risk taking for adult pedestrians (Tom and Granié 2011; Rosenbloom 2009; Koh, Wong and Chandrasekar 2014). Also, much research with a focus on pedestrian’s gender has shown that risky behavior and attitude are more common factors in males, and they have no relation to age (Rosenbloom and Wolf 2002; Harré, Brandt and Dawe 2000). Thus, male pedestrians have more tendency to violate rules than do females (Rosenbloom, Nemrodov and Barkan 2004). In this regard, Bergeron et al.’s (1998) study showed that, in the City of Montreal, the rate of women’s compliance with road signs and markings is about 10% higher than that of men’s.
C. Presence of other pedestrians
When pedestrians cross a street, their surrounding environment might include the presence of other pedestrians. Sucha, Dostal and Risser (2017) stated that one of the most common situations experienced by a pedestrian was the “presence of other pedestrians” while crossing on marked crosswalks. The question then is to know whether this makes a difference in a pedestrian’s behavior and decision to cross, and the answer is not straightforward: there are contradictory results showing positive and negative influence of other pedestrians on road crossing behavior (Havard and Willis 2012; Yagil 2000). On one side, there is the “safety in numbers” hypothesis made by Jacobsen (2003) and (2015) stating that increase in the number of pedestrians leads to a decrease in the number of injuries (Geyer et al. 2006). Rosenbloom (2009) found that the
presence of other pedestrians increases the rule compliance when compared with that of a lone pedestrian. The same study also showed that illegal behavior of a pedestrian did not have an impact on the behavior of others. Moreover, Lachapelle and Cloutier (2017) depicted that being in larger groups increases the chance of finishing their crossing on time for adult and senior pedestrians.
On the other side, Faria, Krause and Krause (2010) found that, if nearby pedestrians started to cross, a pedestrian was 1.5–2.5 times more likely to cross as well (regardless of the rule compliance). Similarly, Zhou et al. (2011) stated that pedestrians in a group had less tendency to look at traffic signals than did single or paired pedestrians. In addition, when pedestrians were crossing in groups, their walking speed tended to be slower (Carey 2005; Zhang 2012). However, these results are coming from research on adult pedestrians, and it is not clear how the relation would be for child pedestrians.
D. Pedestrian-vehicle interaction
The term interaction usually refers to an event where, without any collision, the paths of both a vehicle and a pedestrian intersect while they are still on the roadway (Trozzi, Manley and Kasparias 2015). As conflicts lead to more collisions (Cloutier, Lachapelle and Howard 2018; Sacchi and Sayed 2016), the occurrence of such interaction may alter the trajectory and which may in turn lead to more collisions (Cloutier et al. 2017; Wazana et al. 1997).
Interaction for two road users can be broadly defined as the presence of two road users at an intersection in nearness in time and place so that one of them affects the other (De Ceunynck et al. 2012). Moreover, dangerous situation between two road users arises when one of them complies with informal rules; for example, when driver commits an illegal behavior to reduce driving time. (De Ceunynck et al. 2012).
Among some factors that might cause pedestrian-vehicle interactions, red light violation by pedestrian is one of the significant reasons (Langbroek et al. 2012; Pasanen and Salmivaara 1993). Crossing in designated crosswalks and in a straight line are other factors decreasing the chance of causing an interaction between vehicles and pedestrians (Akin and Sisiopiku 2000). Also, interactions could be minimized with proper visual search and pace of crossing (Langbroek et al. 2012; Wazana et al. 1997).
Regarding child pedestrians, it has been reported that presence of traffic signals at crosswalks near schools decreased by four times the interaction of child pedestrians with vehicles, while presence of stop sign could increase these interactions by about 4.7% (D'Amours Ouellet 2016).
E. Visibility: Presence of a parked car near a crosswalk
As seen before, children’s physical features (including their shorter height) can put them at risk since they are not as visible as an adult from long distances (Schieber Richard and Vegega Maria 2002). Accordingly, parked cars create specific risks for child pedestrians, since they restrict the view of both drivers and children. (Petch and Henson 2000). Yannis, Papadimitriou and Theofilatos (2013) reported that the presence of prohibited parking areas near mid-block crosswalks led to more careful behavior by pedestrians. Road injuries can be prevented by making sure that child pedestrians are visible near crosswalks even with the presence of parked vehicles.
2.1.3
Behavior characteristicsThe behavior of children is recognized as an influential factor on road injuries (Rosenbloom, Ben-Eliyahu and Nemrodov 2008; Schwebel, Davis and O’Neal 2012). Similarly, Papaioannou (2007) stated that road users' behavior was the most important factor in pedestrian injuries. Despite the importance of the interrelationship between humans and environment, the behavior of pedestrians in different environments is yet an understudied factor in road injuries (Cinnamon, Schuurman and Hameed 2011).
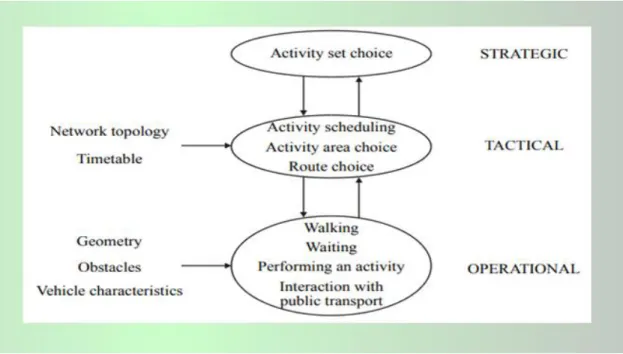
In order to study pedestrian behavior, three levels were modeled by Hoogendoorn, Bovy and Daamen (2002) and used by other scholars (Daamen 2004; Ishaque and Noland 2008; Schadschneider et al. 2009). The first level of pedestrian behavior is expanded at a strategic level showing that pedestrians are making decisions on their activities. Then, at the tactical level pedestrians are making short-term decisions, such as route choice, according to the density of other pedestrians and obstacles. The last level of pedestrian behavior in this model is the operational level describing instantaneous decisions based on actual walking behavior such as walking fast, slowing down, stopping, and waiting before crossing, as well as performing an activity and interaction with other road users (Daamen 2004; Ishaque and Noland 2008; Schadschneider et al. 2009) (Figure 2.2). Actions performed at the operational level are the results of decisions
made at the strategy and tactical levels. For instance, pedestrians on crosswalks with no signals (tactical level) walk faster to save time (operational level) to reach their destination (strategic level) (Schadschneider et al. 2009). The current study occurs at the operational level to examine the behavior (i.e. the rule compliance) of child pedestrians before and while crossing, and see what characteristics are influencing this behavior. The number of common and specific factors involving pedestrian’s behavior explained in previous studies will be described here to highlight the behavior characteristics of pedestrians in general. As we are studying children, the information about them in the literature is highlighted in the following sections; otherwise, the results for general pedestrians are provided.
Figure 2.2 Levels in pedestrian behavior
Source: Based on Hoogendoorn et al. (2001)
A. Pedestrian behavior: tempo and activity before and while crossing
The tempo (rhythm of walking) shown before and while crossing is proven to influence the risk of fatalities: the fatal-accident reports involving child pedestrians under 15 years in France showed that nearly seven out of ten cases were pedestrians running or playing (Fontaine and Gourlet 1997). Children in a study by Zeedyk, Wallace and Spry (2002) showed similar behavior, as 75% of them completed the crossing while running or skipping. As well, Fu and Zou (2016) stated that for higher percentage of children, running behavior occurred during the last second of the red man
in the traffic phase light. In a study by D'Amours Ouellet (2016) which is conducted for child pedestrians-vehicle interaction at crosswalks near schools, it was reported that 37.9% of children approached the curb with constant speed or acceleration, while others slowed down or stopped before crossing. Tom and Granié (2011) evaluated the tempo of adult pedestrians while approaching the curb and during crossing by considering regular walking, stopping, slowing down, and running. Their results showed that most of the participants walked regularly to reach the curb, and the majority of them regularly crossed the crosswalk. A few of them ran, stopped, or slowed down in the middle of the crosswalk.
Koh, Wong and Chandrasekar (2014) demonstrated that most adult pedestrians waiting for the next green light at the curb could finish crossing before the red light, and 45% of those starting at flashing hand/clearance phase faced red light at the end. Lachapelle and Cloutier (2017) studied waiting until the next green light at the curb for adults and senior pedestrians. Their results showed that higher percentage of senior pedestrians stopped for the next green light compared to the other age groups.
B. Pedestrian behavior: head and eye movements
Head and eye movements before and during crossing are defined as factors affecting the safety of pedestrians (Rosenbloom, Ben-Eliyahu and Nemrodov 2008; Tom and Granié 2011). These movements go toward the traffic lights, moving vehicles, other pedestrians, and the ground. Tom and Granié (2011) showed that the majority of adult pedestrians at signalized crosswalks looked at the moving vehicles before crossing, while only 19.5% of them looked at the traffic light and 9% at the other pedestrians. At unsignalized crosswalks, more than 82% of pedestrians looked at incoming vehicles before and during crossing, while only 9.5% of the sample looked at other pedestrians before crossing (Tom and Granié 2011).
With regards to child pedestrians, it was found that most of them do not look at both ways before crossing (Zeedyk et al. 2001; Rosenbloom, Ben-Eliyahu and Nemrodov 2008). In a study by Zhuang et Wu (2011), only 3.3% of pedestrians in all age groups did not look left and right before crossing in the waiting zone. D'Amours Ouellet (2016) studied child pedestrian-vehicle interactions at crosswalks near schools. According to their results, 17.1% of child pedestrians looked straight ahead or at the ground without paying attention to vehicles, while 22.1% looked at the vehicles before and during the crossing.
2.1.4 Road environment characteristics
Accidents leading to pedestrian injuries often occur in complex road environments (LaScala, Gerber and Gruenewald 2000). Certain road and physical environment risk factors have been evaluated in previous studies in order to examine safety of pedestrians. In this regard, number of researchers assessed traffic control devices such as presence of traffic light, pedestrian countdown display, traffic sign (e.g. speed limit), and marked crosswalks (Sisiopiku and Akin 2003; Paschalidis et al. 2016; Mitman, Ragland and Zegeer 2008; Wazana et al. 1997). In addition, some other studies have investigated required crossing time, crosswalk width, and required crossing speed (Lobjois and Cavallo 2007; Chandra and Bharti 2013; Rastogi et al. 2011; Akin 2000). The above-mentioned road environment risk factors are elaborated in detail in the following sections.
A. Intersection and crosswalk environment
As explained above, lack of appropriate roads and crosswalks put child pedestrians’ safety at risk. Many crosswalk characteristics can then be taken into consideration when trying to improve the safety of crossing. Based on the Manual on Uniform Traffic Control Devices (MUTCD) (2009), it is expected that signalized and controlled intersections have a positive impact on the safety of road users (Wang and Abdel-Aty 2014).
In fact, uncontrolled crossings (often mid-block) are particularly problematic for both pedestrians and drivers (Beckwith and Hunter-Zaworski 1998): pedestrians have the right of way on the street at those marked crossings but drivers do not respect it all the time. Therefore, uncontrolled crosswalks have the potential to create a conflict between pedestrians and vehicles in urban areas (Hakkert, Gitelman and Ben-Shabat 2002). For instance, signalized intersections reduce the probability of pedestrian accidents by half (Gårder 1989). In addition, a study by Cambon de Lavalette et al. (2009) demonstrated that the absence of signals at an intersection increases the rate of rule violation by road users. Accordingly, Brosseau et al. (2013) stated that the presence of pedestrian signals has a positive impact on pedestrians’ decision making and encourages them to respect the rules.
In crosswalks with a countdown timer, results are contradictory. On one side, a study demonstrates improvement in behavior: a higher number of pedestrians older than 12 years old complied with pedestrian signals compared to those in a crosswalk without a countdown display
(Lipovac et al. 2013), and dangerous crossings were significantly reduced compared to the rate at intersections without a timer (Brosseau et al. 2013). On the other side, many other studies stated that the presence of countdown timers created chances of non-complying behavior (Huang and Zegeer 2000; Vujanić et al. 2014), and led to an increase in the number of starter and late-finisher pedestrians (Wanty and Wilkie 2010).
The results of Fu and Zou’s (2016) study have shown that presence of a countdown display helped child pedestrian during the clearance phase not to be caught in the crosswalk before the red man signal’s onset, and to finish their crossing on time (by speeding up or running, for example).
B. Crossing time, crosswalk width, and required speed to cross on time
The essential need for pedestrians is to recognize the available and necessary time to cross the road, which depends on road width, walking speed, and ability to speed up (Lobjois and Cavallo 2007). Crosswalk width influences risk of having an accident since it affects the time a pedestrian is exposed to traffic (H. Li, Graham and Majumdar 2015; Rastogi et al. 2011; Tarawneh 2001). Collision risk increases with the width of the road (Abrashev et al. 1999; Cloutier et al. 2017; Noland and Quddus 2004). In other words, pedestrians in a wider street have a wider exposure to risk (Montella and Mauriello 2010), so with reductions in road width at crosswalks, pedestrians would have a shorter distance to cross, leading to less exposure to road risks (Hakkert, Gitelman and Ben-Shabat 2002; Martin 2006; Neumann and Wagner 2008).
The crossing time, is the time required by pedestrians to cross a road with traffic signals (Virkler and Guell 1984; Cambon de Lavalette et al. 2009), which is affected by crosswalk width (Hakkert, Gitelman and Ben-Shabat 2002). As such, the pedestrians’ behaviors are associated with the speed required to cross the street: in crosswalks with higher required speed (because of a greater width, for example), pedestrians move more quickly (Zhuang, Wu and Ma 2018; X. Zhang et al. 2013; Tarawneh 2001; Rastogi et al. 2011).
According to Chandra and Bharti (2013), crossing speed is analyzed with respect to road width, and it is calculated as the crossing distance (length of the crosswalk) divided by the estimated time needed by a pedestrian to cross (Wanty and Wilkie 2010; Li et al. 2013; Marisamynathan and Perumal 2014). However, walking speed is related to age, gender, group size, disability, traffic control condition, and departure signal (Gates et al. 2006; Marisamynathan and Perumal 2014).
Most of the guidelines and the manuals (e.g. Highway Design Manual – the Road (3rd Edition) (Hong et al. 2006) did not consider the different situations and characteristics of pedestrians to specify the speed while crossing (Almodfer et al. 2017).
A crossing speed of 1.2 meter/second is recommended in North America (Avineri, Shinar and Susilo 2012; National Advisory Committee on Uniform Traffic Control Devices 1988; Milazzo II et al. 1999; Manual on Uniform Traffic Control Devices 2006). Based on the study by Tarawneh (2001), many scholars believed that a crossing speed of 1.2 m/s was too fast for most pedestrians. Furthermore, Dewar (1992) suggested a 0.91 to 0.99 m/s value for traffic signal timing in general. Similarly, Rastogi et al. (2011) stated that 15th-percentile speeds were between 0.83–1.02 m/s for adult pedestrians, which vary with road width, traffic volume, and size of the urban area. Again, average crossing speed showed by Alhajyaseen (2012) ranged between 0.9 and 1.1 m/s. On average, an older pedestrian crossing speed of 0.95 m/s is slower than a child pedestrian speed, while for adults, crossing speed is 1.12 m/s (Marisamynathan and Perumal 2014). It is worth mentioning that the results of Knoflacher (1987) and Weidmann (1993) showed that children under 12 years of age had a slower walking speed in comparison with adults. The speed of adults and elderly pedestrians have received a lot of attention during the past decades, with lack of attention paid to children (Li et al. 2013). Therefore, there is great diversity in the research and recommendations and that little has examined children.
C. Crosswalk marking
A painted crosswalk encourages pedestrians to cross within the marked zone, where drivers expect more the presence of pedestrians (Montella and Mauriello 2010). Hence, several studies have shown that there was a considerable reduction in pedestrian injuries at marked crosswalks (Gorell and Tootill 2001; Morgan, Ogden and Barnes 2004; Zein 2004). Also, crosswalk marking seems to influence the behavior of pedestrians: they tend to cross faster in the absence of markings, which might mean that they tend to reduce the time they are exposed to traffic (Ekman 1996; Meir, Parmet and Oron-Gilad 2013).
D. Speed limits
It is well established that the main cause of road injuries is high speed of motor vehicles: the rate of pedestrian injuries leading to death is eight times higher in a street with a speed limit more than
40 km/h (Parachute Canada 2016; Peden et al. 2004). For areas where the speed limit was 50 km/h and 30 km/h, the probability of fatalities was found to be 40% and 5%, respectively (Montella and Mauriello 2010). In the case of parks, Ferenchak and Marshall (2017) illustrated that lowering vehicles speed makes drivers more aware of the environment which leads to safer roads for pedestrians. These speeds depend on the density of the neighborhood in each location.
According to these authors, solutions can be found through initiatives and regulations that reduce speed of vehicles and increase driver awareness of the presence of children through some changes in road near parks such as installation of traffic calming devices, which are proven to be efficient to reduce the rate of child pedestrian injuries (Jones et al. 2005). Traffic calming device has two main purposes including reduction of the frequency and severity of accidents, and improving the environment of local areas (e.g., decreasing speed of vehicles and traffic flow) (García et al. 2011).
Accordingly, providing a high quality and proper crossing location raises the level of pedestrian safety and reduces the likelihood of pedestrian accidents (Akin and Sisiopiku 2007), especially for children, who, as we said before, are unequally exposed to accidents in the environment (Pucher and Renne 2003).
2.2 Pedestrian rule compliance
Generally speaking, compliance refers to obeying a rule, standard, or policy (Lin 2016). Rule compliance, as discussed by Granié Granié (2007), needs internalization of social rules which eventually leads to obtaining personal values and attributes. This process is essential in the process of child development (Kopp 1982; Lytton 1980).
In terms of road rules, it is necessary for all road users to obey the road rules in order to establish a safe traffic system. Rule compliance can be seen as a crucial component of any safety strategy (Hopkins 2011) since not complying with road rules from both ends can lead to pedestrian injury (Cinnamon, Schuurman and Hameed 2011).
Many factors influence pedestrian rule compliance: the street location; individual; and environmental characteristics. These factors might also affect pedestrian's habits and preferences. Pedestrian's behavior and attitude are known as decisive factors in rule compliance (Akin and Sisiopiku 2007). Compliance with pedestrian rules could also be affected by children’s gender (Granié 2007) and by their age (Rosenbloom, Ben-Eliyahu and Nemrodov 2008). Although
compliance is an important factor for both children and adults (Toepfer, Reuter and Maurer 1972), most of the previous research did not study children compliance, so many results presented here are for adult pedestrians.
2.2.1 Temporal crossing compliance (compliance with signal timing at signalized intersections)
According to the Quebec Highway Safety Code (QHSC)(Quebec Highway Safety Code 2017), in an intersection with a pedestrian light, pedestrians should comply with their light, and if there is no pedestrian light they should comply with the traffic light. In addition, pedestrians facing a flashing signal with a countdown display may only start to cross if they can reach the other side before the start of the orange signal. The results of some previous studies in temporal crossing compliance showed that compliance with walk signals was about 50% (Akin and Sisiopiku 2007), and it was lower among male pedestrians in the study of Tom and Granié (2011). Also, non-compliance with signs and signals had positive association with pedestrian collision injuries, while installing pedestrian countdown display could reduce these injures (Markowitz et al. 2006).
Where there is a countdown signal, pedestrians tend to cross according to the remaining time of the countdown display, though they might underestimate their crossing time duration and finish on the red light (Wanty and Wilkie 2010). In addition, the waiting time before the next green light has a significant impact on compliance with the temporal rules, and the likelihood of crossing against the red light on a long-time cycle are higher (28%) than on a shorter-time cycle (20%) (Keegan and O’Mahony 2003).
2.2.2 Spatial compliance (crossing in/at the crosswalk)
Pedestrians should cross the street in a straight line, within the crosswalk if marked; only in the presence of a peace officer, school crossing guard, sign, or signal, can they cross the street diagonally (Quebec Highway Safety Code 2017). In other words, crossing compliance refers to respecting the crossing location (i.e., crosswalks) (Akin and Sisiopiku 2007).
As studies revealed, drivers’ attention to pedestrians is higher when pedestrians cross at designated locations, such as a crosswalk, and pedestrian-vehicle conflicts can be reduced by this behavior (Morel et al. 2003; Sisiopiku and Akin 2003). It has been reported in the literature
that the majority of adult pedestrian (59%) crossed compliantly in the crosswalk (Sisiopiku and Akin 2003), and there was no difference in compliance between genders for spatial compliance (Tom and Granié 2011).
2.2.3 Velocity (crossing speed)
One of the most critical and important issues in road safety planning is pedestrian speed. Crossing speed includes both walking and running (Chandra and Bharti 2013; Zhou et al. 2011) as two different types of movement for pedestrians. Walking is known as a common behavior, while running is considered by some as a risky and unsafe behavior since it decreases the pedestrian safety margin (Almodfer et al. 2017).
The rate of pedestrian exposure to vehicles is related to speed (Tarawneh 2001) since road users can make more reasonable decisions at lower speeds. However, among pedestrians, a higher percentage of running was seen for children (Li et al. 2013), especially when they were unaccompanied or in a group (Ishaque and Noland 2008). In France, pre-school children learn some safe road behaviors consistent with pedestrian rules, such as stopping at the curb, and walking (not running) during crossing (crossing speed) (Granié 2007). In addition, most pedestrians have the ability to adjust their speed if they encounter a potential or certain risk (Murray 2006; Tarawneh 2001), which might not be the case for children.
2.2.4 Visual search (before crossing)
Visual search is another important skill involved in the crossing task (Thomson et al. 1996). The visual system has an important role when crossing the street, because it can acquire information quickly and reliably (Geruschat, Hassan and Turano 2003). For the reasons mentioned above, children have often inadequate visual search behavior (Tapiro et al. 2014). About 41% of child pedestrians aged 5–6 years in a study by Zeedyk, Wallace and Spry (2002) did not look for oncoming vehicles, and if they were looking, they often did so in the wrong direction or with restricted view.
Assessing the previous studies concerning child pedestrian’s safety revealed that there is no comprehensive investigation on children’s safety crossing streets near urban parks. Hence, a study evaluating the characteristics pertaining to child pedestrians’ safety with regards to rule
compliance at crosswalks adjacent to parks is much needed. The following chapters aim to achieve this goal by providing the methodology and discussing the results.
CHAPTER 3: METHODOLOGY
This chapter will present the study areas and main research tools used in this study. We collected data on children’s level of compliance to pedestrian rules at crosswalks. The current study is based on a quantitative approach built on direct observation.
3.1 Operative framework
As presented before, an ecological model was chosen to evaluate interactions between people and the environment. Among different levels involved in any ecological model, four levels: individual, situational, road environmental, and behavioral characteristics are considered for their close associations with child pedestrian rule compliancy. The variables measured for each level are presented in Figure 3.1. The objective of this framework is to help us to generate our observation form in order to examine child pedestrian’s safety by assessing relations between those variables and child pedestrian compliance rules.
Figure 3.1 Operative framework used in the current study
3.2 Selection of study areas
Montreal is the second most populated city in Canada, located in the southwest of the province of Quebec. The city of Montreal with its 1.7 million inhabitants is the core part of metropolitan Montreal. Children under 14 years of age consist 15.6% of the city’s population (Ville de Montréal 2016). Neighborhoods located in the city’s central core are commonly known as “inner-cities” (Statistics Canada 2006). We selected inner-cities boroughs since they tend to have larger and denser populations, heavier traffic, and less room for children’s play than the suburbs. The studied boroughs include Villeray-Saint Michel-Parc extension (VSP) and Rosemont-la Petite-Patrie (RPP) (see Figure 3.2).
3.2.1 Park selection
We selected parks according to previous work by Apparicio et al. (2010). This paper classified parks into six different classes according to the presence or absence of facilities and the parks size (Table 3.1). Parks of type (A) are very small and include one playground. As per Apparicio et al. (2010), this kind of park is especially intended for children aged four and under. The next type (B) consists of small parks with two facilities including a playground and a sports field. Type (C) parks are also small but offer more equipment. Type (D) parks are also smaller but offer more than seven facilities on average including a skating rink and a swimming pool. The (E) type consists of larger parks and contains many types of equipment (5 on average). Finally, type (F) are metropolitan parks providing winter equipment and hiking trails.
Table 3.1 Typology of urban parks on the island of Montreal
Type of parks A B C D E F Total Number of parks 296 144 104 46 88 15 693
Size of parks very small park (less than 1 ha)
small park
(1 to 5 ha) small park (1 to 5 ha) small park (1 to 5 ha) (5 to 20 ha) large park
metropolitan park (more than 20 ha) Percentage of parks with playground for children 0-4 years old 96.6 80.6 85.6 80.4 79.5 20.0 86.7 Average number of equipment1 1,4 2,2 3,5 7,2 5 3,7 2,8
Source : Apparicio et al. (2010)
Parks in the first four categories (A, B, C, D) were selected because they are local and provide a greater chance of child pedestrians to walk and being present in them. Eighteen parks in different boroughs of the City of Montreal were selected within these four categories, between 4 to 5 Parks in each category. An exploratory visit to these parks was undertaken before making the final choice. We aimed to choosing different local parks having different size, traffic density, and different features in crosswalks next to the parks. The final parks were carefully chosen to have playground facilities in order to increase the chance of children presence. Finally, we ended up with four parks in the inner city of Montreal which had the above criteria. The analyses provided
1 This variable presents the average number of different types of equipment in the parks like playgrounds, sports fields
(baseball, football, soccer, etc.), winter sports (skate ring, arena, snow shoeing lanes, etc.), specialized equipment (skate parks), and swimming pools.