Submission PDF
Human and climate influences on sediment transfer – a
global account for the Holocene
Jean-Philippe Jenny
1,2, Sujan Koirala
1, Irene Gregory-Eaves
3, Pierre Francus
4,5, Christoph Niemann
1, Bernhard Ahrens
1,
Victor Brovkin
6, Alexandre Baud
3, Antti E. K. Ojala
7, Alexandre Normandeau
8, Bernd Zolitschka
9, Nuno Carvalhais
1,101Max Planck Institute for Biogeochemistry, 07745 Jena, Germany2INRA – UMR CARRTEL, Centre Alpin de Recherche sur les Réseaux Trophiques et
Ecosystèmes Limniques, Université Savoie Mont Blanc, 73000 Chambéry, France3Department of Biology, McGill University, Montréal (Qc), Canada H3A 1B1 4Centre - Eau Terre Environnement, INRS, G1K 9A9 Québec (Qc), Canada5GEOTOP Research Center, Montréal (Qc), H3C 3P8, Canada6Max-Planck Institute
for Meteorology, Bundesstrasse 53, 20146 Hamburg, Germany7Geological Survey of Finland, 02151 Espoo, Finland8Geological Survey of Canada, Bedford
Institute of Oceanography, Dartmouth, NS, Canada B2Y 4A29University of Bremen, Institute of Geography, Geomorphology and Polar Research
(GEOPOLAR), D-28359 Bremen, Germany10Departamento de Ciências e Engenharia do Ambiente, DCEA, Faculdade de Ciências e Tecnologia, FCT,
Universidade Nova de Lisboa, 2829-516 Caparica, Portugal. Corresponding Author: [email protected] Submitted to Proceedings of the National Academy of Sciences of the United States of America
Accelerated soil erosion has become a pervasive feature on land-scapes around the world and is recognized to have substantial implications for land productivity, downstream water quality and biogeochemical cycles. However, the scarcity of global syntheses that consider long-term processes has limited our understanding of the timing, the amplitude and the extent of soil erosion over millennial time scales. As such, we lack the ability to make predic-tions about the responses of soil erosion to long-term climate and land cover changes. Here, we reconstruct sedimentation rates for 632 lakes based on chronologies constrained by 3,980 calibrated
14C-ages to assess the relative changes in lake-watershed erosion
rates over the last 12,000 years. Estimated soil erosion dynamics were then complemented with land cover reconstructions inferred from 43,669 pollen samples and with climate time series from the MPI Earth System Model. Our results show that a significant portion of the Earth surface shifted to human-driven soil erosion rate already 4,000 years ago. In particular, soil erosion increased in 35% of the watersheds, and most of these sites showed a decrease in the proportion of arboreal pollen, which would be expected with land clearance. Further analysis revealed that land cover change was the main driver of soil erosion in 70% of all studied watersheds. This study suggests that soil erosion has been altering since millennia soil and aquatic systems, as well as carbon (C) losses that could have ultimately induced feedbacks on the climate system.
Global soil erosion | Lake records | 14C-ages | Pollens | Varved
sedi-ments
Changes in human land use have increased soil erosion rates
globally (1, 2) and have led to substantial alterations in soil
stability and productivity, functioning of river ecosystems, and
lateral transfers of sediments and carbon, affecting ultimately
long-term change of climate (3–5). The impacts of human land
uses and climate on soil erosion amplitude and spatial extent are
closely tied to the time-scale considered. On geological timescales
of millions of years, erosion is controlled by climate and tectonic
cycles (6), which in turn regulates atmospheric CO
2and climate
through chemical weathering (7) and organic C burial in
sed-iments (8). During the course of the Holocene, anthropogenic
modifications of catchments, including vegetation clearance and
burning, as well as agricultural and urban expansion have led to
rapid fluctuations in local to regional soil erosion rates (9–11),
and ultimately this has accelerated erosion 10- to 100-fold in some
regions (1). However, it is still unclear to what extent climate
and human factors have interacted and controlled long-term (i.e.
>100 year) soil erosion rates, and when a significant portion of
the Earth surface shifted to human-driven soil erosion rates (3).
Natural archives preserved as lake sediments provide a key
source of evidence for assessing soil erosion that occurs in lake
catchments and is integrative of all fluxes and processes that
remove soil, rock, or dissolved material from the watershed,
including gully, till, or rill erosion. For many lakes, sediment
accu-mulation rates (SAR) in central water cores can provide an
esti-mation of gross changes in the rate of deposition of allochthonous
sediment related to erosion (12). Due to their relatively high
temporal resolution and often continuous history of deposition,
lake cores are valuable archives of catchment-scale soil erosion
dynamics. Furthermore, the abundance of Holocene lake records
and the diversity of catchment systems around the globe have
established lake sediment cores as strategic data repositories for a
better understanding of transfer of matter on the surface of Earth.
The objectives of the present study are to identify first
in-creases in soil erosion across globally distributed sites to quantify
spatio-temporal patterns and to investigate the effects of climate
and land cover change (LCC) during the Holocene using SAR
records from lakes. Syntheses such as this one have the potential
to make key advances in our understanding of critical events for
Earth system processes. A major limitation for identifying the
transition from an overarchingly climatically-controlled system
to one in which human drivers explain changes in soil erosion
rates is the lack of spatio-temporally resolved empirical data,
which are needed to discriminate between local stressors
medi-ated primarily by human activities and climatic factors (13, 14).
Furthermore, our gap in knowledge about changes in global soil
Significance
Using a compilation of14C and pollen data arising from over
632 lake sites worldwide, we have identified the time of the first increase in global soil erosion, and the relative role of different drivers in initiating soil erosion, a critical indicator of soil quality. In particular, our regional synthesis of lake sediments indicated that a significant portion of the Earth surface shifted to human-driven soil erosion rate already 4,000 years ago, which occurred following land deforestation. The long-term perspective afforded by this synthesis provides new evidence that Human beings are a geological force that have altered lateral soil and sediment transfers globally well before the great acceleration in human activity from the start of the industrial revolution.
Reserved for Publication Footnotes
1
2
3
4
5
6
7
8
9
10
11
12
13
14
15
16
17
18
19
20
21
22
23
24
25
26
27
28
29
30
31
32
33
34
35
36
37
38
39
40
41
42
43
44
45
46
47
48
49
50
51
52
53
54
55
56
57
58
59
60
61
62
63
64
65
66
67
68
69
70
71
72
73
74
75
76
77
78
79
80
81
82
83
84
85
86
87
88
89
90
91
92
93
94
95
96
97
98
99
100
101
102
103
104
105
106
107
108
109
110
111
112
113
114
115
116
117
118
119
120
121
122
123
124
125
126
127
128
129
130
131
132
133
134
135
136
Submission PDF
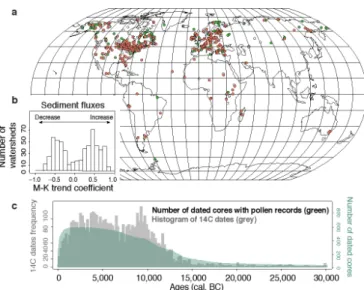
Fig. 1. (a) Location of the 632 study sites and changes in lake sediment rates over the last 10,000 years. Increases in lake sediment rates (red dots) were observed in 35.1% of the watersheds according to Mann Kendal (M-K) τcoefficients; the rest of the sites show a decrease (green dots) or steady (white dots) rates. (b) Distribution of M-K trend τ coefficients. (c) Number of dated cores containing a pollen record, and distribution of14C dates
(intervals = 12,000 years) used to calculate SARs.
erosion rates limits our ability to clearly define of the onset of the
Anthropocene (15). Finally, the lack of synthesis also limits our
understanding of the timing and extent of increased soil erosion,
hinders predictions about long-term total carbon losses from soils
and land-atmosphere exchanges (3).
In this study, we bring together a global synthesis of pollen
samples (n=43,669) and
14C-dates (n=3,980) to estimate
tem-poral trends in land cover and lake SAR in 632 lake-watersheds
(Fig.1, Table S1). The ages of the first increase in soil
ero-sion in lake-watersheds were then derived from the SAR trends
(Methods). The lake pollen records (retrieved from three pollen
databases [European (EPD), Global (GPD) and African Pollen
Database (APD)] were grouped into 5 plant-functional types
and two land-cover types (arboreal and non-arboreal). Our a
priori prediction is that decreases in the proportion of arboreal
pollen would reflect land cover changes (i.e. land clearance) that,
in turn, would lead to soil degradation and erosion. Trends in
long-term precipitation, air temperature and wind were assessed
using MPI-ESM-1.2LR transient Holocene simulations (Table
S1). Generalized additive models (GAMs) were used to estimate
the long-term contribution of land cover and climate on erosion.
Our approach is resumed in Figs. S1-2.
Sampled lake-catchments capture a comparable range of
morphometric properties (i.e. site elevation, watershed area, lake
area and lake depth) relative to the 14.3 million lakes in the
global HYDROLAKE database (16), as well as a wide range of
soil types, land cover and climatic conditions (Figs 1a-S3, Table
S2). Based on our analyses and reconstruction of SARs (Methods,
Fig. S4), we found that approximately 35% of long-term records
of SAR for 632 sites were essentially increasing (Kendall's tau
coefficient τ > 0.2, p-value < 0.05), while 26% were decreasing
(τ < -0.2, p-value < 0.05) and 39% were stationary or showed
no significant trends (Fig.1b-c, Table 1). Piecewise regression
modelling on each time series (Methods) showed that the global
signal of SAR and mass accumulation rates (i.e., MAR, corrected
from compaction, see Methods) increased since 4,000 cal. BP (i.e.
mean breakpoint year = 4,150 cal. BP (min.-max. range
3,250-4,547)). The fraction of lakes recording positive anomalies in SAR
also increase circa 4,000 cal. BP, at rate of 12 ± 0.2 % ka
-1(p<0.01;
Fig. 2a-c).
A common observation across our sites recording accelerated
SAR during the last 4,000 years was the trend of deforestation
(10), that coincided with the increase of SAR (Fig. 2a-e). Our
statistical analyses support the conclusion that land cover change
was the leading driver for the onset of accelerated soil erosion.
Assessment of the relative contribution of variables in a linear
regression model show that variations in SAR were explained best
by land cover, here expressed as AP percentage (Fig. S6). Using
general additive models on each lake-watershed time series, we
found that the probability of positive anomalies in SAR increased
as the anomalies in the proportion of AP decreased (p < 0.0001)
in 70% of our studied watersheds (Fig. 3f, S7 and Table 1). In
contrast, SAR time series were less related to the changes in
anomalies of precipitation and temperatures (p < 0.01) (Figs.
3c-d, S7 and Table 1) (Mean variances explained around 0.6). Sites
displaying relatively constant sedimentation rates through time
(i.e. benchmark sites, MK-test
) had no clear signs of
deforestation in our records (Fig. 2).
Trend analyses show that despite the heterogeneity in the
signal of SAR among sites, some regional patterns were also
observed, highlighting different socio-economical histories. For
instance, the rise in sediment accumulation rates is later in North
America compared to Europe (Fig. S6), and likely corresponds to
the widespread establishment of European agricultural methods
shortly after colonization (14). The decrease in sediment fluxes
recorded in 23% of the lakes was not explained by land cover
and climate variables and then was rather interpreted as a result
of increased sediment retention due to water uses and river
management. Human modification of rivers about 3,000 years
ago increased with embankments, dams, watermills, especially in
the Chinese and Roman Empires, which could have increased
sediment retention (17).
The long-term reconstructions of sediment flux dynamics - i.e.
relative changes in sedimentation rates - at global and regional
levels presented herein involve some uncertainties due to the
nature of
14C dating and the relatively poor dating resolution
at some sites, but nonetheless provide a comprehensive global
assessment of the timing of the ‘low frequency” variations (Fig.
2a,c,d). To investigate how short-term variations in land cover
could affect SAR, we conducted further analyses on 12 varved
records from lakes around the world that had annually dated
SARs and pollen records extending over the Holocene (Figs.
3a-b, S8). Consistent with our larger but lower temporal resolution
dataset, we found that the SAR trends were anti-correlated with
the percentage of arboreal pollen (Fig. 3b). High rates of change
in SAR and pollen records were generally evident in the Early
Holocene, followed by an increase of AP percentage associated
with decreasing SAR, and then finally during the Late Holocene,
we observed increases in SAR and a decrease in AP percentage
(Supplementary text).
Interestingly, both the varved and lower temporal
resolu-tion
14C-dated cores highlight the importance of climate driven
change in SARs for the Early Holocene. This Early Holocene
change (i.e. between 12,000 to 8,000 cal. BP) can be explained by
the retreat of North Hemisphere ice sheet that progressively gave
rise to the creation of most contemporaneous lakes and new lake
SAR records. Long records of SAR in lakes found in previously
glaciated parts of Europe and North America tended to show
high pre-Holocene rates declining to minimum values during the
Early to Middle-Holocene (14). For example, AP fraction shows
an increase and SAR showed a decrease from 12,000 cal. BP
to 10,000 cal. BP in Holzmaar (Germany) or between 10,000
cal. BP to 8,000 cal. BP in the Black Sea as a result of the
transient response of vegetation to climate changes (Fig. S8).
During the early to mid-Holocene, the lake-watershed systems
seem to progressively reach a stabilization phase associated with
the vegetation development, soil maturation and lake ecosystem
137
138
139
140
141
142
143
144
145
146
147
148
149
150
151
152
153
154
155
156
157
158
159
160
161
162
163
164
165
166
167
168
169
170
171
172
173
174
175
176
177
178
179
180
181
182
183
184
185
186
187
188
189
190
191
192
193
194
195
196
197
198
199
200
201
202
203
204
205
206
207
208
209
210
211
212
213
214
215
216
217
218
219
220
221
222
223
224
225
226
227
228
229
230
231
232
233
234
235
236
237
238
239
240
241
242
243
244
245
246
247
248
249
250
251
252
253
254
255
256
257
258
259
260
261
262
263
264
265
266
267
268
269
270
271
272
Submission PDF
Table 1. Results of M-K tests and multiple regression models. The Mann Kendall trend coefficients (τ) show that 35.1 % of all our study sites have recorded an increase in SAR over the last 10,000 years. GAM showed that the probability of temporal variation in SARs of lakes depends on changes in the proportion of arboreal pollen over the past 12,000 years more than changes in climate variables in 58- 80% cases. GAM sites correspond to the number of sites used for the GAM models. GAM formula to assess controls on SAR is a function of changes in land cover, air temperature and precipitation: SAR∼s(AP)+s(Prec)+s(T°).
τ(M-K test) All Sites (n=632) GAM results GAM sites p-value LCC < p-value Air T° p-value LCC < p-value Prec. p-value LCC < p-value climate [%] [n] [%] [n] [%] [n] [%] [n] [%] > 0.2 (p-values < 0.05) 35.1 209 57.3 141 67 144 69 122 58 > 0.5 (p-values < 0.05) 20 116 31.8 86 74 86 86 78 67 < 0.2 (p-values < 0.05) 23.8 155 42.5 115 74 111 111 102 66 < 0.5 (p-values < 0.05) 12.8 79 21.6 64 81 67 67 63 80 -1 to 1 100 365 100 256 70 255 70 224 61
Fig. 2. Trends in lake SAR (proxy of erosion), land cover as well as climate change during the Holocene. (a-b) Density plots of the anomalies in SARs and AP percentages (43,669 pollen samples), respectively, for 63214C-dated sites (3,980 calibrated14C-ages). Global
trends for SARs are shown (c) in 632 lakes based on an GAM, with 95 % confidence intervals on the predicted means, (d) as SARs medians trends calculated every 50 years (n = 632 sites) and point breaks detected on the SAR medians curve global trend based on a bootstrap distribution. (e) Changes in land cover are shown as trends AP percentage for the subset of sites (n=116) recording an increase in SAR over time (solid green line), and for a subset of sites (n=287) recording no significant changes in SARs over time, denoted here as benchmark sites (dashed green line). (f) From Lewis et al. 2015: trends in global temperature anomalies (relative to the average over the period 1961 to 1990 in blue), and atmospheric CO2(red) from the GRIP ice
core59.
stabilization, as evidenced by relatively constant SAR between
8,000 to 4,000 cal. BP. Since the middle of the Bronze Age
(3,500 cal. BP), the growing human influence upon erosion is the
emergent global trend (9) (Figs. 3c-d, S8).
Collectively, these findings suggest that the abundance of
trees in watersheds was the leading factor explaining
tempo-ral variations in soil erosion, with anthropogenic deforestation
explaining accelerated soil erosion over recent millennia. Our
results highlight the importance of large-scale (i.e. in terms of
distribution of the lake records globally, but not in terms of the
total contributing area) and long-term processes on soil erosion
and transport, and how human activities began to act on these
processes much earlier than other signatures of the
Anthro-pocene globally, e.g. human appropriation of the N cycle since
1860 (18). This global-scale analysis of paleolimnological records
adds to the growing evidence that humans are simultaneously
increasing the river transport of sediment through soil erosion
and decreasing this flux to the coastal zone through sediment
retention in reservoirs (19). Interestingly, the integration of our
long-term synthesis with recent studies (18) underscores a shift in
273
274
275
276
277
278
279
280
281
282
283
284
285
286
287
288
289
290
291
292
293
294
295
296
297
298
299
300
301
302
303
304
305
306
307
308
309
310
311
312
313
314
315
316
317
318
319
320
321
322
323
324
325
326
327
328
329
330
331
332
333
334
335
336
337
338
339
340
341
342
343
344
345
346
347
348
349
350
351
352
353
354
355
356
357
358
359
360
361
362
363
364
365
366
367
368
369
370
371
372
373
374
375
376
377
378
379
380
381
382
383
384
385
386
387
388
389
390
391
392
393
394
395
396
397
398
399
400
401
402
403
404
405
406
407
408
Submission PDF
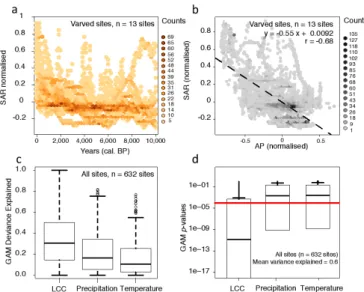
Fig. 3. . Holocene-scale trends in 12 annually-resolved varved sites. (a) Density
plot normalized SARs trends for 12 varved lakes. (b) Negative correlation be-tween SARs and AP fraction of the varved sites. (c) Deviance explained in the SAR trends by changes in land cover, precipitation and temperatures in the GAM models run for each of the 63214C-dated sites. (d) Generalized additive
models were run 632 times and p-value results inform the contribution of land cover change (LCC), precipitation, and air temperature to SARs.
key processes from land clearance (this study) to the
intensifica-tion of agriculture (18) causing most of the variaintensifica-tion in erosion
over the last 50 years.
Methods
Reconstructing soil erosion dynamic
Paleolimnological records were used to reconstruct a signal of soil erosion at both the annual and centennial scale for the past 12,000 years. It is now well established that long-term erosion can be reconstructed from geochemical signatures and sediment accumulation rates (SAR) in well-dated lake sediments archives (10, 13). For many lakes, SAR from deep and central position in lake can provide an estimation of gross changes in the rate of allochthonous inputs related to erosion, especially when SAR estimates are converted to influx rates of allochthonous inorganic material (12). As lacustrine productivity also contributes to lake sediments, SAR data were only used to infer, rather than to measure, the rate and processes of erosion (20). Our study of SAR was furthermore constrained to periods of relative constant lake productivity, before widespread cultural eutrophication has occurred since the industrial revolution. Under such baseline conditions, the SAR can conceivably serve to inform the first increase in soil erosion or sediment retention on millennial timescales (21).
Radiocarbon (14C) dating predominates for long Holocene timescales
and provides the temporal frameworks used in this paper. Radiocarbon (14C)
dating of lake sediments can document the rates at which sediment accumu-lated over the past 50,000 years. With a radioactive half-life of 5,730 years, the radioactive decay of14C is minimal for samples less than 300 years of age
and needs to be completed with other dating techniques. The preservation of varves (i.e., annually laminated sediment) in some hypoxic lakes offer the considerable advantage to precisely date sediments and reconstruct annual SAR variations by measuring varves from the sediment/water interface down-core, potentially without interruption (22, 23). Sediment archives also pre-serve indications of past land cover transformations via the pollen records, allowing the study of effects of land cover changes (LCC) on soil erosion when pollen records are available.
Palynological and radiometric data of lake sediment records were col-lected in May 2017 from three open source databases: the Global Pollen Database (GPD), the European Pollen Database (EPD) and the African Pollen Database (APD). The sites had to satisfy several conditions to be included in this synthesis. From the initial 4,711 sites inventoried, the 632 sites were accepted because the study site: 1) was a lake sensu stricto (documented by authors, and confirmed by satellite observations) and a not peatbog; 2) had to contain sediment core profiles that were dated with radiometric methods (i.e. minimum of three dated intervals; median here=6.8 +/- 4.4 SD) and/or by varves counting; 3) had to provide a temporally-resolved pollen records (i.e. minimum of 10 intervals over the sediment core; median=40 +/- 45 SD).
14C age/depth models
A total of 4,581 radiocarbon ages were calibrated to calendar (±2σ) years before present (BP) using the CLAM 2.2 package in R software (24) and the northern and southern hemispheric calibration curves IntCal13 and SHCal13,
respectively. Negative radiocarbon ages were calibrated with the post bomb curves from Hua et al. 2013 (25). For each core,14C dates were processed
semi-automatically to obtain 632 age-depth models after 1,000 iterations for each profile. Age-depth models were then run several times based on linear interpolation, linear/polynomial regression, cubic, smooth and locally weighted splines. Hiatuses and events of instantaneous deposition were removed from the analysis when the original authors recorded them. Finally, linear depth-age models were selected to derive sediment accumulation rates. Accumulation rates were derived from depth-age models at 10 and 50 year resolution, SAR = (di–di+1) / (ti+1–ti), where t are calibrated ages
and d sediment depths (Fig. S4). The SAR signals were normalized for each profile: SARnorm=(SAR – SARmean) / (SARmean), where SARmeancorresponds to
the mean of SAR (related from 8,000 BP to top of the lake sediments) for each related site location. To run the GAM analyses, only intervals including pollen records have been kept (median of 28 per sites) in order to not overestimate the confidence in the temporal resolution.
The time-dependent compaction of the sediment was taken into consideration using the equation of Emerson et al. (26): MAR = SAR × d × (1 -porosity). Where MAR = mass accumulation rate (g cm-2yr-1); SAR = Sediment
accumulation rate (cm y-1); d = sediment density of 2.5 g.cm-3(fixed - we
assumed that changes in sediment density were relatively low compared to changes in SAR during the Holocene); porosity=water content (%). The porosity factor has been adjusted against 15 water content profiles collected from literature search and GAM regression (Fig. S9).
Holocene land cover and climate data
The 632 sediments records from the three pollen databases contained data on pollen and other micro- and macro-fossils which enables the assess-ment of land cover change over 3 to 12 millennia (27). Altogether, 5 plant structural functional types (PFTs) associated to terrestrial groups were used to analyzed the temporal changes in land cover during the last 12,000 years: Herbs (HERB), dwarf shrubs (DWAR), bryophytes (BRYO), vascular cryptogams (Pteridophytes, VACR) and trees and shrubs (TRSH). AP fractions were then calculated and normalized to the total terrestrial PFT according to standard procedure (27) in order to assess changes in soil cover protection: Arboreal Pollen (AP %) = [TRSH / (TRSH + HERBS + VACR + DWAR + BRYO)] × 100.
Climate can be reconstructed from pollen records, but those data were already used in this study for LCC reconstructions. To avoid circularity and standardize our approach, climate time series for the past 8,000 years (i.e. average, minimum and maximum of precipitation, air temperature and wind) were collected for all sites from the transient Holocene simulation with MPI-ESM-1.2 LR, with land and atmosphere spatial resolution of 1.9°×1.9°, developed at the Max Planck Institute for Meteorology references: (28). Time series were resampled at 50 and 10 years using piecewise cubic Hermitean interpolation polynomials (Pchip-R) for GAM and M-K analysis, respectively (Fig. S7). Finally, modern site characteristics data were extracted from the HydroLAKES database and from the modeled area of the hydrological basins calculated using the flow accumulation and flow direction rasters made available from HydroSHEDS (16).
Sensitivity analysis on annual records
SAR has been described as a reliable proxy of soil erosion, but the contribution of lake productivity to the temporal variations of SAR has to be further evaluated. First, a multi-proxy approach was conducted on a subsample of our varved lakes to estimate the contribution of autochthonous and allochthonous deposition to the SAR variability. For these varved records, we analyzed the annual SAR measurements and estimated the proportion of SAR explained by the terrigenous vs. lacustrine productivity signals from the same record (Fig. S9). The titanium (Ti) and the magnetic susceptibility (MS) were used as proxies for erosion, whereas biogenic silica flux, silicium-titanium (Si:Ti) ratio and calcium-magnesium (Ca:Mg) ratio were used as proxies for productivity (12, 21). Secondly, we analysed the response of our 632 SAR records to fluctuations in air temperature, precipitation, cropland cover and human population density; here we used the latter two metrics as an indirect proxy of nutrient supplies to the lake, assuming that these measures were the main driver of lake productivity during the Holocene. Nutrient supplies were estimated indirectly using the HYDE data on cropland and human population density (29).
Numerical analysis
To disentangle the impacts of climate and land cover drivers on erosion dynamics and to apportion changes to specific drivers, we use the general additive models (GAM) techniques that are also able to take account of uncertainties associated with the available data. Variance Inflation Factors (VIFs) were used to detect collinearity among predictors (cut-off VIF > 0.4). We ran 632 models using the lake SAR time series as the response variable, the normalised AP percentage, precipitation and air temperatures as fixed effect explanatory variables, and computed p-values (reported on Fig. 1) and the deviance explained (Fig. S7) related to contributions of LCC and climate variables. Confidence intervals were derived using the standard errors pro-duced by the predict.gam function in R, with type = ‘response’ specified in the model, mgcv library (30). Nonparametric M-K tests for monotonic trends were used to quantify trends of land cover for each of the 1,607 watershed time series within the past 12,000 years. This analysis was based on the Kendall rank correlation coefficient and was conducted using the Kendall library (31). A positive score shows a monotonically increasing trend, whereas a negative value shows a monotonically decreasing trend.
409
410
411
412
413
414
415
416
417
418
419
420
421
422
423
424
425
426
427
428
429
430
431
432
433
434
435
436
437
438
439
440
441
442
443
444
445
446
447
448
449
450
451
452
453
454
455
456
457
458
459
460
461
462
463
464
465
466
467
468
469
470
471
472
473
474
475
476
477
478
479
480
481
482
483
484
485
486
487
488
489
490
491
492
493
494
495
496
497
498
499
500
501
502
503
504
505
506
507
508
509
510
511
512
513
514
515
516
517
518
519
520
521
522
523
524
525
526
527
528
529
530
531
532
533
534
535
536
537
538
539
540
541
542
543
544
Submission PDF
1. Montgomery DR (2007) Soil erosion and agricultural sustainability. Proc Natl Acad Sci104(33):13268–13272.
2. Borrelli P, et al. (2017) An assessment of the global impact of 21st century land use change on soil erosion. Nat Commun 8(1):2013.
3. Wang Z, et al. (2017) Human-induced erosion has offset one-third of carbon emissions from land cover change. Nat Clim Change 7(5):345–349.
4. Vollenweider RA, Development O for EC and, Directorate O for EC and DE (1970) Scientific
fundamentals of the eutrophication of lakes and flowing waters, with particular reference to nitrogen and phosphorus as factors in eutrophication (Organisation for Economic Co-operation
and Development).
5. Carpenter SR (2005) Eutrophication of aquatic ecosystems: Bistability and soil phosphorus.
Proc Natl Acad Sci U S A 102(29):10002–10005.
6. Peizhen Z, Molnar P, Downs WR (2001) Increased sedimentation rates and grain sizes 2-4 Myr ago due to the influence of climate change on erosion rates. Nature 410(6831):891–897. 7. Gaillardet J, Dupré B, Louvat P, Allègre CJ (1999) Global silicate weathering and CO2
consumption rates deduced from the chemistry of large rivers. Chem Geol 159:3–30. 8. Burdige David J. (2005) Burial of terrestrial organic matter in marine sediments: A
re‐assessment. Glob Biogeochem Cycles 19(4). doi:10.1029/2004GB002368.
9. Arnaud F, et al. (2016) Erosion under climate and human pressures: An alpine lake sediment perspective. Quat Sci Rev 152(Supplement C):1–18.
10. Roberts N, et al. (2018) Europe’s lost forests: a pollen-based synthesis for the last 11,000 years. Sci Rep 8(1):716.
11. Hoffmann T, Erkens G, Gerlach R, Klostermann J, Lang A (2009) Trends and controls of Holocene floodplain sedimentation in the Rhine catchment. CATENA 77(2):96–106. 12. Dearing JA (1991) Lake sediment records of erosional processes. Hydrobiologia
214(1):99–106.
13. Walling DE (2009) The Impact of Global Change on Erosion and Sediment Transport by Rivers:
Current Progress and Future Challenges (The United Nations World Water Development
Report 3 Water in a Changing World, International Sediment Initiative of UNESCO-IHP). 14. Dearing JA, Jones RT (2003) Coupling temporal and spatial dimensions of global sediment
flux through lake and marine sediment records. Glob Planet Change 39(1):147–168. 15. Lewis SL, Maslin MA (2015) Defining the Anthropocene. Nature 519(7542):171–180. 16. Messager ML, Lehner B, Grill G, Nedeva I, Schmitt O (2016) Estimating the volume and age
of water stored in global lakes using a geo-statistical approach. Nat Commun 7:13603. 17. Gibling MR (2018) River Systems and the Anthropocene: A Late Pleistocene and Holocene
Timeline for Human Influence. Quaternary 1(3):21.
18. Galloway JN, et al. (2008) Transformation of the Nitrogen Cycle: Recent Trends, Questions, and Potential Solutions. Science 320(5878):889–892.
19. Syvitski JPM, Vörösmarty CJ, Kettner AJ, Green P (2005) Impact of Humans on the Flux of Terrestrial Sediment to the Global Coastal Ocean. Science 308(5720):376–380.
20. Edwards KJ, Whittington G (2001) Lake sediments, erosion and landscape change during the Holocene in Britain and Ireland. CATENA 42(2):143–173.
21. Arnaud F, et al. (2012) Lake Bourget regional erosion patterns reconstruction reveals
Holocene NW European Alps soil evolution and paleohydrology. Quat Sci Rev 51(0):81–92. 22. Jenny J-P, et al. (2016) Urban point sources of nutrients were the leading cause for the historical spread of hypoxia across European lakes. Proc Natl Acad Sci 113(45):12655–12660. 23. Zolitschka B, Francus P, Ojala AEK, Schimmelmann A (2015) Varves in lake sediments – a
review. Quat Sci Rev 117:1–41.
24. Blaauw M (2010) R-Code for “classical” age-modelling (CLAM V1.0) of radiocarbon sequences. Suppl Blaauw M 2010 Methods Code Class Age-Model Radiocarb Seq Quat
Geochronol 55 512-518 Httpsdoiorg101016jquageo201001002.
doi:https://doi.org/10.1594/P-ANGAEA.873023.
25. Hua Q, Barbetti M, Rakowski AZ (2013) Atmospheric Radiocarbon for the Period 1950–2010. Radiocarbon 55(4):2059–2072.
26. Emerson S, Widmer G Early diagenesis in anaerobic lake sediments—II. Thermodynamic and kinetic factors controlling the formation of iron phosphate. Geochim Cosmochim Acta 42(9):1307–1316.
27. Davis BAS (2015) The age and post-glacial development of the modern European vegetation: a plant functional approach based on pollen data. Veg Hist Archaeobotany 24(2):303–317. 28. Stevens B, et al. Atmospheric component of the MPI-M Earth System Model: ECHAM6. J
Adv Model Earth Syst 5(2):146–172.
29. Goldewijk KK, Beusen A, Drecht G van, Vos M de The HYDE 3.1 spatially explicit database of human-induced global land-use change over the past 12,000 years. Glob Ecol Biogeogr 20(1):73–86.
30. Wood SN (2011) Fast stable restricted maximum likelihood and marginal likelihood estima-tion of semiparametric generalized linear models. J R Stat Soc Ser B Stat Methodol 73(1):3–36. 31. McLeod AI (2011) Kendall: Kendall rank correlation and Mann-Kendall trend test Available
at: https://CRAN.R-project.org/package=Kendall [Accessed April 26, 2018].
Acknowledgements
This study was supported by the AXA Research Fund to J.P.J., the Canada Research Chairs Program and NSERC for P.F. and I-G.E., and is a contribution for the Varve Working Group (VWG) and the working group on "Global Soil and Sediment transfer in the Anthropocene" (GLOSS), within the International Future Earth core project PAGES (Past Global Changes), from which the original idea emerged. The work of the data contributors and the pollen database community is gratefully acknowledged. Author
contributions: Conceived and designed the experiments: J.P.J., N.C, S.K., P.F.,
M.J., I.G-E., B.A. Performed the experiments: J.P.J., N.C., S.K. Analyzed the data: J.P.J., C.N., A.N. Contributed reagents/materials/analytical tools: V.B., A.B., A.O., B.Z. Wrote the paper: J.P.J., N.C. Critically revised, improved, and approved the final manuscript: J.P.J., P.F., I.G-E, A.O., B.Z. The authors declare that no competing interests exist. Author Information: The authors declare no competing financial interests. Correspondence and requests for materials should be addressed to JPJ ([email protected]).
This study was supported by the AXA Research Fund to J.P.J., the Canada Research Chairs Program and NSERC for P.F. and I-G.E., and is a contribution for the Varve Working Group (VWG) and the working group on "Global Soil and Sediment transfer in the Anthropocene" (GLOSS), within the International Future Earth core project PAGES (Past Global Changes), from which the original idea emerged. The work of the data contributors and the pollen database community is gratefully acknowledged.
Author contributions:Conceived and designed the experiments: J.P.J., N.C, S.K., P.F., M.J., I.G-E., B.A. Performed the experiments: J.P.J., N.C., S.K. Analyzed the data: J.P.J., C.N., A.N.
Contributed reagents/materials/analytical tools: V.B., A.B., A.O., B.Z. Wrote the paper: J.P.J., N.C. Critically revised, improved, and approved the final manuscript: J.P.J., P.F., I.G-E, A.O., B.Z. The authors declare that no competing interests exist.
Author Information:The authors declare no competing financial interests. Correspondence and requests for materials should be addressed to JPJ ([email protected]).