BRANCH GROWTH RESPONSE TO PRUNING:
DEVELOPMENT AND TESTING OF A NEW APPROACH TO
MEASURING BRANCH EXTENSION IN TREES
A THESIS PRESENTED
IN PARTIAL FULFILLMENT
OF THE REQUIREMENTS FOR THE DEGREE OF
MASTERS IN BIOLOGY
SUBMITTED BY
MATTHEW FOLLETT
UNIVERSITÉ DU QUÉBEC À MONTRÉAL Service des bibliothèques
Avertissement
La diffusion de ce mémoire se fait dans le respect des droits de son auteur, qui a signé le formulaire Autorisation de reproduire et de diffuser un travail de recherche de cycles supérieurs (SDU-522 - Rév.0?-2011). Cette autorisation stipule que «conformément à l'article 11 du Règlement no 8 des études de cycles supérieurs, [l'auteur] concède
à
l'Université du Québec à. Montréal une licence non exclusive d'utilisation et de publication de la totalité ou d'une partie importante de [son] travail de recherche pour des fins pédagogiques et no'n commerciales. Plus précisément, [l'auteur] autorise l'Université du Québec à Montréalà
reproduire, diffuser, prêter, distribuer ou vendre des copies de [son] travail de rechercheà
des fins non commerciales sur quelque support que ce soit, y compris l'Internet. Cette licence et cette autorisation n'entraînent pas une renonciation de [la] part [de l'auteur]à
[ses] droits moraux nià
[ses] droits de propriété intellectuelle. Sauf entente contraire, [l'auteur] conserve la liberté de diffuser et de commercialiser ou non ce travail dont [il] possède un exemplaire.,REPONSE DES BRANCHES A
L'ELAGAGE:
DÉVELOPPEMENT ET ESSAI D'UNE NOUVELLE
APPROCHE POUR NIESURER L'
EXTENSION DES
BRANCHESDANSLESARBRES
MÉMOIRE
PRÉSENTÉ
COMME EXIGENCE PARTIELLE
DE LA MAÎTRISE EN BIOLOGIE
PAR
MATTHEW FOLLETT
ACKNOWLEDGEMENTS
I
would
like to
express
my
smcere appreciation and gratitude
to Dr.
Christian
Messier,
who
has been
an extremely
patient
and
giving
supervisor.
His constant
encouragement and general
disposition made him both
a pleasure to
work with, and
an
inspiration to continue
working.
His
gentle
guidance allowed me to
follow
my
own
path
on this project, yet
kept me
from getting !ost. I
would also
like to thank
Dr.
Charles Nock, whom over
the
comse
of this project came to be
a great friend.
Charles, I sincerely appreciate your candor, yom wit and your sense of humor, as well
as yom
deep respect
for
quality
scientific
investi
gation
and
reporting.
I
would also
like to thank
all
the members of the
Messier Lab who
helped in the project,
or just
tolerated me being
around so
long. I
of course thank my
family,
in particular my
partner Roisin,
who stood
behind me on this
endeavour and fully supported
the
process; and provided solid statistical support. And
to my daughter
Aoife, born in
the
middle of this project, you
hav.e
been
an inspiration
and
a joy to
watch grow, and
I
thank you for affording me the time to work on your afternoon naps! I hope I can pass
to
you a sense of wonder and
passion for
the natural
world, wherever you find
it, and
all
the joy
and
memories
experiencing
it can bring. I
extend
my
gratitude
to
the
funding
partners of the
La Chaire
industrielle
CRSNG
/
Hydro-Québec
sur le
contrôle
de la croissance
des
arbres
,
and
to the
FONCER-MCF program
,
which
,
without
their
support
,
this project would not have been possible
.
· ACKNOWLEDGMENTS ... . iii
LIST OF FIGURES ... . VI LIST OF TABLES ... . VIII RÉSUMÉ ... . IX ABSTRACT ... . li X GENERAL INTRODUCTION ... . Problem ... . Current knowledge... .. 2
Research objectives... 6
General Methods... .. 7
CHAPTER1: 8 TESTING A NEW APPROACH TO QUANTIFY GROWTH RESPONSES TO PRUNING AMONG THREE TEMPERA TE TREE SPECIES 1.1 Abstract... ... 9
1.2 Introduction... 10
1.3 Methods... ... 12 1.3.1 Site... 12 1.3.2 Tree selection... 12 1.3.3 Measuring annua1 branch extension . . . .. 13 1.3.4 Pruning response growth classification... 15
1.3.5 Variables influencing rates of branch regrowth... .. 16 1.3.6 Statistical analysis... ... . . .... 17
1.4 Results... .. 17
1.4.1 Accuracy of Tru pulse 360 . . . 17
1.4.2 Branch growth in response to pruning ... .'... 18
vii 1.5 Discussion... 20 1.6 Conclusion... 23 1.7 References... 34 1.8 Appendix... .. 38 GENERAL CONCLUSIONS... 39 REFERENCES... 42
LIST OF FIGURES
Figures Page
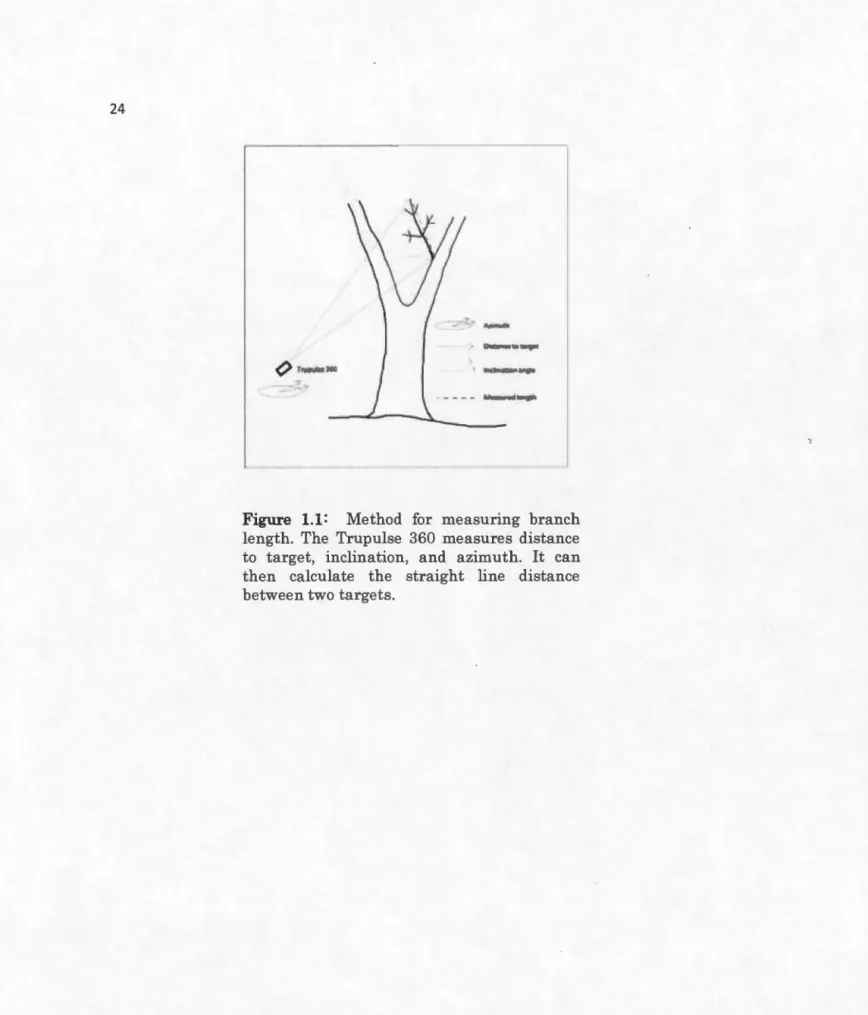
1.1 Method for measuring branch length The Trupulse 360 measures 35 distance to target, inclination, and azimuth. It can then calculate the straight line distance between two targets
1.2 Correlation of laser (Trupulse 360) and in-tree linear tape 36 measurements of annual pruning response growth in
F.
pennsylvanica. Mean length = 0.52 rnSD
= 0.354,R
2 = 0.98,F
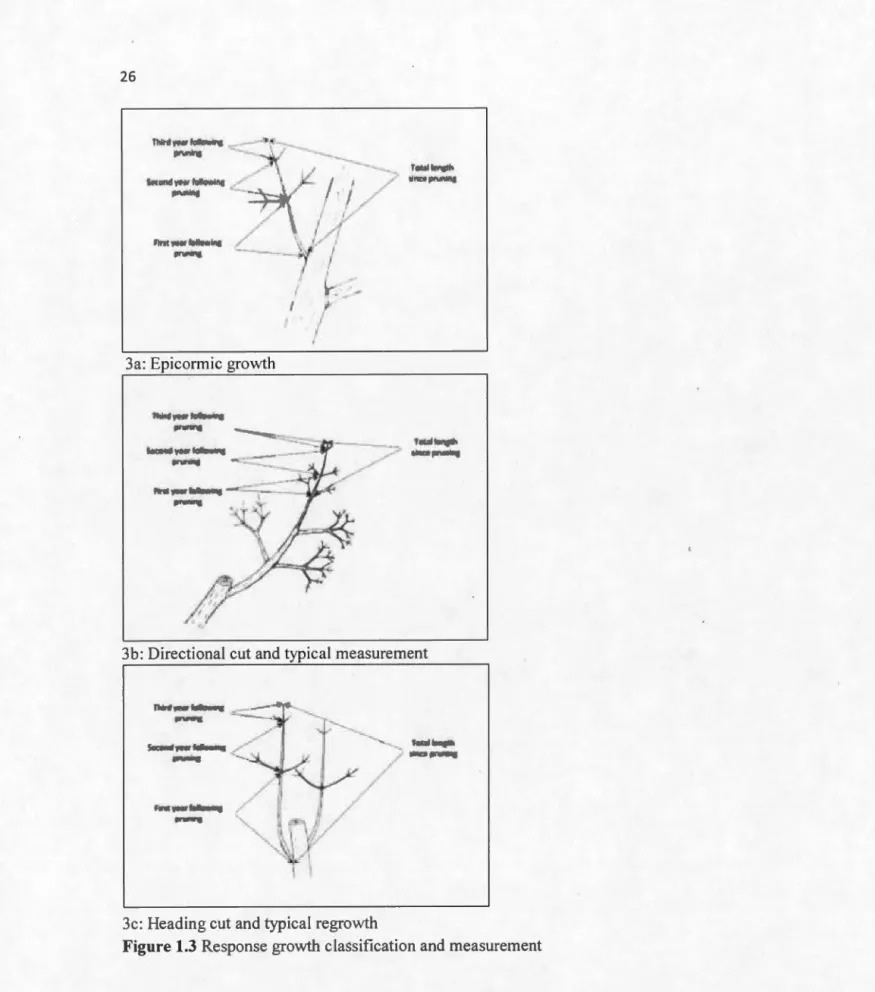
(1,92) = 4844, p < 0.001, slope = 0.948, N = 931.3 Response growth classification and measurement 37
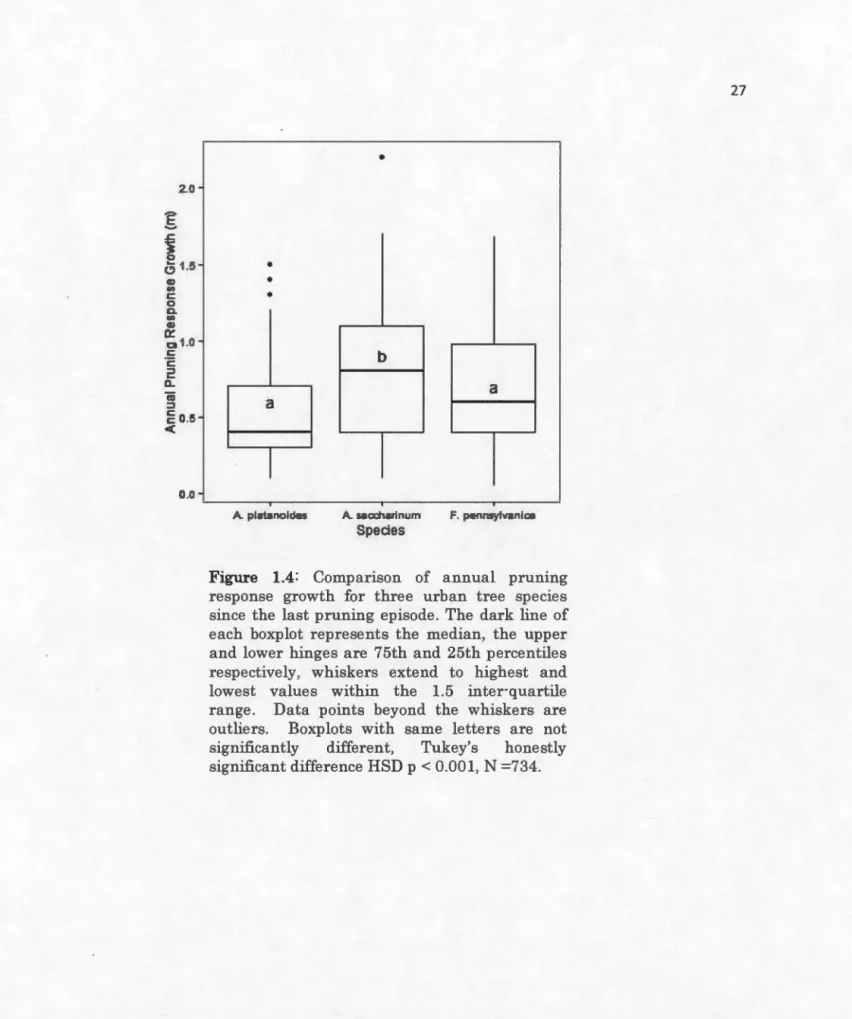
1.4 Comparison of annual pruning response growth for three urban tree 38 species since the last pruning episode. The dark line of each boxplot represents the median, the upper and lower hinges are 75th and 25th percentiles respectively, whiskers extend to highest and lowest values within the 1.5 inter-quartile range. Data points beyond the whiskers are outliers. Boxplots with same letters are not significantly different, Tukey's honestly significant difference HSD p < 0.001, N =734
1.5 Relationship between length of annual growth and number of years 39 elapsed since the last pruning episode. Linear regression of annual length on time with species interaction yielded; R2
= 0.
169, p < 0.001, slope=
·0.18 N=
734. F. pennsylvanica, R2=
0.01, p < 0.05, slope=
·0.03, N=
369; A. platB;noides, R2=
0.14, p < 0.005, slope= ·
0.07, N=
278; A. saccharinum, R2=
0.005, p > 0.05, slope=
·0.02, N=
2521.6 Comparison of annual response growth by response type for three 40 species; directional pruning (d), epicormic growth (e), heading eut (h). The dark line of each boxplot represents the median, the upper and lower hinges are 75th and 25th percentiles respectively, whiskers extend to highest and lowest values within the 1.5 inter-quartile range. Data points beyond the whiskers are outliers, points inside the box are the mean. Boxplots with same letters (within species plots) are not significantly different at p<0.05 Tukey's honestly significant difference HSD
1.7 Annual growth of pruning response by branch inclination for 3 41 species.
oo
inclination corresponds with horizontal growth, and 90° corresponds with vertical, negative values are growth growing below the horizontal (downwards). Linear regression of annual length on inclination with species interaction yielded: R2= 0.11,
p < 0.001, slope=
0.002, N=
730; for F. pennsylvanica, R2=
0.04, p < .001, slope=
0.003, N=
338; A. platanoides, R2=
0.14, p < 0.05, slope=
0.008, N=
205; A. saccharinum, R2=
0.007, p > 0.05, slope = -0.002, N=
189.Table 1.1 1.2 1.3 1.4 LIST OF TABLES
Summary of explanatory variables measured.
Sample sizes for tree species and specifie growth types.
Relationships between individual factors measured and branch regrowth for all species and individual species. main stems in a
v-trim type tree
Tree Size and Soil Exposure ranges for all trees included in the study Page 32 33 34 42
xi
RÉSUMÉ
Les arbres urbains jouent un rôle important dans l'infrastructure des villes en
fournissant de nombreux services écosystémiques. Cependant, la nature
fortement anthropisée du milieu urbain impose une cohabitation entre les arbres
et les réseaux de distribution électrique. Dans la majorité des régions urbaines et
péri-urbaines, l'utilité de dégager la végétation des lignes électriques est
maintenue par l'élagage des arbres envahissants. Le temps estimé pour une
prochaine intervention d'élagage est une préoccupation constante pour les
aménagistes. L'efficacité des interventions d'élagage est affectée par soit
plusieurs évaluations faites sur le terrain afin de planifier les prochaines
interventions d'élagage ou la capacité à prédire l'élongation suite à l'élagage, ce
qui se traduit par d-es interventions sur des cycles trop court que nécessaire.
D'identifier les indicateurs clés de la croissance de la branche (longueur),
contribuerait à l'élaboration d'un modèle prédictif de la longueur des branches
qui en retour, pourrait être utilisé pour optimiser les cycles d'élagage. Nous
avons identifié 12 variables qui étaient à la fois: a) susceptibles d'affecter la
croissance de la longueur de la branche, et, b) facilement et rapidement
mesurables sur le terrain. Nous avons ensuite développé une approche novatrice
en utilisant un hypsomètre pour mesurer en toute sécurité les taux de croissance
à l'intérieur du corridor dégagé des lignes de distribution. Nous avons
échantillonné 59 arbres de 3 espèces (Fraxinus pennsylvanica, platanoides Acer
et AceT saccharinum) sur l'île de Montréal. Sur les 12 variables, 5 ont été
corrélées au taux de réponse lorsque testées sur l'ensemble des espèces; cependant, au niveau de l'espèce, seulement
2
des variables étaient corrélées (R2> 0, 15) sur l'ensemble des 3 espèces échantillonnées. Les espèces d'arbres étaient fortement corrélées avec le taux de croissance, ainsi que pour le type d'élagage utilisé, et l'angle de la repousse à la verticale qui s'est produite.Cependant, aucune variable par rapport à la taille de l'arbre ou par rapport aux ressources disponibles ne se sont révélées significatives jusqu'au niveau de
l'espèce. Dans un tel environnement très variable, nos résultats démontrent que
le. temps estimé pour une prochaine intervention est une tâche complexe, et
d'autres travaux sont nécessaires pour développer un modèle prédictif qui
répondra à ce besoin.
Mots clefs: Arboriculture, élagage, taux de croissance, Fraxinus pennsylvanica,
Urban trees play an important role in the infrastructure of cities by providing numerous ecosystem services. However, trees must also coexist with other
elements of city infrastructure due to the compact nature of urban development. ln the majority of urban and peri·urban regions, electrical utility line vegetation
clearance is maintained by pruning encroaching trees. Estimating return time for vegetation management is an overarching concern for managers. Poor
efficiency results from either extensive field inspections to plan upcoming pruning schedules or scheduling pruning on shorter cycles then necessary to
ensure utility clearance. ldentifying key predictors of branch growth (length) would assist in developing a predictive madel for branch length which in turn could be us~d to optimize pruning cycles. We identified 12 variables that were both: a) likely to affect branch length growth, and, b) easily and quickly measurable in the field. We then develop~d an innovative approach using a handheld laser hypsometer to safely measure growth rates into the utility corridor. We sampled 59 trees of 3 species (Fraxinus pennsylvanica, Acer platanoides and Acer saccharùwm) on the island of Montreal. Of the 12 variables, 5 were correlated to the response rate when tested across ali species; however, at the species level only 2 of the variables were correlated (R2>0.15) across all 3 of species sampled. Tree species was a strongly correlated with growth rate, as was the type of pruning used, and the angle from vertical the regrowth occurred. However, none of-the tree size or available resource variables
proved to be significant down to the species level. Our results show with such a
highly variable environment, estimating return rates is a complex task, and
further work is needed to develop a predictive madel for more accurate
estimation of return times.
KEYWORDS
Arboriculture, Pruning, Utility Clearance, Growth Rate, Fraxinus pennsylvanica, Acer platanoides, Acer saccharinum
- - - -- - - · - - - -- - - -- -- - - ,
1 GENERAL INTRODUCTION
Problem
In the urban and peri·uban matrix, tree and aboveground electrical utilities
often face spatial conflicts which are typically resolved through clearance
pruning of the trees growing in proximity of the electrical conductors. This clearance pruning provides a margin of safety for both the general public and the utility by crea ting a corridor free of contact between the trees and the conductor
along the length of the distribution lines. This clearance zone, often referred to
as the "utility corridor", is maintained through the periodic pruning of the
encroaching trees. Estimates of North American utility company expenditures
on distribution corridor clearance pruning range from $2 billion USD (Rees et al. 1994; EPRI 1995; Goodfellow 2000), to $10 billion USD (Transmission & Distribution World 2002). For the majority of Quebec's distribution system, the pruning sequence and return times are currently planned through a combination
of field crew logistics, and periodic in -field scouting of growth rates (Christian
Buteau, persona! conversation). Reducing scouting and maximizing return times
for clearance pruning would reduce costs for the utility company (Hydro Quebec).
The development of a predictive model for species specifie growth rates following pruning would assist in reducing those costs. A number of factors likely influence this rate of regrowth, including: climate, spec1es, site factors and
genetic and phenotypic variation. Perhaps sorne the basic factors, such as specifie
species, plant size and proximal environmental factors could be combined to
provide a predictive madel for the growth rate following pruning. As such, the
goal of this project is to move towards the development of a growth madel, based
Current knowledge
There is little published work on within-tree branch regrowth rates
following pruning (Clark and Matheny 2010). Much of the published research ' surrounding trees and utilities has been based on reducing catastrophic whole tree failure adjacent to the corridor as this is the primary cause of tree related electrical outages (Rees et al. 1994, Guggenmoos 2003, 2011, Poulos and Camp 2010). Goodfellow (Goodfellow et al. 1987) published work on growth rates as they correspond to pruning type along utility corridor, but otherwise, much of the
pruning specifie literature relates more directly with resulting architectural or
branch strength changes (Debell et al. 2002, Luley et al. 2002, Gilman 2003,
Gilman et al. 2008, Pavlis et al. 2008, Clark and Matheny 2010). Rates of gap closure by lateral filling as a result of branch extension has been studied in
managed forests (Heichel and Turner 1984, Runkle and Yetter 1987, Carter
1997, Springmann et al. 2011), But these studies are not analogous to urban tree
branch regrowth. First, urban tree species composition is often dissimilar to
managed forests. Second, tree responses to gap creation are likely a poor analog
for urban tree responses to pruning. Finally, urban tree growth rates often differ
from neighbouring forests due to differences in environmental conditions (Close et al. 1996, Gregg et al. 2003, Searle et al. 2012). ln a comparison of established
Acer saccharum growing in forest stands against those in an urban setting, Close
et al. (1996) found significantly lower terminal growth, earlier leaf drop, and less favourable foliar nutrients in the urban setting. However, both Gregg et al. and Searle et al. found higher growth rates in urban seedling growth. Gregg et al,
using a Populus clone found double the plant biomas in the urban setting,
pointing to increased ozone levels in the rual environement. Searl et al. found an
8-fold increase in the above ground growth in urban seedlings of Quercus rub.t·a, in this case attributing the differnece to increased urban temperatures.
However, while there is little published work on the specifie response to pruning in the urban context, the literature on tree physiology is vast. Much of
- - - -- - - -- - - -- - -
-3 this research is based in forestry and forest ecology, but perhaps many inferences can be taken from this extensive area to develop a theoretical base for investigating the role of pruning in growth response.
Tree branch growth, particularly branch extension, 1s known to be affected by primary resource availability; light, water; nutrient levels. Branch growth is directly related to light interception during the growing season (Ramas and Grace 1990, Saxe et al. 1998, Stoll and Schmid 1998, Krueger et al. 2009). Ramas and Grace (1990) found higher maximal rates of photosynthesis in high light vs. low light conditions, while Stoll and Schmid (1998) showed an increase in overall length of growth in higher light conditions compared to shaded conditions after a disturbance in light availability. Similarly, among tropical broadleaves, increased allocation to stem growth (elongation) over leaf growth has been noted in high light levels (King 1994). However, Krueger et al (2009) found that while an increase in available light generally increased overall growth, the presence of browsing deer obscured the relationship among several species studied. Deer browsing could be considered analogous to anthropogenic pruning practices when considered in the context of growth response. Plant leaf removal through pruning or herbivory can reduce whole plant capacity due to resource limitation (Pinkard 2003). Compensatory responses by plants to leaf removal may alter growth patterns to favour development of leaf area (Eissenstat and Duncan 1992, Mediene et al. 2002). Leaf removal and associated reduction in plant carbon supply can reduce plant growth (height and diameter) if leaf removal is sufficiently severe (Pinkard and Beadle 1998, Pinkard 2003, Salle a et al. 2003).
Available carbohydrate content within stems and branches has been linked to growth and vitality (Chapin et al. 1990, Magel et al. 2000, Kosola et al. 2001). Magel et al. (2000) state that bark and living wood are the dominate storage areas for reserve carbohydrates, where the reserves are utilized during leaf, twig and cambial formation. The removal of leaves and shoots has been shawn to reduce carbohydrates in bath roots and above ground stems
(Tschaplinski and Bll:).ke 1994, 1995, Li et al. 2002, Maurin and DesRochers 2013). However, Chapin et al (1990) state that no clear relationship between stored reserves and defoliation response exist, and more work is needed to
understand the roll of storage in response to defoliation or partial plant removal.
Typical arboricultural pruning regimes with regards to electrical utilities
have been studied, however; rouch of the work focuses on the impacts of pruning
on tree structure and stability (Clark and Matheny 2010). The type of pruning cuts utilized has been linked to response rates (Rom and Ferree 1985, Goodfellow et al. 1987), where directional pruning (pruning back the main stem to a significant lateral branch) is considered to elicit less of an accelerated growth
response then heading cuts (internodal pruning) (Harris 1992, Gilman 2011). ln
a study of six species of deciduous broadleaf trees in Wisconsin, Illinois, Goodfellow et al. (1987) found significantly greater growth response (longer internodal extension) for trees subjected to "round·over" pruning, otherwise
known as heading cuts, as compared to "drop·crotching" or "natural target
pruning" (directional pruning). The same study also found greater yearly growth
following pruning for species considered shade intolerant (Acer saccharinum,
Acer negundo and Ulmus pumila) as compared to those considered shade
tolerant (Acer saccharum, Fraxinus pennsylvanica and Acer platanoides).
However, no environmental data was considered in this study. Outside the
context of arboriculture, more literature exists on the impact of pruning. In a study of one year old peach trees (Prunus persica), following the removal of 60% of the above ground shoots, a strong response to increase the diameter and
branching of secondary shoots returned the shoot:root ratio of the plants to that
of the control group within the growing season (Mediene et al. 2002). However,
pruning did not alter stem diameter or tree height of plantation grown
Eucalyptus Wcorn et al. 2008), or Julgan nigra (Clark 1955, Funk 1979) species
un til over 50% of the crown had been removed. Y et Clark (1955) and Funk (1979)
found that increasing the amount of lower branches removed corresponded to
5
Available soil volume or compaction levels - and subsequent water and
nutrient availability - have been linked to urban tree growth and health
(Heilman 1981, Alberty et al. 1984, Pan and Bassuk 1985, Krizek and Dubik
1987, Grabosky and Bassuk 1995, Grabosky and Gilman 2002). ln a study of
compacted construction site soils, Alberty et al. (1984), found decreased growth
rates in both FoTsythia. ova.ta. and CoTnus seàcea.. Pan and Bassuk (1985) showed
a 50 percent reduction in seedling dry weights for Aila.nthus a.ltissima. seedlings
grown in compacted soils loose sandy loam while Grabosky and Gilman (2002)
showed a decrease in the size of established tree crowns with an increase in
hardscaped soil surface area under the crown.
Overall plant growth rates are generally correlated with species shade
tolerance, and under similar growing conditions shade -intolerant species
typically show faster rates of growth in all but the lowest light conditions.
(Marks 1975, Mc Clendon and Mc Millen 1982, Kitajima 1994, Walters and
Reich 1996, Krueger et al. 2009). Marks (1975)_ described a distinct difference in
growth rates between early and late succession woody tree species; where early
succession, shade intolerant species such as Populus gTa.ndidenta.ta. typically
show longer extension growth then those considered late successional such as
AceT sa.ccha.Tinum. ln a comparison of tropical trees, those with high seed
mortality rate (low construction costs) and typically described as shade
intolerant, showed higher relative growth rates in both full sun and shaded
conditions than those considered shade tolerant (Kitajima 1994). A study of
several Eastern North American deciduous broadleaf species described higher
growth rates for those species considered shade intolerant compared with those
considered shade tolerant in all but the lowest light conditions. Only in very low
light conditions (< 2%) did shade tolerant species show higher growth rates then
Research objective
While there 1s substantial literature on tree physiology, the factors driving the rate of regrowth following pruning is still relatively undiscovered.
Given the expenditure in maintaining the clearance distances required for safe electrical utility distribution, a deeper understanding of the regrowth rates could
improve schedule planning, th us reducing associated costs. Upon review of the litera ture, a suite of variables was selected that were expected to have an effect on the rate of regrowth following pruning in an urban setting. These included; species (three species common in Montreal, Fraxinus pennsylvanica, Acer
platanoides and Acer saccharinum); environmental factors including proxies for
available light (neighbouring buildings, azimuth of pruning area within the crown) and available soil resources (exposed soil area under the crown); tree size and vigour (crown size, stem size, average branch elongation); pruning type; as weil as the type of regrowth that occurred. A complete list of the variables can be found in table 1.
Throughout Canada and the United States, personnel and equipment approach distances to exposed electrical conductors is regulated by worker safety
laws, requiring certified workers to approach or operate equipment within 3m of
exposed energized conductors over 750V (Ontario Occupational Health and
Safety Act 2012). This poses a challenge for data acquisition as the equipment and personnel required to quickly access a large sample becomes difficult to
procure or prohibitively expensive. As such, we sought to develop a safe and efficient method to capture data and quantify annual branch elongation in tall
trees within proximity to electrical wires.
Further to this, we worked to develop a protocol to categorize and select growth types, and document rates of specifie regrowth following pruning for a
number of dominant urban tree species to help optimize pruning cycles. Finally,
7
abiotic variables influence the rates of branch re·growth among the three tree spec1es.
Method
This project can be viewed as 3 distinct sections captured in one chapter:
1) the development of a safe and efficient method to quanti:fy annual branch
elongation in tall trees within proximity to electrical wires, 2) the documentation
of rates of re·growth following pruning for a number of dominant urban tree spec1es, and 3) the evaluation of how different biotic and abiotic variables influence the rates ofbranch re·growth among the three tree species.
To measure branch elongation a method was developed using a handheld
laser rangefinder. After initial testing, the results of the rangefinder data were
compared to measurements taken within the tree using a standard tape
measure. The results from this were of adequate accuracy to pursue a larger
data set.
A protocol for selecting growth type and sample size was then developed
and 3 species of trees chosen. Growth within the tree canopy was selected according to type of pruning, location within the tree and proximity to the utility
corridor. A sample of growth from 60 trees was then taken in the urban
environment.
The data analysis was completed using R: A Language and Environment
for Statistical Computing. Bath abiotic and biotic factors were examined for their relationship with growth rates. One·way ANOVA testing was used to test
differences in means for all group tests such as species, regrowth type or trim
CHAPTERI
TESTING A NEW APPROACH TO QUANTIFY GROWTH RESPONSES TO PRUNING AMONG THREE TEMPERA TE TREE SPECIES
Matt Follett1·*, Charles A. Nock1•2, Christian Buteaus and Christian Messier1•4.
1Center for Forest Research, Département des Sciences Biologique, Université du
Québec à Montréal, Montréal, Québec, Canada
2Faculty ofBiology- Geobotany, University ofFreiburg, Freiburg, Germany
3Hydro-Québec, Montréal, Québec, Canada
4Institut des Sciences de la Forêt Tempérée, Département des Sciences
Abstract
In settled areas electricalline safety is maintained by pruning encroaching trees.
Identi:fying key predictors of branch elongation growth rate following pruning
would assist in developing predictive models and optimizing pruning cycles.
However, measuring branches in trees near electrical lines is complex and
challenging. This paper describes an innovative approach using a handheld laser
rangefinder to safely and accurately estima te growth from the ground. In ·tree
and ground-based laser measurements were highly correlated. It then follows by
testing for correlations between branch growth response over a number of years
after pruning and many biotic and abiotic factors for Fraxinus pennsylvanica,
Acer platanoides and Acer sacchaànum in the city of Montreal, Canada. In a
sample of 59 trees, A. saccharinum had the greatest branch growth, followed by
F pennsylvanica, and finally A. platanoides. Branch growth increased following
pruning and subsequently strongly declined, with A. platanoides declining the
fastest. Branch inclination angle was positively correlated with growth rate for
two species, but not for A. saccharinum. Among the types of pruning utilized,
directional pruning techniques resulted in the least branch regrowth rate. Tree
diameter was weakly related to branch growth rates. These results suggest that
while growth conditions for street trees may be perceived as homogenous, there
is substantial variation in branch growth response. This variation may be
related to pruning history, or unmeasured abiotic or biotic variables. Estimating
pruning cycle duration is a complex task and further work is needed to develop a
predictive model for more accurate estimation of return times.
Keywords: Arboriculture, Pruning, Utility Clearance, Growth Rate, Fraxinus
1.1 Introduction
Urban trees play an important ·role in the infrastructure of cities by
providing numerous ecosystem services (Dwyer et al. 1992, Bolund and
Hunhammar 1999, Kuo and Sullivan 2001, Nowak et al. 2008). However, trees
must also coexist with other elements of city infrastructure due to the compact
nature of urban development. Where electrical utility line vegetation clearance is
maintained by pruning encroaching trees, periodic returns are required to
maintain adequate clearance from electrical conductors. Estimating return time
for vegetation management is an overarching concern for managers (Rees et al. 1994, Christian Buteau, personal communication 2012). Return time for vegetation management could be optimally planned using the clearance distance at the last pruning cycle and rates of re-growth of shoots that willlikely be the fust to intercept electricallines.
A number of factors will likely influence this rate of regrowth, including:
climate, species, site factors and genetic and phenotypic variation. However,
there is little published on specifie branch regrowth rates following pruning.
While rates of gap closure as a result of lateral branch extension has been
studied in managed forests (Heichel and Turner 1984, Runkle and Yetter 1987),
such studies are difficult to extrapolate to urban tree branch regrowth in
response to pruning for a number of reasons. First, urban tree spec1es
composition is often dissimilar to managed forests. Second, research on tree canopy growth response to gap creation, documenting branch elongation to altered environmental conditions in and near the crown (Canham 1988, Springmann et al. 2011) is difficult to extrapolate to urban tree responses to
pruning. Finally, urban tree growth rates often differ from neighbouring forests
due to differences in environmental conditions (Close et al. 1996, Gregg et al.
11
Branch growth is directly related to light interception during the growing
season (Ramos and Grace 1990, Saxe et al. 1998, Stoll and Schmid 1998, Krueger
et al. 2009). Ramos and Grace (1990) found higher maximal rates of
photosynthesis in high light vs. low light conditions, while Stoll and Schmid
(1998) showed an increase in overalllength of growth in higher light conditions
compared to shaded conditions after a disturbance in light availability. Overall
growth rates are generally correlated with species shade tolerance, and under
similar growing ~onditions shade-intolerant species typically show faster rates of
growth in ail but the lowest light conditions (Mc Clendon and Mc Millen 1982,
Kitajima 1994, Walters and Reich 1996, Krueger et al. 2009). Available soil
volume or compaction levels - and subsequent water and nutrient availability
-have also been linked to urban tree growth and health (Heilman 1981, Krizek
and Dubik 1987, Grabosky and Bassuk 1995, Grabosky and Gilman 2002, Sala
and Hoch 2009). Available carbohydrate content within stems and branches has
been linked to growth and vitality (Chapin et al. 1990, Magel et al. 2000, Kosola
et al. 200 1).
Despite this solid foundation of research on plant growth, there is little
specifie information on branch growth rates of different tree species within urban
areas. Anecdotally the industry recognizes that pruning can elicit a strong
branch elongation response in the years following, and a few studies have
reported on the trend. For example, Rom and Ferree (1985) reported an increase
in growth rates in the year following pruning, as pruning severity increased. In
addition, Goodfellow et al. (1987) noted that "round ·over pruning" (assumed to
mean internodal heading cuts) resulted in higher branch growth rates then
"natural pruning" (assumed to mean reduction to a lateral branch) following
routine utility line clearance.
One likely reason for the lack of research on pruning and its effect on
branch growth rates in urban areas and around electrical conductors is the
working within the proximity of energized conductors. Safe approach distances to exposed electrical conductors is regulated by worker safety laws, requiring certified workers to approach within 3m of exposed energized conductors over
750V (Ontario Occupational Health and Safety Act 2012). This poses a challenge
for data acquisition as the equipment and personnel required to quickly access a
large sample becomes difficult to procure or prohibitively expensive.
This study sought to: 1) develop a safe and efficient method to quantify
annual branch elongation in tall trees within proximity to electrical wires, 2)
document rates of re·growth following pruning for a number of dominant urban
tree species to help optimize pruning cycles, and 3) evaluate how different biotic
and abiotic variables influence the rates of branch re·growth among the three
tree species.
1.3 Methods
1.3.1 Sites
AU trees m this study were located within the confines of the city of
Montreal, Quebec, Canada (45°30'N, 73°34'W). Summers are typically humid
with a daily average of21 to 22°C in July, while winters are cold with an average
daily temperature of -10°C in January. Average annual precipitation is
approximately 980 mm. 1.3.2 Tree Selection
Based on their abundance and importance to local electric line clearance
programs, three tree species were selected for study: Fraxinus pennsylvanica
Marsh. (F pennsylvanica), Acer platanoides L. (A. platanoides) and Acer
saccharinum L. (A. saccharinum). The study sampled trees previously pruned as
part of routine electrical conductor clearance work. To limit variance of pruning
distance from the conductors due to voltage level or construction type, only single
13 network is largely adjacent to streets on municipal property thus all the trees in the study were owned by the city of Montreal. This further reduced variation as
the trees were pruned for street and sidewalk clearance to similar specifications.
The selected street blacks are primarily urban to suburban within 6 km of the
downtown area. A total of 59 trees were sampled in 6 different boroughs. Trunk diameter ranged from 28 cm to 112 cm, tree height ranged from 7.6 rn to 22 rn
and crown size ranged from 127 m3 to 4642 m3 (table 2, 4). Data was collected
from August 2011 through to February 2012.
Electrical line clearance pruning in Montreal typically involves pruning
entire street blacks during a pruning cycle, and as such all the trees in a plot
would have been pruned at the same time. For the streets sampled in this study,
this ranged from 3-5 years prior to the sample date. To estimate the pruning date, epicormic growth from heading cuts was used to back date the eut. This
assumed that the growth sampled occurred the year of pruning, however late
summer or fall pruning may not have induced growth during that year, as such
the pruning date recorded would have been the following year.
1.3.3 Measuring annual branch extension with a laser range :finder
To measure branch extension without climbing near the electrical corridor, we developed and tested a ground based measurement system utilizing
a handheld laser range:finder/clinometer (TruPulse 360, Laser Technology lnc.,
Centennial Colorado, USA). This allowed for rapid, relatively inexpensive data
acquisition while eliminating the need for aeriallift access or climbers certified to work within proximity to the electrical conductors. All linear measurements
were taken from the ground using the laser range:finder. The deviee measures distance to target, as well as inclination angle and azimuth of the deviee. It can then calculate the distance between any two reflective points (Figure 1). The TruPulse 360 was used for all in ·crown measurements, as well as distance to the
lengths (rounding to nearest lOth) and is specified as accurate to ±0.25 degrees for inclination, ±1 degree for azimuth. The viewfinder/scope includes 7x magnification to allow for improved sighting accuracy. To assess the deviees realized accuracy for total branch length and internodal growth, we conducted field tests and verified laser measurements with in ·tree linear measurements of 19 branch samples ofF. pennsylvanica (Fig 2).
For each tree included in the study, measurements of annual branch extension growth were collected for a) branches that had regrown into the utility corridor following pruning in 2008 - 2010 (response growth), and b) control
growth ofun·pruned branches growing on the periphery of the crown. For control growth, exterior branches that were distant to the pruning site and visually assessed to be indicative of the average growth rate for the tree were selected. For response growth we sampled the longest branches from each of the selected pruning response types that had regrown into the utility corridor. This was based on a visual assessment during initial inspection of each tree, and followed up by routine measurement of the largest branches to select appropria te growth. Annual growth increments were measured as the distance between successive bud scars, or architectural markers. In temperate areas trees exhibit yearly rhythmic growth. When the bud scales that protect the terminal bud during overwintering are shed, they leave behind a prominent marking on the stem referred to as bud scars. As a new set of bud scales is developed for each overwintering bud, each year of growth is marked by the bud scar. Therefore, the bud scars allow for precise delin~ation of the length added each year and for many species can be used to measure past growth for several years before present depending on species characteristics (Canham 1988, Runkle 1992, King 2003). When the twig eventually outgrows the bud scars, branch architecture can be used to delineate yearly growth for several more years (Millet et al. 1999),
thus 5 to 6 years or yearly growth is possible to determine through visual analysis of branch fe a ture s.
15 1.3.4 Pruning response growth classification
Response growth was classified into one of the three following categories: 1)
epicormic growth, 2) growth from directional pruning, and 3) growth from
heading cuts (Fig. 3). Epicormic growth was considered any branch occurring
from epicormic or latent buds on a parent stem (Shigo 1991). This included
growth from past epicormic sprouting sites that had been eut back to the parent
stem during the previous pruning cycle. Directional pruning was defined as any
pruning back to a lateral limb approximately 113 the diameter of the parent
stem; in this case the response growth measured was growth occurring on the
remaining laterallimb (Fig. 3b). ln initial pilot work, we observed that response
growth (on the study species) following directional pruning was mainly from the
terminal bud of the uncut lateral branch, and not from epicormics originating at the pruning eut. A heading eut was any internodal eut where the closest
remaining lateral was less than 113 diameter of the parent stem; the resulting
epicormic growth was then measured (Fig. 3c). The defining difference between
the "epicormic growth" classification and the "heading eut" was the eut to the
parent stem; where in the case of the heading eut the parent stem was eut internodally vs. the epicormic growth which could originate anywhere in the
tree, typically on larger scaffold limbs, without a localized eut to the parent stem.
The diameter of the parent stem was also categorized, for epicormic growth this
was at the growth site, for directional and heading cuts this was at the pruning
eut. When this was less than 20cm or less than the resolution of the Trupulse
360 (typical for heading and directional cuts), the diameter was estimated
(example; 5, 10, 15 cm increment categories)
Unpruned portions of each crown were measured to gam a base line for
individual tree branch growth. Controllength in many cases was less than 10 cm
per annum. In this case, the length was visually estimated and then categorized
by measuring a totallength portion (i.e. 5 years growth
=
40cm) of the branchindividual yearly segment lengths, and assigning a category (5, 10, 15 cm). ln sorne cases this required the use of standard 10x binoculars to more accurately estimate the individual segment lengths.
1.3.5 Variables influencing rates ofbranch regrowth
A suite of variables was measured that could influence the rates of regrowth into the utility corridor. A complete list is shown in Table 1 and grouped by categories: a) environment, b) whole tree and c) within crown variables. ln sorne cases these variables can be considered proxies for other variables that would be hard to measure in the study design. For example, the distance between stems on V-trim trees could be considered a proxy for light availability, and parent stem diameter could be a proxy for available stored reserves such as carbohydrates. It was assumed that soil and moisture resources are likely to be correlated with the percentage of soil under the crown not covered with hardscaping (generally asphalt, concrete for sidewalks and walkways on private property), and this measure has been used in previous work (USDA 2003, Nowak et al. 2008). Trim type was classified into two categories: V-trims and Side Trims (Dahle et al. 2006). V-V-trims were any tree where the utility corridor passed through the crown, while side trims were exclusively those that did not have crown separated by the utility corridor. Crown size was calculated by measuring the crown width in the two cardinal directions, as well as the total tree height, and the base of the "green" crown, the formula pi*(height-base height)*(0.5* width east/west)*(0.5*width north/south) was then used to give an estimate of the crown volume. Branch height was the measured distance from the ground to the base of sampled growth. The azimuth and inclination of the regrowth was also recorded.
ln total fifty-nine trees were sampled, the numbers of each tree type and number of individual limbs sampled are summarized in Table 2. To account for variance in the number of years since the last pruning episode across our data
- - -
-17
set, all results in this study utilize four years of growth starting from the year of
pruning. This study primarily examines and reports on the annual growth
segments (distance between annual nodes) as a response rather than the total
length of extension since the most recent pruning episode, thereby eliminating a
conflict of sorne samples having five or six years of growth since the last pruning.
1.3.6 Statistical analysis
Ail statistical analysis was completed using
R
A Language andEnvironment for Statistical Computing. Linear Modeling was completed using
the "lm" function in R, while ANOVA's utilized the "aov" function, and Tukey's tests were conducted with the "Tukey HSD" function. In the case of reporting R2 values, the adjusted R2 values (R2
J
are reported whenever multiple variables areincluded in the linear regression analysis. Unless otherwise stated in the results, tests were initially done with the species pooled, then the model fit to each species individually. ~n sorne cases, there was testing to investigate the differences between species, and this is specifically specified in the results or figures. One·way ANOVA testing was used to test differences in means for all group tests such as species, regrowth type or trim type, whereas linear models were fit to ail scalar variables.
1.4 Results
1.4.1 Accuracy ofTrupulse 360 for branch segment length measurements
To assess how weil the laser method captured branch growth, in ·tree
measurements made with a tape measure were compared to the laser derived
measurements made from the ground; using linear regression and examining
how close the slope was to unity as weil as the R2 of the relationship. For the 19
branch samples ofF pennsylvanica, the laser derived measurements for annual
(mean length = 0.52 m, SD = 0.354 m, R2
=
0.98, F (1,92)=
4844, p < 0.001, slope=
0.948) (Figure 2). Results for the total branch length since the last pruning(mean length
=
2.52m, SD=
0.77m, R2=
0.98, F (1,18)=
1223, p < 0.001, slope=
0.998) were similar to those for annual branch growth (total length data not
shown in Fig 2).
1.4.2 Branch growth in response to pruning
Using ANOVA testing (one·way), for all measured years in this study, the documented mean annual branch response growth following pruning was highest
in A. saccharinum, followed by F pennsylvanica, while A. platanoides was the
lowest (Figure 4). Both A. platanoides and F pennsylvanica were signifi.cantly different from A. saccharinum, (p < 0.001); however there was no significant difference between A. platanoides and F pennsylvanica (Figure 4, p < 0.001, Tukey's HSD test).
Linear regression analysis of the length of annual branch response
growth showed a strong decline over time in A. platanoides and F
pennsylvanica, but only moderately in A. saccharinum (Figure 5.) While the
results were significant, there was a lot of variation, as can be seen by the relatively law R2 values, particularly for A. saccharinum. Results are as follows;
ail species, R2a
=
0.169, p < 0.001 N=
734; F pennsylvanica, R2=
0.01, p < 0.05,N
=
369; A. platanoides, R2=
0.14, p < 0.005, N= 278
; A. saccharinum, R2=
0.005, p > 0.05, N
=
252. Comparing species, the rate of decline was grea test forA. platanoides (slope
=
·0.07) followed by F pennsylvanica (slope=
·0.03) andthen A. saccharinum (slope
=
·0.02) (Figure. 5). For all species, annual growth length of pruning response branches was much grea ter than un ·pruned (control) branch growth (Two sample t·test, mean annual response growth length=
0.66 m, mean control growth length=
0.15 m, p < .001). Maximum length growth was generally found during the fust year following pruning and reached approximately 1.5 m for all three species (Figure 5).19
1.4.3 Assessment ofbranch growth predictors
Of ali the branch growth predictors tested, only a few showed significant
relationships with regrowth rate. The correlation table (Table 3) lists respective variable relationship strength. In each case, we fust tested the relationships with the species pooled (across all species data pooled together), and then separately within species.
Across ali species pooled, directional prunmg growth was significantly
different from bath epicormic growth and heading eut growth (Tukey's HSD test
p < 0.001) and resulted in the slowest branch growth foliowing pruning, there
was no significant difference between heading and epicormic growth. Within each species, results from the Tukey's test varied slightly (Figure 6), for A.
platanoides directional pruning was significantly different (p < 0.001) from bath
epicormic growth, and heading eut growth, while epicormic growth and heading eut growth response was not significantly different. In the case of A.
saccharùwm each type of response was significantly different (p < 0.05), while
for F pennsylvanica only heading growth was significantly different from the
other two groups (p < 0.05).
The linear regression analysis of annual length on inclination while
testing for species interaction yielded R2a
=
0.11 F (5,729)=
18.8, p < 0.001, slope=
0.002, N=
730. Within each species the results are as foliows; Fpennsylvanica, R2 = 0.07, F (1,337) = 27.44, slope = 0.003, N = 338, p < 0.001; A.
platanoides, R2 = 0.14, F (1,208) = 35.54, p < 0.001, slope = 0.008, N = 209; A.
sacchaânum, R2 = 0.007, F (1,188) = 1.46, p > 0.05, slope = -0.002, N = 189
(Figure 7).
Height of the origin of regrowth had a weak negative correlation with
regrowth rate in A. saccharinum (R2 = 0.04, F (1,188) = 7.81, p < 0.05, slope =
-0.05, N
=
189), where growth originating higher on the tree was typicaliy shortersignificant or very weak in the other spec1es (F pennsylvanica, R2 = 0.0003, F(1,337) = 0.11, p < 1.0, slope = -0.004, N = 338; A. platanoides, R2=0.02, F(1,204)
=
3.99, p < 0.05, slope = -0.06, N = 205).Of the tree size variables investigated, only parent stem diameter (the
size of the limb the regrowth originated from) showed significant results (p < 0.001), pooled species R2 = 0.02, F(1, 733) = 20.56, p < 0.001, slope =0.005, N =
734), and only A. saccharinum showed a signi:ficant relationship between stem
diameter and regrowth (R2 = 0.06, F (1,188) = 13.28, p < 0.001, slope = 0.007, N =
189). The other species showed no significant relationship between stem or tree
size and response growth rate (Table 3).
1.5 Discussion
For the species investigated in this study we found that internode lengths
of pruning response growth was generally longer than the 10 cm resolution limit
of the Tru pulse 360. Our laser measurement validation results show that within
the bounds of this resolution, the Trupulse 360 can provide a safe, efficient and
effective way of measuring branch elongation growth in trees. This has allowed
us to further develop our method and test for several abiotic and biotic factors
affecting branch regrowth rates.
As others have previously shown (Rom and Ferree 1985, Goodfellow et al.
1987, Krueg~r et al. 2009), pruning or defoliation can elicit an increase in growth
rate, specifically branch elongation. In this study, we also found that branch elongation into the recently pruned utility corridor area was shown to be much greater compared to unpruned portions of the crown. Growth was generally greatest in the fust year following pruning and declined with time (Figure 5). One exception to this pattern was A. saccharinum. However the method could
not determine the specifie timing of pruning within a growing season; given the
lower mean growth in the fust year's growth for A. saccharinum compared to the other species, it is possible that several of the trees sampled were pruned late in
21
the growmg season which resulted in a shorter period of time for branch
regrowth. This illustrates one of the limitations of the study, as exact pruning
dates are not known. Another limitation is possible variance in environmental
factors and sorne tree size differences among tree species (see appendix) that
must be taken into consideration. Further sampling of a much larger data set
could provide clearer answers now that the methods have been developed.
Few of the abiotic factors investigated for their influence on branch length
growth showed a significant effect on regrowth rate (Table 3), while many of the
biotic factors investigated were shown to affect regrowth rates: (1) species, (2)
inclination angle of the growth response of branches (mainly positive), and (3)
regrowth height (negative).
Inclination angle was expected to be correlated with growth length due to
the relation to phototropism and geotropism (Chen et al. 1999, Sperry and
Chaney 1999). The study found a slight positive relationship with increasing
inclination angle for A. platanoides and F pennsylvanica but not for A.
saccharinum: This last finding may hint at the ability to forage for available
light. This result has direct implications for utility clearance; where A.
saccharinum is concerned greater horizontal distances from the utility (then
typical) may be suggested to maintain clearance schedules.
Height of the origin of regrowth was negatively correlated with regrowth
rate in A. saccharinum but not in A. platanoides or F pennsylvanica. One
, possible explanation could a decreased shading effect, where the lower scaffold
limbs distal to the trunk and below the pruning corridor were being pruned,
compared to more interior upper sections of the main stems · potentially shaded
by the upper crown. Another explanation could be greater hydraulic conductivity
lower on the parent stem (Ryan and Yoder 1997, Becker et al. 2000, Ryan et al.
2006), but given the narrow range of heights measured in this study further
studies are warranted.
Tree size including trunk diameter, crown volume and parent stem
could be utilized in early growth before branch autonomy began (Chapin et al.
1990, Magel et al. 2000, Kosola et al. 2001, Mediene et al. 2002). Overail crown volume and trunk diameter showed no significant effect. Parent stem diameter for A. sacchaTinum showed significant results but with a very low R2.
The utility arboriculture industry has long been supportive of usmg pruning practices that minimize wounding and decrease return times by
selecting pruning practices that reduce fast growing epicormic growth, or
suckering. Our research shows that internodal heading cuts produced the longest
regrowth, while directional pruning back to a lateral branch 113 the parent stem
diameter produced the shortest response growth (Figure 6). Furthermore,
variance in the length of growth was lower for directional pruning response then
epicormic growth or heading cuts. These results provide strong support to continuing promotion of directional pruning within the arboriculture industry
and further studies to investigate the mechanisms involved in this lower
response.
Available nutrient and moisture resources have been linked to tree growth rates (Krizek and Dubik 1987, Grabosky and Bassuk 1995, Grabosky and Gilman 2002), however our study suggests that response rate from pruning in generaily healthy trees may not be affected by the gradient of hardscape
coverage in typical suburban environments where root exploration ailows for
access to root substrate over a much larger area then is exposed at the surface.
Furthermore, the relatively broken hardsurface of the areas studied may ailow
for a high amount of moisture infiltration. This may not be the case in a newer
setting where the hardscape is still relatively impervious, or in a more dense
urban environment where tree pits are much more confined spaces.
The study coilected data on three variables that could be correlated with available light levels at the pruning sites; Trim type (V ·trim vs Side-trim),
distance between V ·trim main stems at phase height (giving an indication of the opening in the crown), and V-trim azimuth (light penetration through opening
23
species, or at a species level. We presume that we did not pick up any signal due
to the relative high light environment, where overall most of the trees studied
were in generally high light conditions.
1. 6 Conclusion
The validity of utilizing the Trupluse 360 as a deviee for measurmg
branch extension for regrowth following pruning has been proven. This method
allows for the safe and efficient data collection at an effective rate. While there is
great variation in branch growth following pruning, several key predictors have
been identified. As predicted, species had an effect on growth rate, with A.
saccharinum showing the highest rate of growth following pruning. Inclination
angle of regrowth had a small positive effect on two of the species (F.
pennsylvanica and A. platanoides), and little effect on A. sacchali.num. This has implications for spatial planning around utility corridors where Acer
saccharinum exist, as more clearance may be required due to the propensity to
develop strong horizontal growth. Pruning method had a strong effect on growth
rate, and the data support industry initiatives to promote directional pruning in
the utility corridor to reduce the rate of regrowth. While a few factors were identified as significantly affecting branch regrowth, the high proportion of
re-growth not accounted for points for the need to investigate further other possible
factors. Factors such as overall tree vigour, carbohydrate storage, the timing of the pruning, and hydraulic position within the crown are possibly promising factors for future studies.
.
....
...
' H\0" .,. ••
----
_...,..
Figure 1.1: Method for measuring branch
length. The Trupulse 360 measures distance
to target, inclination, and azimuth. It can
then calculate the straight line distance between two targets.
s
~1.2 M Q) ens
a. ::J.=
> .c "C 0.8 ~ ::J en ro Q) ~.,
ro=
go.4 Q) _J 0.4 0.8 1.2Length as Measured by LinearTape Measure (m)
Figure 1.2: Correlation of laser (Trupulse 360) and in-tree linear tape measurements of annual pruning
response growth in F pennsylvanica . Mean length
=
0.52 m SD
= 0
.354, R2= 0.98, F (1
,92)= 4844
, p <0.001, slope = 0.948, N = 93
/
3a: Epicormic growth--
...
_
1 1 r allftllt Ill J>NninlI
·V
1 1lA
1 11
1 3b: Directional eut and typical measurement 3c: Heading eut and typical regrowth2.0
g
..c:'i
0 (5 1.5 Q)"'
c: 0 c."'
Q) a::: a1.0 E c: ::J à:ro
::J êo.s <( 0.0•
••
•
ba
a 1 ~---r---~---,---~A. plaunoldes A. s.sa:harinum
Spedes
F. pennsylvanics
Figure 1.4: Comparison of annual pruning
response growth for three urban tree species since the last pruning episode. The dark line of each boxplot represents the median, the upper
and lower hinges are 75th and 25th percentiles
respectively, whiskers extend to highest and
lowest values within the 1.5 inter-quartile
range. Data points beyond the whiskers are outliers. Boxplots with same letters are not significantly different, Tukey's honestly significant difference HSD p < 0.001, N =734.
! t 1 t
:
~
·!:
.
.
.
••
• • • • 1 : 1 1 : ----. ... ·· • ---· · -"' · - --. .. .. L ·-· l t •-·
'
u-.
.
·
]
....
.
··
··
---·
=
--·---=
-
----1
..
.
.
...
'---· ' '•
28 A. s.cchannum.
.
.
.-,
... .----·-.
-·....
..
..
...
···-· . .•
•
Figure 1.5 :. Relationship between length of annual growth and number of years elapsed since the last pruning episode . Linear regression of annuallength on time with species interaction yielded ; R 2=
0 . 169 , p < 0.001 , slope=
· 0.18 N=
734 . F pennsylvanica , R 2=
0 . 01 , p < 0 . 05 , slope=
· 0.03 , N=
369 ; A . platanoides , R 2=
0.14 , p < 0.005 , slope=
·0.07 , N=
278; A. saccharinum , R 2=
0 . 005 , p > 0.05 , slope=
·0.02 , N=
252 ' - -- -- - ---~ ---- ---29 A . latanoldes A. saccharlnum F _ pennsylvanlca 1 . 15 1 7~ 1 . 75 1. !10 1!10 1