1
This article has been accepted for publication in Injury prevention following peer review, and the Version of Record can be accessed online at
http://doi.org/10.1136/injuryprev-2018-043125 © Authors 2019
2
Spatial distribution of roadway environment features related to child pedestrian safety by census tract income in Toronto, Canada
Linda Rothman PhD (corresponding author) Child Health Evaluative Sciences
The Hospital for Sick Children 555 University Ave Toronto, Canada M5G 1X8 [email protected] 416-813-6919 Marie-Soleil Cloutier PhD
Centre Urbanisation Culture Societé, Institut national de la recherche scientifique (INRS), Montreal, Canada
Kevin Manaugh PhD
Department of Geography and McGill School of Environment, McGill University, Montreal, Canada
Andrew Howard MD, FRCSC, MSc
Child Health Evaluative Sciences, Orthopaedic Surgery, The Hospital for Sick Children, Toronto, Canada
Alison Macpherson PhD
School of Kinesiology and Health Science, York University, Toronto, Canada Colin Macarthur MBChB, PhD
Child Health Evaluative Sciences, The Hospital for Sick Children, Toronto, Canada
Word count: 2285 Reference count: 29
3
ABSTRACT
Background: An important consideration in urban planning is safe and convenient walking environments for pedestrians. Investments in traffic calming infrastructure and other street design features can enhance pedestrian safety as well as contribute to the ‘livability’ of neighborhoods. Pedestrian motor vehicle collisions (PMVC) in urban areas, however, remain common and occur more frequently in lower income neighborhoods. While risk and protective features of roadways related to PMVC have been identified, little research exists examining the distribution of roadway features. This study examined the relationship between roadway features related to child pedestrian safety and census income status in Toronto, Canada. Methods: Spatial cluster detection based on 2006 census tract data identified low-income and high-income clusters in Toronto. Police-reported data of PMVC involving children between the ages of 5-14 years were mapped using GIS. Also mapped were road environment features (densities of speed humps, crossing guards, local roads, one-way streets, and missing sidewalks). Multivariate logistic regression was used to examine the relationship between roadway
environment features (independent variables) and cluster income status (dependent variable), controlling for child census tract population.
Results: There were significantly fewer speed humps and local roads in low- versus high-income clusters. Child PMVC rates were 5.4 times higher in low- versus high-income clusters.
Conclusion: Socioeconomic inequities in the distribution of roadway environment features related to child pedestrian safety have policy and process implications related to the safety of child pedestrians in urban neighbourhoods.
4
What is already known on this subject:
Pedestrian-motor vehicle collisions are common
Pedestrian risk is increased in socially disadvantaged areas
Few studies have specifically addressed socioeconomic inequities related to the roadway built environment
What this study adds:
Differences in the distribution of road environment features related to child pedestrian safety were found between low- and high-income areas in Toronto, Canada
Differences in the distribution of roadway environment features by income status may, in part, explain the socioeconomic inequity in child pedestrian motor vehicle collision rates
5
INTRODUCTION
In the urban planning context, walking as a mode of transportation is valued, because of the well-established environmental, health, and social benefits. From the safety perspective; however, pedestrian motor vehicle collisions (PMVC) are an important cause of death and disability. The PMVC fatality rate among children 0-14 years in Canada is around 0.3/100,000/year, accounting for almost one third of all road user fatalities among children.1
Pedestrian risk is increased in socially disadvantaged areas. Among children 0-14 years, the risk of death because of PMVC increases by 13% per unit change in census income quintile from highest to lowest in Canadian urban areas.2 This inverse association between socioeconomic status and PMVC has been noted in urban settings in western countries since the 1950s.3
Disparities in PMVC rates between low- and high-income areas may be explained by differences in: traffic speed, vehicle and pedestrian volumes, unsupervised walking to school, and the
roadway built environment.
Major roadways (a proxy for vehicle speed) and higher traffic volumes have been shown to be more common around schools in low income areas.4 Indicators of lower socio-economic status, such as less car ownership and lower parental education, have been associated with more road crossings and less supervision of children while walking to school.5-7 Some authors have also identified a “spatial displacement of risk”, whereby the combination of street hierarchy and socio-economic factors, lead to an increased pedestrian risk in lower income neighbourhoods as non-local drivers move through the neighbourhood.8
With regard to the built environment, there is good evidence that traffic calming measures - generally found on lower speed residential roads - reduce the frequency and severity of
pedestrian injuries by 50%-75%.9,10 Roberts et al suggested that 18 child pedestrian deaths per year could be prevented in New Zealand if funds were redirected to traffic calming rather than to education.11 Rothman et al found a 43% reduction in child PMVC following the installation of speed humps in the City of Toronto,12 and Tester found a 2.5–fold lower odds of a child PMVC if living within a block of a speed hump.13
In addition to modification of the roadway environment, such as installation of speed humps, other child pedestrian safety approaches include speed limits, enforcement of traffic laws, school crossing guards, and “Safe Routes to School” programs. Although walkability of
6
neighbourhoods have been related to income level in general, few studies have specifically addressed socioeconomic inequities in the roadway built environment that specifically relate to children.14,15 Zhu et al found differences in neighbourhood level versus street level walkability for children around schools with differing poverty levels. Schools with higher poverty rates had better neighbourhood –level walkability (e.g. percentage of students living close to the school and sidewalk completeness and worse street level conditions (e.g. fewer physical amenities, lower perceived safety).16Social equity concerns - unlike environmental and economic concerns - have not yet been widely adopted as a considerations in pedestrian planning, and it is likely that issues vary in different urban areas.17 The primary objective of this study was to examine the relationship between income (at the level of census tract) and roadway environment features related to child pedestrian safety in the City of Toronto, Canada. A secondary objective was to examine the relationship between income and risk of child PMVC.
METHODS
Socioeconomic status at the census tract level was measured using 2006 Canadian Census data, and based on the percentage of households below the after tax low income cutoff (ATLICO).18 PMVC data involving children (5-14 years) over the 10-year period 2001-2010 were obtained from Toronto Police Services, and mapped by census tract. PMVC rates were calculated using the roadway length as the denominator. Highways and freeways were excluded. Police data include information on the age of the pedestrian, and the date, time, and location of collision (x, y coordinates). Population data on children (5-14 years) in Toronto were obtained from the 2006 Canadian census.
Data on roadway environment features related to child pedestrian safety were obtained from the City of Toronto and Toronto Police Services. Data were collected on: speed hump density as of 2012 (#/100 km road), local road density (km/10 km road), school crossing guard density as of 2014 (#/10 km road), one-way street density (km/10 km road) and missing sidewalk density (km/10 km road), and mapped onto census tracts. Local roads are defined by the City of
Toronto, as having low traffic speed (40-50 km/hr), and a daily motor vehicle traffic volume of < 2,500 vehicles per day.19 Of note, other traffic calming measures based on street design, such as traffic circles and chicanes, are known to be effective in reducing pedestrian risk. However,
7
because speed humps represented 99.5% of all street design calming measures in Toronto (as of 2011), only speed hump density was included in the analysis.20
Spatial cluster analysis
Spatial analyses were used to identify clusters of low- and high-income census tracts. A priori, a decision was made to examine the extremes of the socioeconomic spectrum, given the disparity in PMVC frequency between low- and high-income areas. Spatial distribution of census tract socioeconomic status was determined using the local Moran’s I tool (in ArcGIS 10.3) to identify clusters of census tracts with significantly low (cold spot) or high (hot spot) low-income
values.21,22 A cluster is identified when one CT is similar or dissimilar to its neighbouring CTs. Local Moran’s I detects clusters by comparing the actual spatial distribution under a null
hypothesis of complete spatial randomness. The analyses were conducted by setting the parameters to consider the inverse (Euclidian) distance without any distance threshold limit, meaning “nearby neighbouring features have a larger influence on the computations for a target feature than features that are far away.”23 A p-value of <0.05 was used to identify clusters of low-income and high-income census tracts. PMVC and roadway environment features were mapped onto the low- and high-income clusters.
Statistical analysis
Univariate comparison of low- and high-income census tract clusters by roadway environment features compared mean values of features using two-tailed T-tests. Multivariate logistic regression used income cluster (low versus high) as the dependent variable. Roadway environment features that were significant in the univariate analyses were entered into the multivariate logistic regression model as independent variables by order of least significance, and removed if not significant at p<0.05, after controlling for child population. Multicollinearity was assessed by determining if the tolerance was < .20 if the variance inflation factor (VIF) was >10. Odds ratios and 95% confidence intervals were calculated. A secondary analysis examined the distribution of PMVC in low- versus high-income clusters and used t-tests to examine differences in mean age, and Pearson’s chi-square test to examine differences in proportions of police-reported injury severity (none, minimal, minor, major).
8
There were 524 census tracts identified in the study area; 44 of these census tracts (8%) were low-income clusters and 58 census tracts (11%) were high-income clusters. Over the 10-years of study, there were a total of 2,185 PMVC involving children 5-14 years. Of these, 344 PMVC occurred in the census tracts identified by the spatial analysis with 212 PMVC in low-income clusters and 132 PMVC in high-income clusters.
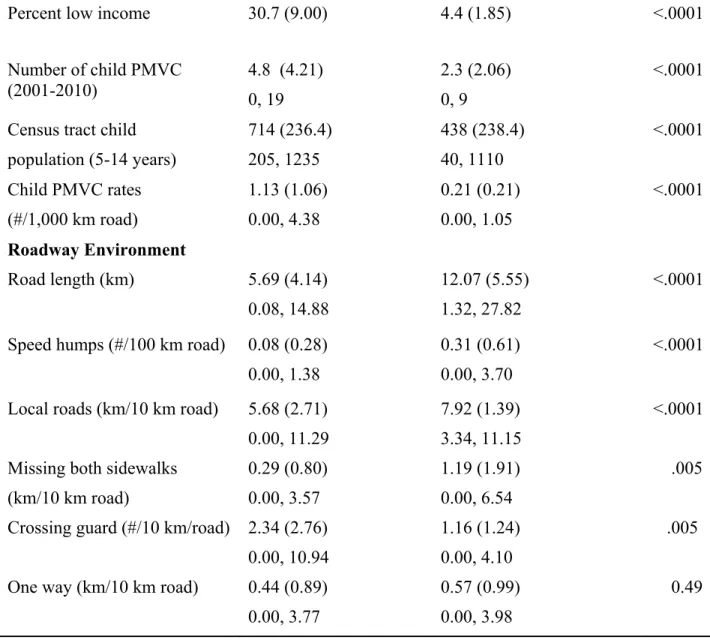
The proportion of low-income families was almost 7 times higher in the low-income versus high-income clusters (Table 1). The average number of children (5-14 years) in low-income cluster census tracts was 714, compared with 438 children in high-income clusters. The child PMVC rate was 5.4 times higher in low-income compared to high-income clusters (1.13/1,000 km road/10 years and 0.21/1,000 km road/10 years, respectively).
With respect to roadway environment features, there was no significant difference in one-way street density between low- and high-income clusters. All other roadway features; however, were significantly different based on the univariate analyses (Table 1). For example, speed hump density was almost 4 times lower and local road density was 1.4 times lower in census tracts in low-income clusters compared to those in high-income clusters. In high-income clusters; however, road length was 2 times and missing sidewalk density was 4.1 times higher, compared to low-income clusters. Last, school crossing guard density was twice as high in census tracts in low-income clusters, compared to those in high-income clusters. Of note, 90% of crossing guards in census tracts in low-income clusters and 95% in those in census tracts in high-income clusters were located at intersections with at least one arterial road. In total, 37% of the road network was made up of arterial roads in clusters in low-income clusters, compared to only 27% in high-income clusters.
Table 1: Descriptive statistics comparing low- and high-income clusters in the City of Toronto Low-income N = 44 census tracts Mean (SD) Minimum, Maximum High-income N = 58 census tracts Mean (SD) Minimum, Maximum P value
9
Percent low income 30.7 (9.00) 4.4 (1.85) <.0001
Number of child PMVC (2001-2010) 4.8 (4.21) 0, 19 2.3 (2.06) 0, 9 <.0001 Census tract child
population (5-14 years) 714 (236.4) 205, 1235 438 (238.4) 40, 1110 <.0001 Child PMVC rates (#/1,000 km road) 1.13 (1.06) 0.00, 4.38 0.21 (0.21) 0.00, 1.05 <.0001 Roadway Environment Road length (km) 5.69 (4.14) 0.08, 14.88 12.07 (5.55) 1.32, 27.82 <.0001
Speed humps (#/100 km road) 0.08 (0.28) 0.00, 1.38
0.31 (0.61) 0.00, 3.70
<.0001 Local roads (km/10 km road) 5.68 (2.71)
0.00, 11.29
7.92 (1.39) 3.34, 11.15
<.0001 Missing both sidewalks
(km/10 km road) 0.29 (0.80) 0.00, 3.57 1.19 (1.91) 0.00, 6.54 .005 Crossing guard (#/10 km/road) 2.34 (2.76)
0.00, 10.94
1.16 (1.24) 0.00, 4.10
.005 One way (km/10 km road) 0.44 (0.89)
0.00, 3.77
0.57 (0.99) 0.00, 3.98
0.49 NS = not significant
Significant correlates in the final multivariate logistic regression model, after adjusting for child population, are shown in Table 2. There was no evidence of multicollinearity.
Table 2: Adjusted odds ratios and 95% confidence intervals of low income census tract clusters and features of the roadway environment
Roadway Environment Adjusted Odds Ratios (95% CI)
Child population (5-14 years) Speed humps (#/100 km road)
1.00 (1.00, 1.01) 0.09 (0.01, 0.77)
10
Local road (km/10 km road) 0.61 (0.46, 0.82)
Multivariate analysis showed that speed humps and local roads were significantly less likely in low-income compared to high-income clusters (OR 0.09; 95% CI: 0.01, 0.77, OR 0.61; 95% CI: 0.46, 0.82 respectively).
For illustrative purposes only, the distribution of speed humps in a randomly selected area of the city is shown in Figure 1 to highlight the differences between low-income and high-income clusters.
Child PMVC rates were over 5 times higher in low-income cluster, compared with high-income clusters. Figure 2 shows the spatial distribution of child PMVC rates by census tract cluster. Many high-income census tracts did not have any collisions (n=17/58, 29%). The average age of children injured in low-income was marginally higher than those in high-income clusters (10.82 vs 10.17, p = .04). There were no significant differences in police-reported injury severity by cluster. In total, 15 children had no injury (4%), 135 (39%) had a minimal injury, 171 (50%) had a minor injury requiring a visit to the emergency department, and 23 had major injuries (7%) requiring hospital admission. There were no fatalities over the 10-year time period.
DISCUSSION
This study found differences in the distribution of road environment features related to child pedestrian safety between low- and high-income census tract clusters in the City of Toronto, Canada. There were lower densities of speed humps and local roads in low-income versus high-income clusters. In addition, child PMVC rates were more than five times higher in low-high-income clusters compared to high-income clusters. Of note, Rodgers et al, found that socially deprived areas in England and Wales had substantially more traffic calming than wealthier areas;
however, traffic calming features were scarce in both settings.24
This study utilized local Moran’s I to identify clusters of census tracts with significantly low (cold spot) or high (hot spot) low-income values and then related these clusters to road environment features and PMVC rates. Other recent studies have also incorporated zonal income while examining PMVC and have consistently found inverse relationships between income level and PMVC rate. Each of these studies used different zonal units including
11
residence ZIP, traffic analysis zones (TAZS), block groups (BGs) and census tracts. . The finding of the inverse relationship between income level and PMVC rate can be considered robust due to the consistency in this relationship regardless of the zone and scale used in other studies.25,26
Differences in the distribution of roadway environment features by census tract socioeconomic status in Toronto may, in part, explain the differences in child PMVC rates between low- and high-income clusters. In Toronto, it is the community that generally initiates traffic calming requests, such as installation of speed humps. It is likely that communities differ on knowledge of the political process and levels of political engagement. Higher levels of political engagement are more likely among those with higher socioeconomic status.27 The inequity in spatial
distribution of speed humps in the City of Toronto may be a function of process, and a request-based process that leads to implementation of a proven road safety feature may not be the most equitable method of identifying need.
Low-income clusters also had fewer local roads and more arterial roads, compared to high-income clusters. Local roads have lower posted speed limits and lower vehicle volumes, compared to collector and arterial roads.19 Toronto data showed average vehicle speeds of 35 km/hour on four local roadways (with posted speed limits of 30 km/hr), compared to average vehicle speeds of 49 km/hr on four major arterial roads (with posted speed limits of 60 km/hour). Vehicle volumes were also more than 13 times higher on the major arterial roads (6,156
vehicles/day), compared to local roads (468 vehicles/day).28 Lower vehicle speeds are associated with fewer and less severe PMVC. 29 Based on these data, interventions directed at speed
reduction in lower income areas may be necessary to reduce child PMVC risk.
One limitation of the study is the use of 2006, rather than 2011 Canadian census data to estimate census tract income. The 2006 data were used because the 2011 Canadian census was voluntary and had subsequent data quality issues because of the low response rate.30 It was assumed for these analyses that census tract income status estimates were accurate, given that census divisions within the City of Toronto are well established. Another important limitation of this study (and of most studies of child PMVC) is the lack of comprehensive data on vehicle speed, traffic volume and pedestrian volume reflecting “exposure” to risk. The City of Toronto does not routinely collect traffic speed and volume data on local roadways (where the majority of children
12
walk) or on pedestrian volumes. In this analysis, we used roadway type (local versus arterial) as a proxy for vehicle speed and traffic volume and child population within the census tract as a proxy for pedestrian volume. Finally, it is also important to recognize that the cross-sectional design of this study prevents inferences regarding causality. Therefore, findings are can only be reported as associations between income level, roadway design features and higher risk of PMVC.
Variables that have been used to estimate “pedestrian exposure” include: population within a defined area, pedestrian counts (where available), travel survey data to predict pedestrian activity level and roadway length.26,31-35 As the focus of this study was on the differences in roadway safety features between high and low income areas, it was decided to use the length of roadway as the denominator for the child PMVC rates. Therefore when results indicated that the number of collisions per 1,000 km roadway was higher in census tracts in low income clusters, it implies that there were issues with the roadway itself.Other studies have also used roadway length as a denominator for their collision rates.33-35 Lascala et al emphasize that the length of the roadway system itself is a natural metric for PMVC, in that these collision occur exclusively on or near streets and traffic and pedestrian flow takes place on these streets.35
In the published literature, a New Zealand case-control study found that the inverse association between pedestrian injury and indices of material disadvantage persisted, albeit slightly
attenuated, after controlling for traffic volume and speed.36 In addition, higher school
disadvantage in Toronto (based on a composite index of income, parental education, and single-parent status) was shown to be associated with higher child PMVC rates, even after controlling for child pedestrian volumes (operationalized as proportions of children observed walking to school) as well as roadway features around schools.31 In this study, areas with higher density multifamily dwellings were associated with lower PMVC rates. Traffic calming, school crossing guards and one way streets were associated with higher PMVC rates. These features may be indicators for more hazardous locations, and cross-sectional analysis using historical collision data would not have pick up the safety effects of these features. Subsequent analysis Toronto using pre-post quasi experimental designs found protective effects of traffic calming and a null effect of school crossing guards.12,37
13
CONCLUSION
While socioeconomic differences in the rates of child PMVC have previously been
demonstrated, there has been little research on social inequities in the distribution of roadway environment features. This study showed significant differences in the spatial distribution of road environment features related to child pedestrian safety between low- and high-income census tract clusters in Toronto. The process of implementation of roadway features highlights the issue of procedural equity in transport planning, in other words, who has access to participate and have their voices heard in public decisions on safe infrastructure.38 Objective methods to determine the need for road safety features, such as identifying matrices of intersections by pedestrian collisions, higher speed roadways and dangerous driving citations, are warranted. The results of this study have implications for policies and procedures related to the design of safe
neighborhoods in Toronto and beyond. Policies and procedures must take into account the potential for socioeconomic inequities to ensure safe pedestrian environments for all. ACKNOWLEDGEMENTS
The authors would like to thank the various departments at the City of Toronto. CONTRIBUTOR’S STATEMENT
Linda Rothman was responsible for the conceptual framework and study design, data acquisition, data analysis and interpretation, and writing and editing of the manuscript. Marie-Soleil Cloutier contributed to the conceptual framework and study design, data analysis and interpretation and writing and editing of the manuscript. Kevin Manaugh contributed to the conceptual framework and study design, interpretation and writing and editing of the manuscript. Andrew Howard contributed to the conceptual framework and study design, interpretation of data and editing of the manuscript. Alison Macpherson PhD contributed to the conceptual framework and study design, interpretation of data and editing of the manuscript. Colin Macarthur contributed to the conceptual framework and study design, data analysis and interpretation, and writing and editing of the manuscript. All of the authors approved the final version of the manuscript for publication. CONFLICT OF INTEREST STATEMENT
There is no conflict of interest to report. FINANCIAL SUPPORT
14
This work was funded by a CIHR Team Grant: Environments and Health: Intersectoral Prevention Research, IP2-150706
15
REFERENCES
Figure 1: Spatial distribution of road segments with speed humps in the City of Toronto, 2016
Figure 2: Spatial Distribution of Child PMVC per 1000 km road by CT in the City of Toronto, 2001-2010
1. Transport Canada. National Collision Database Online. 2016; http://wwwapps2.tc.gc.ca/Saf-Sec-Sur/7/NCDB-BNDC/p.aspx?l=en. Accessed November 29, 2018.
2. Birken CS, Parkin PC, To T, Macarthur C. Trends in rates of death from unintentional injury among Canadian children in urban areas: influence of socioeconomic status. Cmaj. 2006;175(8):867.
3. Laflamme L, Diderichsen F. Social differences in traffic injury risks in childhood and youth: a literature review and a research agenda. Inj Prev. 2000;6(4):293-298.
4. Green RS, Smorodinsky S, Kim JJ, McLaughlin R, Ostro B. Proximity of California public schools to busy roads. Environmental Health Perspectives. 2004;112(1):61.
5. Macpherson A, Roberts I, Pless IB. Children's exposure to traffic and pedestrian injuries. Am J Public Health. 1998;88(12):1840-1843.
6. Roberts I, Norton R, Taua B. Child pedestrian injury rates: the importance of" exposure to risk" relating to socioeconomic and ethnic differences, in Auckland, New Zealand. J Epidemiol Community Health. 1996;50(2):162-165.
7. Rao R, Hawkins M, Guyer B. Children's exposure to traffic and risk of pedestrian injury in an urban setting. Bull N.Y. Acad Med. 1997;74(1):65-80.
8. Yiannakoulias N, Scott DM. The effects of local and non-local traffic on child pedestrian safety: A spatial displacement of risk. Soc Sci Med. 2013;80:96-104.
9. Retting RA, Ferguson SA, McCartt AT. A review of evidence-based traffic engineering measures designed to reduce pedestrian–motor vehicle crashes. Am J Public Health. 2003;93(9).
10. Elvik R. Area-wide urban traffic calming schemes: a meta-analysis of safety effects. Accid Anal Prev. 2001;33(3):327-336.
11. Roberts I, Ashton T, Dunn R, Leejoe T. Preventing child pedestrian injury: pedestrian education or traffic calming. Aust J Publ Health. 1994;18(2):209-212.
12. Rothman L, Macpherson A, Buliung R, et al. Installation of speed humps and pedestrian-motor vehicle collisions in Toronto, Canada: a quasi-experimental study BMC Public Health. 2015;15(74).
13. Tester JM, Rutherford GW, Wald Z, Rutherford MW. A matched case-control study evaluating the effectiveness of speed humps in reducing child pedestrian injuries. Am J Public Health. Apr 2004;94(4):646-650.
14. Yu C-Y. Environmental supports for walking/biking and traffic safety: income and ethnicity disparities. Preventive medicine. 2014;67:12-16.
15. Sallis JF, Slymen DJ, Conway TL, et al. Income disparities in perceived neighborhood built and social environment attributes. Health & place. 2011;17(6):1274-1283.
16. Zhu X, Lee C. Walkability and safety around elementary schools: economic and ethnic disparities. Am J Prev Med. 2008;34(4):282-290.
17. Lee RJ, Sener IN, Jones SN. Understanding the role of equity in active transportation planning in the United States. Transport Reviews. 2017;37(2):211-226.
18. Statistics Canada. Low Income Cut-Offs. 2017; http://www.statcan.gc.ca/pub/75f0002m/2012002/lico-sfr-eng.htm. Accessed November 29, 2018.
16 19. City of Toronto. About the Road Classification System. 2013; https://
www.toronto.ca/services- payments/streets-parking-transportation/traffic-management/road-classification-system/about-the-road-classification-system/. Accessed November 29, 2018.
20. City of Toronto TS. Traffic Calming Geodatabase. Toronto2012.
21. Anselin L. Local indicators of spatial association—LISA. Geographical analysis. 1995;27(2):93-115. 22. Lawson AB. Statistical methods in spatial epidemiology. John Wiley & Sons; 2013.
23. ESRI, [computer program]. Environmental Systems Research Institute.; 2017.
24. Rodgers SE, Jones SJ, Macey SM, Lyons RA. Using geographical information systems to assess the equitable distribution of traffic-calming measures: translational research. Inj Prev. 2010;16(1):7-11. 25. Abdel-Aty M, Lee J, Siddiqui C, Choi K. Geographical unit based analysis in the context of transportation
safety planning. Transportation Research Part A: Policy and Practice. 2013;49:62-75.
26. Lee C, Abdel-Aty M. Comprehensive analysis of vehicle–pedestrian crashes at intersections in Florida. Accid Anal Prev. 2005;37(4):775-786.
27. John P. Can citizen governance redress the representative bias of political participation? Public Administration Review. 2009;69(3):494-503.
28. City of Toronto. Unpublished data. Toronto, Canada2018.
29. World Health Organization. World report on road traffic injury prevention. Geneva, Switzerland2004. 30. Statistics Canada. NHS Profile, 2011-About the data. 2016;
https://www12.statcan.gc.ca/nhs-enm/2011/dp-pd/prof/help-aide/aboutdata-aproposdonnees.cfm?Lang=E Accessed August 8, 2018.
31. Rothman L, Macarthur C, To T, Buliung R, Howard A. Motor vehicle-pedestrian collisions and walking to school: the role of the built environment. . Pediatrics. 2014;133(5):776-784.
32. Miranda-Moreno LF, Morency P, El-Geneidy AM. The link between built environment, pedestrian activity and pedestrian–vehicle collision occurrence at signalized intersections. Accid Anal Prev. 2011;43(5):1624-1634.
33. LaScala EA, Gruenewald PJ, Johnson FW. An ecological study of the locations of schools and child pedestrian injury collisions. Accid Anal Prev. 2004;36(4):569-576.
34. Anderson T. Comparison of spatial methods for measuring road accident ‘hotspots’: a case study of London. Journal of Maps. 2007;3(1):55-63.
35. LaScala EA, Gerber D, Gruenewald PJ. Demographic and environmental correlates of pedestrian injury collisions: a spatial analysis. Accid Anal Prev. 2000;32(5):651-658.
36. Roberts I, Norton R, Jackson R, Dunn R, Hassall I. Effect of environmental factors on risk of injury of child pedestrians by motor vehicles: a case-control study. BMJ. 1995;310(6972):91-94.
37. Rothman L, Perry D, Buliung R, et al. Do school crossing guards make crossing roads safer ? A quasi-experimental study of pedestrian-motor vehicle collisions in Toronto, Canada. BMC Public Health. 2015;15:732-738.
38. Newell JP, Seymour M, Yee T, et al. Green Alley Programs: Planning for a sustainable urban infrastructure? Cities. 2013;31:144-155.