Pépite | La formation des extrusions et des intrusions dans un acier martensitique étudiée par les microscopies de pointe
206
0
0
Texte intégral
(2) Thèse de Gulzar Seidametova, Lille 1, 2017. © 2017 Tous droits réservés.. lilliad.univ-lille.fr.
(3) Thèse de Gulzar Seidametova, Lille 1, 2017 Formation of Extrusion-Intrusion in a Martensitic Steel Studied by Advanced Microscopies. 2017. Abstract The particularity of martensitic steels is their complex hierarchical microstructure consisting of prior austenite grains, packets, blocks and laths, the influence of which on the early-stage fatigue deformation at nano-scale is little studied. As a result the objective of this work is to explain the mechanism of extrusion-intrusion pair formation in a 12%Cr martensitic steel during low cycle fatigue at room temperature in regards to the different interfaces creating the material complexity. To achieve the purpose, the fatigue slip markings were thoroughly investigated at the fatigued metal surface with a help of atomic force microscope and then the microstructural evolution was studied directly under fatigue slip markings on the transmission electron microscope thin lamellae extracted by focused ion beam. The atomic force microscope analysis of the specimen surface after each interruption step of low cycle fatigue test revealed two different morphological types of extrusions that were named principal and secondary extrusions. For the latter there was not found any scientific equivalence in the case of martensitic steels in the reviewed literature bank. Additionally, this technique gave an idea about the localization of principal extrusions in the vicinity of different boundaries making the complex martensitic microstructure. The transmission electron microscope investigation of microstructural evolutions under the fatigue slip markings demonstrated the localization of principal extrusions in the vicinity of different martensitic boundaries as well as of fatigue dislocation cell walls, and the localization of intrusions in the boundaries or walls themselves. As for the secondary ones, their localization inside the laths was validated too. The ensemble of results together with the Polak’s model helped to propose the mechanism of formation of fatigue slip markings in the hierarchically organized martensitic steel. Thus, the existing different boundaries and the formed dislocation cells were found to play a definitive role in the creation of intrusions. The extrusion is believed to be the direct result of slip activity of dislocations close to the boundary as well as the result of volume swelling caused by vacancy generation and migration directed by the boundary dislocations. The intrusion is rather a result of vacancy accumulation in the boundaries or walls due to the dislocation movement. As follows, the martensitic hierarchical interfaces and dislocation cell walls are considered to be a source of dislocations and at the same time a sink for vacancies. Keywords: Low Cycle Fatigue, plastic deformation, microcrack initiation, martensitic microstructure, boundary, 12%Cr steel, Persistent Slip Markings, Atomic Force Microscope, Transmission Electron Microscope analysis. 3 © 2017 Tous droits réservés.. lilliad.univ-lille.fr.
(4) Thèse de Gulzar Seidametova, Lille 1, 2017 Formation of Extrusion-Intrusion in a Martensitic Steel Studied by Advanced Microscopies. 2017. Résumé La spécificité des aciers martensitiques est leur microstructure hiérarchisée complexe constituée d’anciens grains austénitiques, de paquets, de blocs et de lattes. L'influence de chaque élément de cette microstructure sur les premières étapes de l’amorçage des microfissures de fatigue est cependant peu étudiée. En conséquence, l’objectif de ce travail est, d’une part, d’expliquer le mécanisme de formation d’extrusion-intrusion par fatigue oligocyclique à température ambiante à la surface d’un acier martensitique à 12% de chrome et, d’autre part, de définir le rôle des différentes interfaces de la microstructure sur la formation des extrusions et des intrusions. Pour atteindre cet objectif, les marques de glissement observées à la surface après sollicitation cyclique ont été étudiées en détail à l'aide de la microscopie à force atomique. L'évolution de la microstructure en dessous des marques de glissement a été ensuite analysée à partir d’observations en microscopie électronique en transmission des sections transverses obtenues par extraction de lames par faisceau d'ions focalisé. L'analyse en microscope à force atomique de la surface de l'échantillon après chaque interruption de l’essai de fatigue oligocyclique a révélé deux morphologies d'extrusions qui ont été appelées extrusions principales et extrusions secondaires. Pour ces dernières, aucune équivalence scientifique dans le cas des aciers martensitiques n’a été mentionnée auparavant dans la littérature. De plus, ces analyses, ont montré que les extrusions principales étaient localisées à proximité des différents joints – des éléments constituant la microstructure martensitique. L’étude des évolutions microstructurales sous les marques de glissement à l’aide de la microscopie électronique à transmission a confirmé la localisation des extrusions principales à proximité des différentes interfaces de la structure martensitique ou des murs des cellules de dislocations, et prouvé la localisation des intrusions dans les interfaces elles-mêmes. Quant aux extrusions secondaires, leur localisation à l'intérieur des lattes a également été validée. L'ensemble des résultats confrontés au modèle de Polak a conduit à proposer un mécanisme de formation des extrusions et intrusions à la surface de l'acier martensitique hiérarchiquement organisé. Ainsi, les différents joints inhérents à la structure martensitique et les cellules de dislocation formées par fatigue jouent un rôle primordial dans la création des intrusions. Nous pensons que l'extrusion serait le résultat direct du glissement des dislocations au sein même de la latte et proches d’un joint, ainsi que le résultat d'un gonflement de volume causé par la génération des lacunes et leur migration vers les dislocations aux interfaces. L'intrusion résulterait plutôt de l'accumulation de lacunes dans les joints ou les parois des cellules de dislocation en raison du mouvement des dislocations. Ainsi, les interfaces de la structure martensitique hiérarchisée et les parois des cellules de dislocations sont à la fois considérées comme source de dislocations et puits de lacunes. Mots clés : fatigue oligocyclique, déformation plastique, nucléation de microfissure, microstructure martensitique, joint microstructural, acier 12%Cr, marque de glissement, microscopie à force atomique, microscopie électronique à transmission. 4 © 2017 Tous droits réservés.. lilliad.univ-lille.fr.
(5) Thèse de Gulzar Seidametova, Lille 1, 2017 Formation of Extrusion-Intrusion in a Martensitic Steel Studied by Advanced Microscopies. 2017. Abstract ...................................................................................................................................................................................... 3 Résumé....................................................................................................................................................................................... 4 List of abbreviations ................................................................................................................................................................... 9 List of symbols .......................................................................................................................................................................... 12. 1.. Introduction ...................................................................................................................... 15. 2.. Literature review .............................................................................................................. 19 2.1. ABOUT MARTENSITIC STEELS .......................................................................................................................... 19. 2.1.1. What is a martensitic steel? .......................................................................................................... 19. 2.1.2. Martensitic transformation ........................................................................................................... 19. 2.1.2.1. Mechanism of martensitic transformation: quenching ....................................................................... 21. 2.1.2.2. Mechanism of martensitic transformation: tempering ....................................................................... 21. 2.1.2.3. Crystallography of martensitic transformation: notion of habit plane and KS relationship ................ 22. 2.1.3. 2.1.3.1. Review of microstructural unit sizes defined by some authors ........................................................... 26. 2.1.3.2. Relationship between units of microstructure and their sizes ............................................................ 29. 2.1.3.3. Disorientation relationships of different interfaces in PA grain .......................................................... 31. 2.1.4 2.2. Martensitic microstructure ............................................................................................................ 23. Conclusions .................................................................................................................................... 33. FATIGUE .................................................................................................................................................... 33. 2.2.1. What is fatigue? ............................................................................................................................ 33. 2.2.2. Fatigue stages ............................................................................................................................... 34. 2.2.3. Fatigue modes ............................................................................................................................... 34. 2.2.4. LCF variables .................................................................................................................................. 35. 2.2.5. Data recording during LCF test ...................................................................................................... 36. 2.3. FATIGUE DEFORMATION ................................................................................................................................ 39. 2.3.1. Low energy dislocation structures produced by cyclic deformation in the bulk of metals ............ 39. 2.3.2. Fatigue behaviour of 9-12% Cr martensitic steels and resulting microstructural evolutions ........ 41. 2.3.3. Mechanisms of fatigue surface relief formation ........................................................................... 48. 2.3.3.1. Dickson model ..................................................................................................................................... 50. 2.3.3.2. EGM model .......................................................................................................................................... 50. 2.3.3.3. Polak’s model ...................................................................................................................................... 51. 2.3.3.4. Grain boundary sliding as a deformation mechanism in monotone and cyclic loading ...................... 53. 2.3.3.5. Deformation of ultra-fine grained steels ............................................................................................. 55. 2.3.4. 2.4. Fatigue crack nucleation ............................................................................................................... 56. 2.3.4.1. Fatigue crack initiation in different metals .......................................................................................... 56. 2.3.4.2. Fatigue crack initiation in martensitic steels ....................................................................................... 59. CONCLUSIONS ............................................................................................................................................. 63. 5 © 2017 Tous droits réservés.. lilliad.univ-lille.fr.
(6) Thèse de Gulzar Seidametova, Lille 1, 2017 Formation of Extrusion-Intrusion in a Martensitic Steel Studied by Advanced Microscopies. 3.. 2017. Experiment ....................................................................................................................... 65 3.1. STUDIED MATERIAL ...................................................................................................................................... 65. 3.1.1. Chemical composition ................................................................................................................... 65. 3.1.2. Phase identification by XRD........................................................................................................... 65. 3.1.3. Microstructural characterization .................................................................................................. 66. 3.1.4. Mechanical properties ................................................................................................................... 74. 3.2. EXPERIMENTAL PROCEDURE OF FATIGUE TEST .................................................................................................... 75. 3.2.1. Specimen concept and sample surface preparation ...................................................................... 75. 3.2.2. Fatigue test and fatigue behaviour ............................................................................................... 76. 3.3. AFM......................................................................................................................................................... 77. 3.3.1. Force curve .................................................................................................................................... 79. 3.3.2. Contact mode ................................................................................................................................ 79. 3.3.3. Intermittent (tappingTM) mode ...................................................................................................... 80. 3.3.4. Image types ................................................................................................................................... 82. 3.3.5. AFM image resolution ................................................................................................................... 82. 3.3.5.1. Vertical resolution ............................................................................................................................... 82. 3.3.5.2. Lateral resolution ................................................................................................................................ 82. 3.3.6. AFM topography image artefacts ................................................................................................. 83. 3.3.7. AFM Peak ForceTM mode ............................................................................................................... 85. 3.3.8. AFM equipment and conditions for the imaging in the present work ........................................... 87. 3.3.9. AFM for studying the fatigue and tensile plasticity ....................................................................... 88. 3.4. 3.3.9.1. AFM in the studies on the different metals and metallic alloys .......................................................... 88. 3.3.9.2. AFM in the studies of martensitic steels ............................................................................................. 90. TEM ......................................................................................................................................................... 95. 3.4.1. 3.4.1.1. Bright field imaging ............................................................................................................................. 95. 3.4.1.2. Imaging of a dislocation....................................................................................................................... 95. 3.4.2. 3.5. 4.. Principle of work ............................................................................................................................ 95. FIB for TEM thin foils preparation ................................................................................................. 96. 3.4.2.1. Principle of work.................................................................................................................................. 96. 3.4.2.2. Extraction of thin lamella for TEM observation ................................................................................... 98. 3.4.2.3. FIB artefacts......................................................................................................................................... 99. 3.4.2.4. FIB for studying the fatigue damage ................................................................................................. 101. CONCLUSIONS ........................................................................................................................................... 101. Study of FSM at the specimen surface ........................................................................... 103 4.1. CHARACTERIZATION OF DEFORMATION RELIEF MORPHOLOGY.............................................................................. 103. 6 © 2017 Tous droits réservés.. lilliad.univ-lille.fr.
(7) Thèse de Gulzar Seidametova, Lille 1, 2017 Formation of Extrusion-Intrusion in a Martensitic Steel Studied by Advanced Microscopies. 2017. 4.1.1. Principal extrusions ..................................................................................................................... 104. 4.1.2. Intrusions ..................................................................................................................................... 109. 4.1.3. Secondary extrusions ................................................................................................................... 112. 4.2. EVOLUTION OF FSM .................................................................................................................................. 113. 4.3. LOCALIZATION OF FSM ............................................................................................................................... 121. 4.4. VALIDATION OF LOCALIZATION OF FSM .......................................................................................................... 124. 4.4.1. Microstructural characterization and some mechanical properties ........................................... 124. 4.4.2. Experimental procedure .............................................................................................................. 127. 4.4.3. Results of AFM observations of deformation relief ..................................................................... 128. 4.5. 5.. CONCLUSIONS ........................................................................................................................................... 131. Study of microstructural evolution under FSM ............................................................. 133 5.1. MICROSTRUCTURAL EVOLUTION IN THE BULK................................................................................................... 133. 5.2. OBSERVATIONS OF LAMELLAE FIB UNDER THE FSM .......................................................................................... 135. 5.2.1. Localization of principal FSM....................................................................................................... 136. 5.2.2. Role of precipitates in FSM localization....................................................................................... 140. 5.2.3. Localization of secondary extrusions ........................................................................................... 141. 5.2.4. Morphology of FSM cross-sections .............................................................................................. 142. 5.2.5. Some dimensions of FSM cross-sections ..................................................................................... 146. 5.2.6. Comparison with the results obtained by AFM profiling ............................................................. 148. 5.3. 5.3.1. SEM-ECCI ..................................................................................................................................... 149. 5.3.2. SEM-EBSD .................................................................................................................................... 150. 5.3.2.1. Image quality ..................................................................................................................................... 151. 5.3.2.2. Orientation Imaging Microscopy ....................................................................................................... 152. 5.3.2.3. Inverse Pole Figure ............................................................................................................................ 153. 5.3.2.4. Line Segment Method ....................................................................................................................... 154. 5.3.3. Results of principal extrusion observations ................................................................................. 154. 5.3.4. Results of secondary extrusion observations............................................................................... 160. 5.4. 6.. COUPLED SEM-ECCI-EBSD-TEM STUDY OF FSM .......................................................................................... 149. CONCLUSIONS ........................................................................................................................................... 164. Formation of extrusion and intrusion ............................................................................. 165 6.1. THE STARTING POINT OF THE MODEL.............................................................................................................. 166. 6.2. THE 12%CR MARTENSITIC STEEL AS AN EASY DEFORMABLE MATERIAL .................................................................. 167. 6.3. VACANCY PRODUCTION AND AGGLOMERATION ................................................................................................ 169. 6.4. NUCLEATION OF EXTRUSION AND INTRUSION ................................................................................................... 171. 7 © 2017 Tous droits réservés.. lilliad.univ-lille.fr.
(8) Thèse de Gulzar Seidametova, Lille 1, 2017 Formation of Extrusion-Intrusion in a Martensitic Steel Studied by Advanced Microscopies. 6.5. 7.. 2017. SUMMARIZED MECHANISM .......................................................................................................................... 175. Conclusions and perspectives ........................................................................................ 177. List of figures .......................................................................................................................................................................... 180 List of tables ........................................................................................................................................................................... 192 References.............................................................................................................................................................................. 194. 8 © 2017 Tous droits réservés.. lilliad.univ-lille.fr.
(9) Thèse de Gulzar Seidametova, Lille 1, 2017 Formation of Extrusion-Intrusion in a Martensitic Steel Studied by Advanced Microscopies. 2017. List of abbreviations AFM. Atomic Force Microscope. bcc. Body-Centered Cubic. BSE. BackScattered Electrons. bct. Body-Centered Tetragonal. BSSA. British Stainless Steel Association. CCT. Continuous Cooling Transformation. COM. Crystal Orientation Map. DMT. Derjaguin-Muller-Toporov model. EBSD. Electron Backscatter Diffraction. ECCI. Electron Contrast Channeling Imaging. EDX. Energy Dispersive X-ray spectrometry. EGM. Essmann-Gösele-Mughrabi model. fcc. Face-Centered Cubic. FIB. Focused Ion Beam. FSM. Fatigue Slip Marking. GBS. Grain Boundary Sliding. GND. Geometrically Necessary Dislocations. GT. Greninger-Troiano. HAB. High Angle Boundary. HAGB. High Angle Grain Boundary. HCF. High Cycle Fatigue. HV. Vickers Hardness. IF. Interstitial Free. IPF. Inverse Pole Figure. IQ. Image Quality. 9 © 2017 Tous droits réservés.. lilliad.univ-lille.fr.
(10) Thèse de Gulzar Seidametova, Lille 1, 2017 Formation of Extrusion-Intrusion in a Martensitic Steel Studied by Advanced Microscopies. KS (K-S). Kurdjumov-Sachs. LAB. Low Angle Boundary. LAGB. Low Angle Grain Boundary. LCF. Low Cycle Fatigue. LMIS. Liquid Metal Ion Source. LSM. Line Segment Method. ND. Normal Direction. NW. Nishiyama-Wassermann. OM. Optical Microscopie. OIM. Orientation Imaging Microscopy. PA grain. Prior Austenite grain. PF. Peak Force. PF-QNM. Peak Force Quantitative Nano-Mechanical. PSB. Persistent Slip Band. PSM. Persistent Slip Marking. RD. Rolling Direction. RT. Room Temperature. SE. Secondary Electrons. SEM. Scanning Electron Microscope. S-N curve. Wöhler curve. SSD. Statistically Stored Dislocations. STEM. Scanning Transmission Electron Microscope. TD. Transverse Direction. TEM. Transmission Electron Microscope. UFG. Ultra-Fine Grained. 2017. 10 © 2017 Tous droits réservés.. lilliad.univ-lille.fr.
(11) Thèse de Gulzar Seidametova, Lille 1, 2017 Formation of Extrusion-Intrusion in a Martensitic Steel Studied by Advanced Microscopies. UTS. Ultimate Tensile Strength. VHCF. Very High Cycle Fatigue. XRD. X-ray Diffraction. YS. Yield Stress (Strength). YM. Young’s Modulus. 2D. Two-dimensional. 3D. Three-dimensional. 2017. 11 © 2017 Tous droits réservés.. lilliad.univ-lille.fr.
(12) Thèse de Gulzar Seidametova, Lille 1, 2017 Formation of Extrusion-Intrusion in a Martensitic Steel Studied by Advanced Microscopies. 2017. List of symbols a. Lattice parameter. a A. Radius of circular ion beam profile on the sample surface Total tensile elongation. Au. Total uniform elongation. Creq. Chromium equivalent. D. Grain size. D. Diffusivity coefficient. Dg. Grain size. D. Packet size or deformation value. dg. Prior austenite grain size. db. Block width. dpacket. Packet size. dblock. Block size. dCottrell. Cottrell atmosphere thickness. E. Modulus of elasticity or Young’s modulus. Ei. Indenter Young’s modulus. Emig. Migration energy. F. Force. Fadh. Adhesion force. f. Frequency. HVickers. Vickers hardness. k. Spring constant or stiffness. k. Thermal conductivity. kB. Boltzmann’s constant. l. Length of extrusion. 12 © 2017 Tous droits réservés.. lilliad.univ-lille.fr.
(13) Thèse de Gulzar Seidametova, Lille 1, 2017 Formation of Extrusion-Intrusion in a Martensitic Steel Studied by Advanced Microscopies. Mf. Martensite finish temperature. Ms. Martensite start temperature. Nb. Number of blocks. Np. Number of packets. Nieq. Nickel equivalent. P. Beam power. R. Stress (strain) ratio or tip radius. Rε. Strain ratio. T. Temperature. t. Time. V. Variant. w. Block width. x. Vacancy path. α. Ferritic phase. α'. Martensite. γ. Austenitic phase. Δz. Cantilever deflection. Δε. Strain range. Δεpl, Δεp. Plastic strain range or variation. Δεel, Δεe. Elastic strain range or variation. Δεt. Total strain range or variation. Δσt. Total stress range. ε. Strain. εa. Strain amplitude. εel, εe. Elastic strain. 2017. 13 © 2017 Tous droits réservés.. lilliad.univ-lille.fr.
(14) Thèse de Gulzar Seidametova, Lille 1, 2017 Formation of Extrusion-Intrusion in a Martensitic Steel Studied by Advanced Microscopies. εm. Mean strain. εmax. Maximum strain. εmin. Minimum strain. εm. Mean strain. εpl, εp. Plastic strain. έ. Strain rate. θ. Diffraction angle. ν. Poisson’s ratio. νi. Indenter Poisson’s ratio. νjump. Jump frequency. νvib. Vibrational frequency. σ. Stress. 2017. 14 © 2017 Tous droits réservés.. lilliad.univ-lille.fr.
(15) Thèse de Gulzar Seidametova, Lille 1, 2017 Introduction. 2017. 1. Introduction Fatigue of metals and metallic alloys is often a reason of failure in aircraft, car industry, nuclear equipment etc. Fatigue of material means damage as a result of repetitive loading. The majority is aware that the crack and failure are a manifestation of the final damage, but the cracking takes its roots in the initial accommodation of damage which is present on the material surface but invisible for a naked eye. In the case of homogeneous materials the “roots” of crack are often believed to be in the extrusions and intrusions at the surface. After initiation at the free surface in the intrusions, the cracks propagate inside the bulk of material. The propagation can be intergranular or transgranular but it is often of a mixed character. The fatigue cracking is often considered in the frame of fracture mechanics, while the mechanisms of emergence of crack precursors – persistent slip bands (extrusions + intrusions), and microcrack or short crack propagation are more frequently studied form the point of view of material science. The extrusion-intrusion at the metal surface is believed to be a result of dislocation activity in the material during cycling and represents the irreversibility of plastic deformation. The development of these precursors happens during a large number of cycles of structure lifetime. Once the mechanism of their development is understood, the mechanism of crack formation can be easier revealed too. The point is that the “before cracking” stage is not negligible and needs to be studied. The precursors of cracks were investigated by such authors as Mughrabi, Man, Polak, Vogt, Basinski, Essmann and many others [1]–[7]. Different materials were studied by them: copper single crystals and polycrystals, austenitic and ferritic steels, aluminium etc. The most prominent result was the revealing of a ladder-like structured persistent slip bands (PSB) in high stacking fault energy face-centered cubic (fcc) metals and development of a fatigue crack at the interface between PSB and material matrix (Figure 1-1).. 15 © 2017 Tous droits réservés.. lilliad.univ-lille.fr.
(16) Thèse de Gulzar Seidametova, Lille 1, 2017 Introduction. 2017. Figure 1-1 One of the scenarios of fatigue crack development in a metal The ladder-like PSB was observed principally in the metals or metallic alloys that have fcc crystal structure and consist of rather large grains (a few tens of microns). They also have a dislocation microstructure quite well studied. As for the body-centered cubic (bcc) metals they are represented mainly by ferritic and martensitic steels in the industry subjected to the fatigue problems. The development of a deformation relief preceding the cracking is less studied for these materials especially for the martensitics. The latter have a complex and very fine microstructure comparing to ferritics which possess the equiaxed big grains. The fatigue of martensitic steels was essentially studied for temperatures higher than room temperature. The mechanical aspect of fatigue life of these steels is well studied by some authors [8]–[10]. Many authors observed the intergranular cracking of martensitic steels in the environments different than air [11]–[13]. Some scientific works report the localization of extrusions in different interfaces comprised in the steel [14], [15]. But for the moment to our knowledge nobody tried to explain the microstructural reasons of the initiation of cracks (i.e. initiation of extrusions and intrusions) in these hierarchically-structured steels at room temperature and in air. The purpose of the present work is to explain the mechanism of extrusion-intrusion pair formation in a 12%Cr martensitic steel during Low Cycle Fatigue (LCF) at room temperature. The studied X19CrMoNbVN11-1 steel possesses a good resistance to corrosion and thermal shock, and good creep properties. It is usually used in aerospace industry for clamp rings and cooled turbine discs, and in marine and land-based machines for construction of gas turbine. 16 © 2017 Tous droits réservés.. lilliad.univ-lille.fr.
(17) Thèse de Gulzar Seidametova, Lille 1, 2017 Introduction. 2017. rotors and blades, various steam turbine components and fasteners for high temperature environments. The mentioned above components are certainly subjected to fatigue loading in service. The results obtained in this work have a direct impact on the reliability of this material. The second chapter of this Ph.D. thesis is devoted to the review of the existing knowledge on concerned issue, i.e. the review of martensitic steel transformation and morphology, and of the LCF damage of metallic materials. The third chapter is designed to describe the studied material, the main steps of experimental procedure and the main techniques of material analysis before and after the mechanical tests. In the fourth chapter the morphology of deformation relief is characterized by Atomic Force Microscope (AFM) after each interruption of LCF test. Consequently, in the fifth chapter the microstructural evolution is studied directly under Fatigue Slip Markings (FSM) with Transmission Electron Microscope (TEM) thin lamellae extracted by Focused Ion Beam (FIB). The coupled SEM-EBSD-ECCI study of FSM on the specimen surface will reveal the slip systems of extrusions. And finally, the model describing the origin of extrusion-intrusion in the studied martensitic steel will be proposed in the chapter 6.. 17 © 2017 Tous droits réservés.. lilliad.univ-lille.fr.
(18) Thèse de Gulzar Seidametova, Lille 1, 2017 Introduction. 2017. 18 © 2017 Tous droits réservés.. lilliad.univ-lille.fr.
(19) Thèse de Gulzar Seidametova, Lille 1, 2017 Literature review. 2017. 2. Literature review This chapter is designed for the reviewing of literature concerning the thesis objective. It contains 4 subchapters. In the first subchapter the notion of martensitic steel will be defined and the main aspects of martensitic transformation will be considered. The second one is dedicated to the fatigue phenomenon. Some general knowledge and the known mechanisms of fatigue deformation will be described. The third subchapter represents a summary of a few scientific works done on the monotonic and cyclic deformation of martensitic steels. The final subchapter is a conclusion of this bibliographic study.. 2.1 About martensitic steels 2.1.1 What is a martensitic steel? Martensitic steels are quenched steels with crystallographic structure close to the ferritic steels with a body-centered tetragonal (bct) crystal lattice or sometimes if the carbon content is lower than 0.02% with a body-centred cubic (bcc) crystal lattice. Another feature, defining the martensitic steel, is a particular lath or needle (plate) morphology of the alloy. Usually the martensitic steels are tempered after quenching. Due to this heat treatment the martensitic steel combines good hardness and high toughness. Untempered martensitic steel possesses low toughness which makes it brittle. According to British Stainless Steel Association (BSSA) they are classed as a "hard" ferro-magnetic group.. 2.1.2 Martensitic transformation Martensite is a metastable phase formed in steels by the rapid cooling (quenching) of austenite, where carbon is in solid solution, at such a high rate that carbon atoms do not have time to diffuse out of the fcc crystal structure in large enough quantities to form cementite Fe3C. The 19 © 2017 Tous droits réservés.. lilliad.univ-lille.fr.
(20) Thèse de Gulzar Seidametova, Lille 1, 2017 Literature review. 2017. speeds of cooling can reach 450°C/s for some grades. During this cooling the diffusionless, i.e. displacive transformation takes place in the result of weak displacement or shearing of iron atoms for the tenth order of interatomic distance. This “cooperative” movement of atoms, due to the shearing of austenitic matrix because of the presence of significant supersaturation in interstitial (carbon), was called “military” by J.W. Christian [16]. As a result the fcc austenite transforms to a highly strained bct or bcc form of ferrite that is supersaturated with carbon. The crystal lattice change implies the volume and shape changes on a macroscopic level. On the microscopic level the resultant shear deformations produce large number of dislocations, which is a primary strengthening mechanism of steels. The martensitic reaction begins (Figure 2-1) during cooling when the austenite reaches the martensite start temperature (Ms) and the parent austenite becomes mechanically unstable. As the sample is quenched, an increasingly large percentage of the austenite transforms to martensite until the lower transformation temperature Mf (martensite finish) is reached, at which time the transformation is completed [17]. The Mf temperature is around the room temperature.. Figure 2-1 Continuous Cooling Transformation (CCT) diagram of 1.4913 X19CrMoNbVN11-1 steel [18]. 20 © 2017 Tous droits réservés.. lilliad.univ-lille.fr.
(21) Thèse de Gulzar Seidametova, Lille 1, 2017 Literature review. 2017. The Bain model explains the transformation of austenite fcc to martensite bct during quenching, and then to martensite bcc after tempering if the steel possess less than 0.02% of carbon. The major elements of crystallographic theory for martensite formation are shown in Figure 2-2. 2.1.2.1 Mechanism of martensitic transformation: quenching In quenching, firstly, the iron atoms in the center of base faces in austenite fcc become the martensite bct corner atoms, in which the c parameter of the unit cell is greater than the other two parameters (Figure 2-2). And as far as the cooling is very rapid and the solubility of carbon (0.02%) is greatly exceeded, the carbon atoms are trapped at the z octahedral interstitial sites and occupy a few ribs of the bct. This prevents the carbide pecipitation. With the higher carbon concentration of the martensite, more interstitial sites are filled, and the tetragonality increases.. Quenching. Tempering. Figure 2-2 Bain model sketch of martensitic transformation [17] 2.1.2.2 Mechanism of martensitic transformation: tempering After quenching martensitic stainless steels are usually subjected to tempering, i.e. heating of the material and isothermal holding at a temperature lower than the temperature of austenization start, usually between 700°C and 750°C. The tempering is necessary to obtain a good combination of yield strength, ductility and toughness. During tempering the martensite with a low carbon content (less than 0.02%; however some authors don’t consider as a limit the solubility percentage of carbon in iron (0.02%) but rather the value 0.2% of carbon content 21 © 2017 Tous droits réservés.. lilliad.univ-lille.fr.
(22) Thèse de Gulzar Seidametova, Lille 1, 2017 Literature review. 2017. [19]) transforms from bct crystal structure to bcc structure. The carbon has enough time to diffuse from the octahedral interstices. As a result carbides and other precipitates form if the carbon content is high enough, and the lattice is expanded in x and y directions and contracted in z direction in order to be transformed from bct to bcc. The expansion of x and y axis is about 12% , and the contraction is of a 20% along the z-direction. The nature of the precipitation depends on the chemical composition and the tempering temperature and time. After quenching the martensitic steel may contain few fine cementite precipitates due to a slight tempering at the end of cooling. At approximately 300-350°C of tempering process the hardness reduces because the amount of cementites increased and solid solution impoverished in carbon. At 400450°C the secondary hardening happens due to the precipitation of M2X and M7C3. Starting from 500°C the M23C6 precipitate at the boundaries [17], [20]. 2.1.2.3 Crystallography of martensitic transformation: notion of habit plane and KS relationship The mechanism of martensitic transformation leads to a particular morphology: lath or plate (needle in cross-section) [21]. The latter is formed if the carbon content is higher than 1%. But the most frequently encountered morphology is the lath morphology [22] characteristic for the steels with less than 0.6% of carbon. A lath grows on the habit plane (Figure 2-3), so for the better comprehension of how it grows the notion of habit plane should be explained.. Figure 2-3 The growth of lath on the habit plane [23]. 22 © 2017 Tous droits réservés.. lilliad.univ-lille.fr.
(23) Thèse de Gulzar Seidametova, Lille 1, 2017 Literature review. 2017. Habit plane is a plane of a parent austenite on which the product martensite grows. The habit plane is usually a close-packed plane of a structure and it is unrotated or invariant and undistorted. This plane has two conservative properties: its orientation is not affected by transformation and the relative positions of the atoms in this plane are not modified (distance and angles). The shear or displacement on planes parallel to the habit plane produces surface tilting that we observe as lath (Figure 2-3). So the shape change on the surface is a result of plane strain. The first variant of lath creates a volume incompatibility, i.e. the laths occupy some restricted volume and the rest of material volume around them cannot follow the same arrangement. As a result around this first variant other variants are created. The martensitic transformation needs good coupling between parent and product phases. The well-known orientation relationship between parent austenite and product martensite is Kurdjumov-Sachs (KS) relationship: {111}γ // {101}α <110>γ // <111>α In case of this relationship there are four different {111}γ planes, each plane being parallel to a {101}α plane. A {111}γ plane contains three different <110>γ directions and each <110>γ direction can be parallel to two different <111>α directions. Therefore there are 24 different KS variants [17], [23]. Other relationships between parent austenite and product martensite known to science are, for example, Nishiyama-Wassermann (NW) relationship [24] or Greninger-Troiano (GT) relationship [25].. 2.1.3 Martensitic microstructure As it was said in the previous subchapter the martensitic transformation leads to a particular microstructure, often called lath microstructure in steels with less than 0.6% of carbon. The speed of lath formation reaches 1100 m/s. The laths form and stop growing when they hit another lath or grain boundary. Therefore one would expect the largest laths to form first [20].. 23 © 2017 Tous droits réservés.. lilliad.univ-lille.fr.
(24) Thèse de Gulzar Seidametova, Lille 1, 2017 Literature review. 2017. The majority of authors distinguish another 3 units of martensitic microstructure: prior austenite (PA) grain, packet, and block (Figure 2-4). PA grain. a) Blocks. Lath. Packet. b). c). Figure 2-4 a) sketch of the martensitic microstructure; b) optical image of a 0.2%C martensitic microstructure; c) Inverse Pole Figure (IPF) color map of the martensitic microstructure; red dashed line illustrates the PA grain boundary, yellow dashed line – packet boundary; white arrows indicate the blocks [26] Barrett has called this multiscale microstructure of 9-12 % Cr martensitic steels the hierarchical microstructure [27]. Krauss and Marder defined a packet as a group of laths with almost the same habit plane, and block as a group of laths with almost the same orientation [28]. Brachet points out that one block of 9-12 % Cr steels usually contains 5-10 laths weakly disoriented and almost aligned (almost parallel to each other) [22]. Some authors mention sometimes the term subgrain or micrograin [8], [29] along with the term of lath. According to Fournier a subgrain generally means a microstructural submicronic zone able to be strongly or weakly disoriented relatively each other. Also this author indicates that the laths after a tempering may be defined. 24 © 2017 Tous droits réservés.. lilliad.univ-lille.fr.
(25) Thèse de Gulzar Seidametova, Lille 1, 2017 Literature review. 2017. as an alignment of micrograins [8]. Marmy and Kruml differ the laths from subgrains by their (laths’) elongated form appearing on microscopic images [30] (Figure 2-5).. Figure 2-5 Microstructure of as received EUROFER 97 (9Cr-1W-0.47Mn-0.2V-0.12C) steel. Prior austenitic grains are decorated by lines of carbides. Elongated martensitic laths are not frequent. The structure is composed mainly of sub micrometric equiaxed subgrains [30] At the same time some authors such as Krauss [31] suppose that probably each lath is subdivided into again smaller units, which are not visible because the etchant is not able to selectively attack the boundaries and/or because the microscope cannot resolve the closely spaced boundaries. After reviewing the different sources discussed above, the next definitions of each microstructural unit can be deducted. A lath is the smallest unit of microstructure. It is usually very thin and long on two-dimensional microscopic images. Its length can reach 10 µm. The laths are gathered in blocks, where they share the same variant. Blocks are quasi-parallel between each other and form packets. The laths in a packet share the same habit plane. 25 © 2017 Tous droits réservés.. lilliad.univ-lille.fr.
(26) Thèse de Gulzar Seidametova, Lille 1, 2017 Literature review. 2017. The mechanical properties of martensitic steels are dependent on the sizes of the microstructural units of material. The finer the microstructure is, the better properties the material has. The size is dependent on the temperature and duration of austenization. The lower the temperature is, the smaller the size of packet and block is. The longer the austenization duration is, the bigger the size of PA grains, packets and blocks is. The size of lath is independent on the quenching temperature [32]. Moreover, the knowledge of size of each microstructural unit is crucial because the dimensions of each unit are integral in the recognition of each microstructural member during microscopic observations. 2.1.3.1 Review of microstructural unit sizes defined by some authors Figure 2-6 shows the distribution of lath widths received by measurements from electron micrographs obtained from thin foils and replicas of polished and etched specimens of Fe-0.2C steel. The important result shown in this figure is that most of laths have widths smaller than 0.5 µm, which is the resolution limit of light microscope, and therefore the lath cannot possibly be revealed by light metallography. However, rarely there are some laths with widths up to almost 2 µm [17].. Figure 2-6 Distribution of lath widths in Fe-0.2C martensite. Vertical dashed line shows the limit of the resolution of light microscope [17] 26 © 2017 Tous droits réservés.. lilliad.univ-lille.fr.
(27) Thèse de Gulzar Seidametova, Lille 1, 2017 Literature review. 2017. Sauzay et al. [29] have defined some sizes of 9Cr1Mo steel when they studied the creep deformation. The width of block was approximately 4 µm, the thickness of lath was about 0.7 µm. The laths were elongated inside the blocks. One more microstructure unit was mentioned by them – subgrain which was equiaxed along the lath and had a diameter in general equal to 0.7 µm. Fournier et al. [33] reported the average grain size ranging from 10 to 60 µm in his study of fatigue-creep of 9-12%Cr steels. Batista et al. [15] describing as received microstructure of ferritic-martensitic AISI 410 containing 13% of chromium said that it consists of a tempered martensitic lath structure composed of small subgrains of about 0.5 µm diameter with an essential dislocation structure (Figure 2-7a). Endo et al. [34] observing 9Cr-1Mo steel in TEM noticed a randomly oriented lath structure with average lath width 0.54 µm of as received specimen (Figure 2-7b). Besides, this value of lath width was confirmed later by authors’ measurements with AFM.. b). a). 2µm. Figure 2-7 TEM images showing the microstructure of AISI 410 steel (a) [15] and of Mod.9Cr-1Mo steel (b) [34] Another authors working a lot on the martensitic microstructures is Morito et al. [35], [36]. They have conducted significant experiments utilizing TEM, SEM and EBSD techniques in order to characterize the martensitic structures, their sizes, orientation relations and. 27 © 2017 Tous droits réservés.. lilliad.univ-lille.fr.
(28) Thèse de Gulzar Seidametova, Lille 1, 2017 Literature review. 2017. distributions. In the work of Morito et al. [37] the crystallography, microstructure and mechanical properties of as-quenched martensite of Fe–0.2C– Mn(–V) alloys were studied. The authors reported the size of PA grain between 2 µm and 370 µm (Figure 2-8). The prior austenite grains whose size was larger than 28 µm were subdivided into several packets. When the prior austenite grain size was about 2 µm, mainly one packet appeared inside it. Among the reviewed papers it seems that all authors observed the laths with sizes ranging from 0.2 µm to 0.7 µm in average. However, the PA grain diameters may vary from 2 µm up to 370 µm. As for the block and packet sizes, a little of authors performed direct measurements of their sizes. Nonetheless, there are a few studies that have reported theoretical relationships between PA grain size, packet and block sizes. Thus, Morito et al. [35], [37], [38] performed an important contribution in the development of size relationships between members of martensitic microstructure, which will be discussed in the next paragraph.. c. Figure 2-8 OM images of lath martensite structure in the Fe-0.2C-2Mn steel with prior austenite grain size 370 µm (a) and 28 µm (b); (c) TEM image of lath microstructure of Fe0.2C-1.5Mn-0.15V with prior austenite grain size 2.3 µm; white solid line and dashed line indicate the prior austenite grain boundary and packet boundary respectively [37]. 28 © 2017 Tous droits réservés.. lilliad.univ-lille.fr.
(29) Thèse de Gulzar Seidametova, Lille 1, 2017 Literature review. 2017. 2.1.3.2 Relationship between units of microstructure and their sizes Maki et al. affirmed in their work [39] that both the block width and the packet size are proportional to the PA grain size. Later, Morito together with his coauthors [37] proposed a relationship between prior austenite grain size, packet size and block width, generated from the relationships of Maki and supported by his own observations. The relationships are illustrated in Figure 2-9. The packet size d (µm) decreases proportionally to the PA grain size D (µm) decrease according to the formula d=0.34D+5.34 for the grains larger than 10µm (see the solid line in Figure 2-9). However the width of blocks is seemed to be independent on the PA grain size (see the open marks in Figure 2-9) [37].. Figure 2-9 Relationship between prior austenite grain size and packet size in some low carbon steels [37] Nonetheless, a year later, Morito et al. published a work where they reported a linear relationship with a larger slope between block width db and prior austenite grain size dg for grains with dg<200 µm in the case of Fe-0.2C; and continuous linear dependence between PA grain size and block width for Fe-0.2C-2Mn (Figure 2-10) [38]. Hatem and Zikry have published in [40] the schematic representation of the multiscale lath martensite microstructure and its dimensions (Figure 2-11) that they used for the simulation, built on the multiple-slip dislocation-density based crystal plasticity formulation, to investigate the large strain inelastic behaviour of martensitic steel under dynamic loadings. They developed their sketch, based on the works of Morito et al. [35], [37], [38], [41], [42]. The authors 29 © 2017 Tous droits réservés.. lilliad.univ-lille.fr.
(30) Thèse de Gulzar Seidametova, Lille 1, 2017 Literature review. 2017. mentioned again in the article the statement of Morito et al. [37] that the packet sizes can be approximated as a linear function of PA grain size, and can vary between 0.7 and 150 µm. Their drawing concludes well the diversity and dispersion of dimensions of each unit of the hierarchical martensitic structure as well as the linear dependence between PA grains, packets and blocks.. Figure 2-10 Relationship between the prior austenite grain size and the block width in the quenched martensite of Fe-0.2C and Fe-0.2C-2Mn alloys [38]. Figure 2-11 Martensite microstructure members and its sizes for some grades of steels [40]. 30 © 2017 Tous droits réservés.. lilliad.univ-lille.fr.
(31) Thèse de Gulzar Seidametova, Lille 1, 2017 Literature review. 2017. 2.1.3.3 Disorientation relationships of different interfaces in PA grain The majority of authors, working on the martensitic steels, state in their articles that the PA grains, packets and blocks have High Angle Boundaries (HAB), while laths possess Low Angle Boundaries (LAB) [8], [9], [16], [22], [26], [35], [43]–[45]. In the next paragraph some of those authors who performed the measurements of disorientation angles will be reviewed. The morphology and crystallography of two lath-structured Mn-containing steels and one 18Ni8Co-5Mo maraging steel were studied in [41] using Electron BackScatter Diffraction (EBSD) analysis. For all three steels the misorientation angles between laths inside the blocks are typically less than 3°, although larger misorientations up to 4° can be observed. Based on this general observation, the misorientation angles across lath boundaries were determined in steel #2 (3 % Mn) by Kikuchi diffraction analysis in a TEM. The frequency plot in Figure 2-12 shows that most of the lath boundaries have the misorientation angles less than 3°. It has also been observed that boundaries with relatively large misorientation angles (>2°) often correspond to lath boundaries that separate laths or groups of laths with alternating contrast. These experimental observations corresponded to the previous results obtained for four different low carbon steels [35]. Therefore it indicates that the observed morphological and crystallographic features are universal for low carbon lath martensitic steels and that the effect of substitutional alloying elements on the morphology and crystallography is negligible [41].. Figure 2-12 Disorientation angle distribution of lath boundaries measured by TEM Kikuchi pattern analysis in steel #2 [36]. 31 © 2017 Tous droits réservés.. lilliad.univ-lille.fr.
(32) Thèse de Gulzar Seidametova, Lille 1, 2017 Literature review. 2017. Kitahara et al. [26] published a rich work on the disorientation angles in martensitic microstructure of low carbon 0.2%C steel in 2006. They showed that the laths can be grouped in sub-blocks – two particular K-S variant groups. There is a specific rule for combining two variants, which is a rotation axis <011> and an angle 10.53°. In the Figure 2-13 a PA grain can be seen marked by white boundary. Inside the grain different packet boundaries are marked by red. And in each packet the specific combinations of two variants are indicated by capital letter V and correspondent number of variant. Moreover, the figure shows that there are no HAB boundaries within each sub-block of two specific variants.. Figure 2-13 IPF color map of the lath martensite structure of 0.2%C steel. The red and white lines indicate the packet and PA grain boundaries respectively. The black boundaries are drawn when the disorientation angle is greater than 10°. The symbols and numbers indicate the variant numbers [26] Fournier [8] performed EBSD measurements of disorientation angles in his Ph.D. thesis on fatigue-creep of 9%Cr martensitic steel as well. He showed that the disorientation angles inside the blocks, i.e. between laths and subgrains are LAB and they are smaller than 5°. However, the disorientation angles between blocks are HAB.. 32 © 2017 Tous droits réservés.. lilliad.univ-lille.fr.
(33) Thèse de Gulzar Seidametova, Lille 1, 2017 Literature review. 2017. Batista et al. [46] reported the average misorientation angle of 0.8° between neighboring laths in EUROFER 97. An interesting fact about the boundary character in martensitic steels was mentioned by Morsdorf et al. [44]: the PA boundary plane is curved because they are not determined by the austenite-martensite orientation relationship, while the martensite boundaries are rather straight because they are submitted to the strict orientation relationship and due to the minimization of accommodation strain energy during the martensitic transformation. To sum up, most of authors agree that PA grains, packets and blocks have HAB, while laths have LAB usually less than 3°.. 2.1.4 Conclusions The principles of martensitic transformation leading to a particular lath structure were considered in this section. The laths are always grouped in blocks according to their variant, and into packets according to their habit plane. Some studies on the definition of sizes and disorientations of PA grains, packets, blocks and laths were reviewed in the last part of section. And it appears that the lath widths are less than 1 µm; while packet and block sizes are linearly dependent on the PA grain size. As for the angle disorientations, the PA grain, packet and block have HAB, and lath has LAB.. 2.2 Fatigue 2.2.1 What is fatigue? Fatigue is a modification of material microstructure as a result of repetitive (cyclic) mechanical loading which can lead to the deterioration of material. It is one of the primary reasons for the failure of structural components. The life in fatigue is measured by number of cycles to failure and it depends on many factors such as applied stress and deformation, environment and temperature and metallurgical microstructure.. 33 © 2017 Tous droits réservés.. lilliad.univ-lille.fr.
(34) Thèse de Gulzar Seidametova, Lille 1, 2017 Literature review. 2017. 2.2.2 Fatigue stages The damage process under repeated loading can be divided into three stages: 1. Fatigue crack initiation: during a large number of cycles, the deformation relief develops at the external surface on the microscopic level and develops until microscopic cracks or short cracks are formed. 2. Fatigue crack propagation: the coalescence of short cracks leads to the formation of long crack or macroscopic crack, which grows for each cycle until it reaches a critical length. 3. Failure: the cracked component breaks because it can no longer sustain the peak load. The last stages of fatigue process are usually studied within the fracture mechanics discipline, while the first stage is more considered within the material science. The main purpose of fatigue engineers is to be able to detect the crack before it reaches its critical size, and also to estimate the damage in the first stage, i.e. to control the quantity of accommodated damage before the crack forms.. 2.2.3 Fatigue modes Based on the number of load cycles needed to produce a crack, it is usual to make a distinction between low cycle fatigue (LCF), high cycle fatigue (HCF) and very high cycle fatigue (VHCF). The Wöhler curve (Figure 2-14), representing the stress change as a function of number of cycles to failure, allows determining the three domains of fatigue. This type of curve is sometimes called S-N curve and it is a result of experiments on flat specimens without geometrical defects. The limit between the first two domains LCF and HCF is generally admitted to be 105 cycles, while between HCF and VHCF domains is of the order 108 cycles. In the case of HCF, the stresses are low enough (usually under yield limit) and the stress-strain relation can be considered elastic. For LCF, meanwhile, the applied stresses usually exceed the yield limit of material, and the macroscopic deformation is plastic. In HCF tests the constant stress is usually imposed, while in LCF the engineers are more interested in the stress amplitude evolution under strain control as well as in the hysteresis loops (σ-ε) and number of cycles to failure (lifetime).. 34 © 2017 Tous droits réservés.. lilliad.univ-lille.fr.
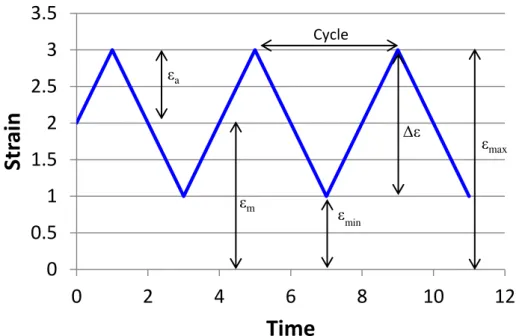
(35) Thèse de Gulzar Seidametova, Lille 1, 2017 Literature review. 2017. Figure 2-14 Schematic representation of stress amplitude and plastic deformation evolution as a function of number of cycles to failure, determining the different fatigue domains [47] In the present work only LCF loading is considered.. 2.2.4 LCF variables In the real-life conditions, a component is subjected to load cycles which do not have necessarily the same amplitude. Since in general a component has a complex shape with variable dimensions, the stress and strain vary from one spot to another one. Laboratory tests aiming at understanding fatigue mechanism or at assessing reference fatigue curves as in Figure 2-14 are controlled by specific variables such as stress or strain. In the case of LCF the control variable is a strain, generally total strain and sometimes plastic strain. A triangular waveform is employed in order to have a constant strain rate. A loading cycle is defined as the duration from one peak in the studied variable to the next peak (Figure 2-15). The strain varies between a maximum strain max, and a minimum strain min during a loading cycle (Figure 2-15). In the field of fatigue the variation in strain is often defined using the strain amplitude a, which is a half difference of maximum and minimum strains, and the mean strain m, which is the arithmetic average between maximum and minimum strains. The strain range ∆ represents difference between maximum and minimum strain. R-value is frequently used to describe a loading cycle too and is a ratio of minimum strain to maximum one. R=-1 means a maximum strain is equal to a minimum strain, and customary this mode of loading is called fully-reversed fatigue loading. When R=0 (minimum strain is equal to 0), then the mode of loading is pulsating. 35 © 2017 Tous droits réservés.. lilliad.univ-lille.fr.
(36) Thèse de Gulzar Seidametova, Lille 1, 2017 Literature review. 2017. tension. Finally, more important than the frequency is the strain rate which is kept constant for tests campaign. This means that for a given tests campaign where the strain range is changed, the frequency also changes.. 3.5 Cycle. 3 εa. Strain. 2.5 2. Δε. εmax. 1.5 1. εm. εmin. 0.5 0 0. 2. 4. 6. 8. 10. 12. Time Figure 2-15 The basic loading signal in LCF revealing the commonly used variables in the science of LCF. 2.2.5 Data recording during LCF test In LCF the applied stresses exceed the elastic limit of material. Since LCF test is performed under strain control, then the hysteresis loops and the number of cycles to failure are recorded. Hysteresis loop represents the stress evolution as a function of strain in each cycle. The stress amplitude Δσ/2, the total strain variation Δεt, plastic strain variation Δεp and elastic strain variation Δεe are obtained from the loop as shown in Figure 2-16. To show the different phases of loading or to compare the different tests, the stress amplitude is usually plotted as a function of number of cycles (Figure 2-17).The stress evolution is normally characterized by 3 steps: 1. Cyclic accommodation. At the beginning of strain-controlled LCF tests the stresses usually vary a lot. If the stress decreases then the phenomenon of cyclic softening takes place, which means that a lower stress should be applied in order to reach the imposed. 36 © 2017 Tous droits réservés.. lilliad.univ-lille.fr.
(37) Thèse de Gulzar Seidametova, Lille 1, 2017 Literature review. 2017. strain (Figure 2-17, see the red arrow). Otherwise, the phenomenon of cyclic hardening happens. 2. Stabilization (Figure 2-17, green arrow). In this period the hysteresis loop does not evolve anymore, or its evolution is very slight. This phase represents generally the major part of the life, and often the hysteresis loop derived from the period of stabilization is considered as illustrative of the fatigue behaviour of material. 3. At the end of life the crack propagation in the material implies the important change of the hysteresis loop geometry and the drastic decrease of stress amplitude (Figure 2-17, black arrow). The lifetime or number of cycles to failure is usually defined as the number of cycles at which 25% of maximum tension stress relatively to the stabilized stress is reduced.. Figure 2-16 Hysteresis loop of stress versus strain It must be mentioned here that some materials exhibit a more complex response such as cyclic hardening followed by softening and then by second hardening [48].. 37 © 2017 Tous droits réservés.. lilliad.univ-lille.fr.
(38) Thèse de Gulzar Seidametova, Lille 1, 2017 Literature review. 2017. The resistance curve is further obtained from a set of fatigue tests performed at different strains. In LCF, it is usually called “Manson-Coffin curve” and it represents the change of plastic strain amplitude as a function of number of cycles to failure (Figure 2-18).. Figure 2-17 Evolution of stress amplitude as a function of number of cycles for 9%Cr steel EUROFER 97: red arrow points out the softening phase, green arrow – stabilization phase, black arrow - failure [46]. Figure 2-18 Manson-Coffin curve of modified 9Cr-1Mo steel at 600°C [49]. 38 © 2017 Tous droits réservés.. lilliad.univ-lille.fr.
(39) Thèse de Gulzar Seidametova, Lille 1, 2017 Literature review. 2017. 2.3 Fatigue deformation The very first paper paying attention to the crack initiation in fatigue loading is the article of Sir James Alfred Ewing demonstrating the origin of fatigue failure in microscopic cracks in 1903 [50]. In the fifties such scientists as Forsyth and Stubbington studied the fatigue crack initiation in aluminium [51], [52]. They supposed that the “slip-band extrusions” may be related to the material cracking. Hull, in its turn, believed that the cracks nucleated in intrusions in fatigued copper [53]. Later King [54] reported some cracks occurring in the persistent slip bands in polycrystalline aluminium. The mentioned above terms (extrusion, intrusion and persistent slip band) leading finally to the metal cracking are believed to be the consequence of dislocation activity and resultant particular dislocation reorganization in the bulk of material. Eventually the scientists developed the models trying to link the surface deformation to the bulk activity. The next section is devoted to the review of existent theory and observations on the issue.. 2.3.1 Low energy dislocation structures produced by cyclic deformation in the bulk of metals In fatigue the dislocations move inside the material and interact. The interactions create an energy excess which will be reduced once the dislocations will have arranged in low energy configurations. Some of them will be defined below and are typical of easy cross slip materials. At low strain level, a dipolar structure or matrix (Figure 2-19a) is formed when a single slip system enables the accommodation of the deformation. The dipolar structure consists of channels with low density of mobile screw dislocations and veins of high density of edge dislocations. The deformation occurs by the quasi-reversible movement of screw dislocations in the channels. At medium strains, even if one slip system is activated, the matrix structure becomes unstable, and the veins transform into the wall structure (Figure 2-19b). When a second glide system is activated the labyrinth structure may be formed (Figure 2-19c).. 39 © 2017 Tous droits réservés.. lilliad.univ-lille.fr.
(40) Thèse de Gulzar Seidametova, Lille 1, 2017 Literature review. 2017. Figure 2-19 Some low energy dislocation configurations observed in a ferritic steel: a) matrix structure; b) walls; c) labyrinth; d) cells [55] Locally the irreversible slip processes become confined into the so called persistent slip band (PSB) that exhibits the ladder-like structure (Figure 2-20). As a result the composite structure “matrix+PSB” is obtained. The adjective persistent is used because the slip bands emerge at specimen surface and reappear in the same location after the test was interrupted, the surface was polished and the test was repeated. The ladder-like structure consists of walls and channels. In the channels the dislocations are mainly of screw character, while in the walls they are of edge character. The conditions of steady state require that the dislocation densities in channels and walls are maintained constant. It is achieved by an equilibrium between the multiplication and annihilation of both edge and screw dislocations. After annihilation the edge-dislocation segments bowing out of the walls produce the screw dislocations, and those screw dislocations generate the edge dislocations by gliding. In this way the continuous flux of both types of dislocations is maintained. Without annihilation of dislocations the irreversibility and randomness of glide could not be possible. Moreover, the annihilation processes bring to the creation of point defects [56].. 40 © 2017 Tous droits réservés.. lilliad.univ-lille.fr.
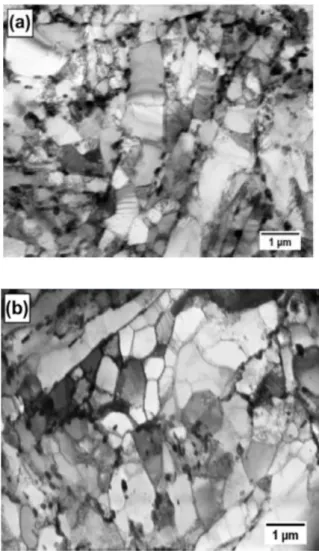
(41) Thèse de Gulzar Seidametova, Lille 1, 2017 Literature review. 2017. Figure 2-20 The ladder-like structure of PSB in copper crystal [57] At high strain levels, several glide systems are activated. Dislocation cells are formed due to this multiple gliding (Figure 2-19d). Cells may accommodate plasticity by the dislocation glide from one cell wall to another. The dislocation cell configuration is known to possess the lowest energy. This type of dislocation arrangement is the most frequently observed in martensitic steels. The dislocation cells represent a two-dimensional honeycomb-like structure with regions of high dislocation density (dislocation walls) and low dislocation density (cell interior or region in between the walls) [58]. Laird considered that the walls of cells observed in copper are constructed of the edge dislocation dipoles [59]. The formation of cells suggests that the migration and/or annihilation of boundaries occur during cycling. As far as the interior of cells is softer than the wall and with cycling the volume fraction of cells grows up, the volume fraction of soft regions grows up too and this leads to softening effect [60].. 2.3.2 Fatigue behaviour of 9-12% Cr martensitic steels and resulting microstructural evolutions One of the features of 9-12% Cr steels and more generally of many martensitic steels lies in the fact that under cyclic loading these materials soften (Figure 2-17). For fatigue tests controlled by deformation it results in a continuous decrease of maximum stress reached at each cycle. In general, regardless of the alloy or temperature, or level of deformation, the cyclic behaviour is 41 © 2017 Tous droits réservés.. lilliad.univ-lille.fr.
(42) Thèse de Gulzar Seidametova, Lille 1, 2017 Literature review. 2017. characterized by the first rapid softening phase (for 10 to 30% of the life fraction) followed by longer phase in which the softening kinetics is slower and almost constant. Finally when macroscopic cracks propagate, the stress drops sharply. A notable point is that, as slow as it is, softening is continuous, which means that a cycle called "stabilized" is never reached [8], [46]. As far as the 9-12%Cr martensitic steels are usually used in the conditions of high temperature, the majority of studies are performed at elevated temperatures in order to approach the real conditions. Thus, Golanski and Mrozinski [61], for example, studying the cyclic deformation of GP91 (GX12CrMoVNbN9-1, where G designates that the steel is cast) cast steel at 600°C reported the continuous softening of material too. The scientists explained the phenomenon by disappearance of lath microstructure (Figure 2-21) and formation of dislocation cells which coalesced together and formed the large subgrains. The changes in dislocation structure were intensified by the elevated temperature that caused a decrease in the stress of lattice and generated the growth of concentration of vacancies, which helped the dislocations to pass round the obstacles by the dislocation climb mechanism.. a). b). Figure 2-21 Microstructure of GP91 cast steel in the as received condition (a) and after LCF at strain amplitude εac=0.25% and at 600°C (b) [61] Fournier [62] studied the LCF deformation of P91 (X10CrMoVNb9-1) steel at 550°C and in air. After test he noticed the partial recovery of lath microstructure from the observations in TEM (Figure 2-22).. 42 © 2017 Tous droits réservés.. lilliad.univ-lille.fr.
Figure
![Figure 2-18 Manson-Coffin curve of modified 9Cr-1Mo steel at 600°C [49]](https://thumb-eu.123doks.com/thumbv2/123doknet/3666617.108477/38.892.212.674.658.1017/figure-manson-coffin-curve-modified-cr-mo-steel.webp)
![Figure 2-19 Some low energy dislocation configurations observed in a ferritic steel: a) matrix structure; b) walls; c) labyrinth; d) cells [55]](https://thumb-eu.123doks.com/thumbv2/123doknet/3666617.108477/40.892.256.632.133.561/figure-dislocation-configurations-observed-ferritic-matrix-structure-labyrinth.webp)
![Figure 2-20 The ladder-like structure of PSB in copper crystal [57]](https://thumb-eu.123doks.com/thumbv2/123doknet/3666617.108477/41.892.239.651.139.432/figure-ladder-like-structure-psb-copper-crystal.webp)
+7
![Figure 2-21 Microstructure of GP91 cast steel in the as received condition (a) and after LCF at strain amplitude ε ac =0.25% and at 600°C (b) [61]](https://thumb-eu.123doks.com/thumbv2/123doknet/3666617.108477/42.892.132.766.608.869/figure-microstructure-cast-steel-received-condition-strain-amplitude.webp)
![Figure 2-24 Cyclic behaviour curves of EUROFER 97 steel obtained at room temperature and at three different plastic strain ranges [64]](https://thumb-eu.123doks.com/thumbv2/123doknet/3666617.108477/45.892.276.642.150.444/figure-cyclic-behaviour-eurofer-obtained-temperature-different-plastic.webp)
![Figure 2-33 Grain sliding as a result of HCF test of UFG ferrite/martensite steel: (a) SEM evidence of GBS, (b) schematic representation of GBS [69]](https://thumb-eu.123doks.com/thumbv2/123doknet/3666617.108477/55.892.132.761.225.505/figure-grain-sliding-ferrite-martensite-evidence-schematic-representation.webp)
![Figure 2-35 Cross-sections of extrusions, intrusions and cracks observed in copper single crystals after approximately 300 kilocycles of loading [80]](https://thumb-eu.123doks.com/thumbv2/123doknet/3666617.108477/57.892.253.646.283.710/figure-sections-extrusions-intrusions-observed-crystals-approximately-kilocycles.webp)
Documents relatifs