A TALE OF TWO BIODIVERSITY LEVELS INFERRED FROM DNA BARCODING
OF SELECTED NORTH ATLANTIC CRUSTACEANS
DISSERTATION
PRESENTED
AS PARTIAL REQUIREMENT
OF THE DOCTORATE OF BIOLOGY EXTENDED FROM
UNIVERSITÉ DU QUÉBEC À MONTRÉAL
BY
ADRIANA E. RADULOVICI
UNIVERSITÉ DU QUÉBEC À MONTRÉAL Service des bibliothèques
Avertissement
La diffusion de cette thèse se fait dans le rèspect des droits de son auteur, qui a signé le formulaire Autorisation de reproduire et de diffuser un travail de recherche de cycles supérieurs (SDU-522- Rév.01-2006). Cette autorisation stipule que «conformément à l'article 11 du Règlement no 8 des études de cycles supérieurs, [l'auteur] concède
à
l'Université du Québec à Montréal une licence non exclusive d'utilisation et de publication de la totalité ou d'une partie importante de [son] travail de recherche pour des fins pédagogiques et non commerciales. Plus précisément, [l'auteur] autorise l'Université du Québec à Montréal à reproduire, diffuser, prêter, distribuer ou vendre des copies de [son] travail de rechercheà
des fins non commerciales sur quelque support que ce soit, y compris l'lnternE?t. Cette licence et cette autorisation n'entraînent pas une renonciation de [la] part [de l'auteur]à
[ses] droits moraux nià
[ses] droits de propriété intellectuelle. Sauf entente contraire, [l'auteur] conserve la liberté de diffuser et de commercialiser ou non ce travail dont [il] possède un exemplaire.»L'HISTOIRE DE DEUX NIVEAUX DE BIODIVERSITÉ DEMONTRÉE PAR LE
CODE-BARRE D'ADN CHEZ LES CRUSTACÉS DE L'ATLANTIQUE DU
NORD
THÉ SE
PRÉSENTÉE
COMME EXIGENCE PARTIELLE
DU DOCTORAT EN BIOLOGIE EXTENSIONNÉ DE
L'UNIVERSITÉ DU QUÉBEC À MONTRÉAL
PAR
ADRIANA E. RADULOVICI
MARS 2012
-Lite is like a box of chocolates:
Y ou never know what you're gonna get!
This thesis is the product of five years of research under the supervision of France Dufresne (UQAR) and Bernard Sainte-Marie (Maurice-Lamontagne lnstitute, DFO). My project began in 2006 as part of the Canadian Barcode of Life Network (BOLNET), led by Paul Hebert (University of Guelph, ON), and ended in 2011 as part of the Canadian Healthy Oceans Network (CHONe), led by Paul Snelgrove (Memorial University, NL). Main funding was provided by the Natural Sciences and Engineering Research Council (NSERC) through BOLNET, CHONe (F. Dufresne) and a Discovery Grant awarded to B. Sainte-Marie. Additional funding was provided by Fondation de I'UQAR (Bourse d'excellence en recherche, 2010-2011 ). Some of my work had the financial support of the Marine Barcode of Life (MarBOL) and the International Barcode of Life (iBOL) projects, Centre de recherche sur les milieux insulaires et maritimes (CERMIM), EnviroNorth, and The Crustacean Society. Additional sources have provided funding for presenting my research at various international conferences: UQAR, Amphipod Newsletter, and The International Biogeography Society.
The four chapters presented here correspond to published articles or manuscripts in preparation. While the work was collaborative between multiple co-authors, the first author was responsible for designing, writing, incorporating comments from co-authors and submitting manuscripts to journals. These chapters are linked by an introduction and general conclusions, while the appendices and references for each chapter are presented at the end of this thesis.
The life of a PhD student is full of "major discoveries" and a lot of frustration. ln my case, this challenge would not have been met without the help of a few people deserving credits.
v
1 am grateful to my supervisors for trusting my decisions even when these were not the wisest ones. Merci France for giving me complete freedom on this project and a highly flexible schedule. Merci Bernard for taking this challenge, for waking up early in the morning to write recommendation letters for me and for your unbeatable energy and good mood. 1 thank the rest of my committee for reading this thesis and giving very helpful feedback: Alison Derry (UQAM), Gary Saunders (UNB) and Pierre Blier (UQAR).
My regular visits to the "Barcoding Mecca" in Guelph helped me gather a very large dataset. 1 am grateful to the entire staff: technicians who showed me how to use fancy equipment, people helping with various issues (Greg, Nataly, Claudia, Jaclyn, Megan), the most helpful "liaison" person (Rick Turner), postdocs (the best French team: Rodolphe & David), profs (Alex, Sally and Mehrdad) and Paul Hebert who always took the time to listen to my ideas. 1 am grateful to Dirk Steinke (MarBOL coordinator) for helping with samples, protocols, contacts, analyses and, in general, facilitating barcoding of marine crustaceans. At UQAR/ISMER, 1 thank the Archambault group and Gesche Winkler for providing valuable samples, Robert Chabot for helping me start with amphipod collection and identification and Richard Cloutier for !etting me use his imaging set-up. The staff in the Biology Department (Louise, Danny, Pauline) was very helpful when dealing with bureaucracy.
My close taxonomist collaborators are truly exceptional. Dave Wildish introduced me to the amazing world of "hopping" creatures. Thank you Dave for your enormous patience and for your relaxing British accent! Sara LeCroy always took the time to explain to me taxonomie issues. And Pierre Brunei shared some of his exceptional knowledge on marine amphipods during our meetings at UdeM. Fieldwork along the Eastern Canadian coast would not have been possible without the help of Traian Brad and Fred French. Thank you both for supporting me! Guglielmo Tita (CERMIM) helped with the Magdalen Islands project, grazie mille! ln Mexico, Manuel Elias-Gutiérrez and Martha Valdéz (ECOSUR) and their students helped me reach Banco Chinchorro to collect amphipods, gracias!
This past five years included travels around the world to present my work at various conferences and to visit other labs. 1 thank ali the people and organizations who provided bits and pieces of funding to make me a well-traveled grad student. 1 used desk space in a few labs during my travels: gracias José Guerra Garcia (Sevilla), obrigada Filipe Costa (Braga), thanks Mike Hickerson (NY). Mersi Melania Cristescu (Windsor) for your positive energy, danke Sebastian Klaus (Frankfurt) for always offering your help (Carpathia is waiting!). Muchas gracias Marcos Pérez -Losada (Vairao) for making everything seem so easy ("theses are never finished, they are just presented') and helping on the last stretch! 1 am grateful to everyone who sent specimens (a very long list of nice people!), gave me ideas or feedback for data analysis and ... paid for food and drinks or gave me a place to sleep! Also, ali the free Wi-Fi areas in airports and cafés, greatly improved my work!
Thank you Sean & Marci for giving me a place to stay in Montreal, for widening my culinary knowledge with "horse-food" and salads and for showing me shoe-shops! Dr. Locke, thanks for ali your good advices, from data analysis to proper English, and for ali the amphipods you collected for me. Noroc!
ln Rimouski: 1 thank ali my friends who helped during my difficult moments: Marie & William, Aude, Aurélia, lrina, Magda, Arnaud, Samantha, Eva, JF & Dominique, the C1 03 labs (surtout Roland!) .... Merci les Cadieux pour votre désir d'étudier le roumain et votre optimisme.
ln Romania: my mentors (Vasile Cristea, loan Coroiu) with their encyclopedie knowledge taught me from the beginning that science has to be interdisciplinary. My friends back home (and wherever they migrated in the last decade) taught me that distance (spatial and temporal) has nothing to do with friendship.
The last and most importantly, 1 thank the best mother in the world (mine!), my sister and my big fat Romanian family for always supporting my crazy ideas that make me be away for so long. 1 hope y ou are ali proud of me as 1 am proud of y ou and of being a multicultural hybrid from Transylvania and Banat!
TABLE OF CONTENTS
FOREWORD ... iv
LIST OF FIGURES ... xi
LIST OF TABLES ... xvii LIST OF ABBREVIATIONS ... xix RÉSUMÉ ... xxi ABSTRACT ... xxiii GENERAL INTRODUCTION What's in the "biodiversity" name? ... 1
Marine biodiversity: a few characteristics ... 4
Current status: threats and mitigation measures ... 5
The economies of biodiversity ... 8
The origin of marine biodiversity- how do species arise? ... 10
Towards a global inventory ... 14
A new tool: DNA barcoding ... 16
Goals of this thesis ... 19
Study are a: North Atlantic ... 21
Study group: Malacostraca, Crustacea ... 24
Methodology ... 27 Thesis outline ... 30
CHAPTER 1 DNA BARCODES FOR MARINE BIODIVERSITY: MOVING FAST FORWARD? ... 32 1.1 Résumé ... 33
1.2 Abstract.. ... 33
1.3 Introduction ... 34
1.4 Marine biodiversity ... 35
1.6 DNA barcoding for species identification and discovery ... 41
1.6.1 The concept: advantages and limitations ... 41
1.6.2 Practical applications for the marine environment ... 45
1.6.3 Progress in DNA-based inventories of marine groups ... 46
1.7 Current status ... 53
1.7.1 How many marine barcodes? ... 53
1. 7.2 Special issues with marine taxa ... 55
1.7.3 Taxonomy and barcoding ... 56
1.7.4 Future directions ... 57
1.7.5 Species as currency for biodiversity ... 58
1.8 Conclusions ... 58
CHAPTER Il DNA BARCODING OF MARINE CRUSTACEANS FROM THE ESTUARY AND GULF OF ST. LAWRENCE: A REGIONAL-SCALE APPROACH ... 61
2.1 Résumé ... 62
2.2 Abstract ... 63
2.3 Introduction ... 64
2.4 Mate rial and methods ... 66
2.4.1 Sam pies ... 66
2.4.2 DNA extraction, amplification, sequencing ... 68
2.4.3 Data analysis ... 69
2.5 Results ... 69
2.6 Discussion ... 73
CHAPTER Ill CRYPTIC DIVERSITY AND EVOLUTIONARY INSIGHTS IN NORTH ATLANTIC TALITRIDS AS INFERRED FROM DNA BARCODES ... 77
3.1 Résumé ... 78
3.2 Abstract. ... 79
3.3 Introduction ... 80
3.4 Material and methods ... 83
ix
3.4.2 DNA extraction, amplification, sequencing ... 88
3.4.3 Data analysis: genetic diversity and phylogenetic relationships ... 88
3.5 Results ... 90
3.5.1 DNA barcodes ... 90
3.5.2 Genetic distances ... 90
3.5.3 Phylogenetic relationships ... 94
3.6 Discussion ... 95
3.6.1 DNA barcodes for species identification ... 95
3.6.2 Genetic diversity ... 96
3.6.3 Cryptic diversity in a wrack generalist: Platorchestia p/atensis (Kr0yer, 1845) ... 97
3.6.4 Cryptic diversity in a palustral specialist: Orchestia griffus (Bosc, 1802) ... 101
3.6.5 Cryptic diversity in Tethorchestia sp. B Bousfield, 1984 ... 103
3.6.6 Phylogeny ... 105
3.6.7 Biogeography ... 108
3. 7 Conclusions ... 110
CHAPTERIV DNA BARCODING BEYOND SPECIES IDENTIFICATION: PHYLOGEOGRA-PHIC PATTERNS IN GAMMARUS OCEAN/GUS SEGERSTRALE, 1947 ... 112
4.1 Résumé ... 113
4.2 Abstract ... 114
4.3 Introduction ... 115
4.4 Mate rial and methods ... 118
4.4.1 Sample collection ... 118
4.4.2 DNA extraction, amplification, sequencing ... 119
4.4.3 Data analysis: genetic diversity, structure and demographie history .. 120
4.5 Results ... 124
4.5.1 COl - genetic diversity ... 124
4.5.2 Population structure ... 125
4.6 Discussion ... 134
4.6.1 Origin and genetic divergence: amphi-Atlantic structure ... 134
4.6.2 Glacial refugia in North Atlantic ... 137
4.6.3 Genetic structure in Atlantic Canada ... 138
4.6.4 Magdalen Islands ... 140
4.6.5 Present-day barriers to dispersal ... 141
4.7 Conclusions ... 142
GENERAL CONCLUSIONS Overview: context and originality ... 144
Overview: main findings at two biodiversity levels ... 145
Limitations of DNA barcoding ... 154
The species ... issue ... 158
Below-species investigations: limitations of COI ... 161
ln a nutshell: findings and extrapolations ... 164
Future directions ... 167
Overall advantages of DNA barcoding ... 172
Preserving global biodiversity ... 173
APPENDIX A SPECIES LIST WITH DETAILS ABOUT SAMPLE SIZE (N), MEAN AND MAXIMUM INTRASPECIFIC DIVERGENCE(%), AND NEAREST NEIGHBOR DISTANCE (NN %) ... 175
APPENDIX B LIST OF HAPLOTYPES AND THE IR FREQUENCY IN EACH POPULATION. THE MO CENTRAL HAPLOYTPES (H10, H19) ARE IN BOLD LETTERS ... 180
Figure 1 2 3 4
5
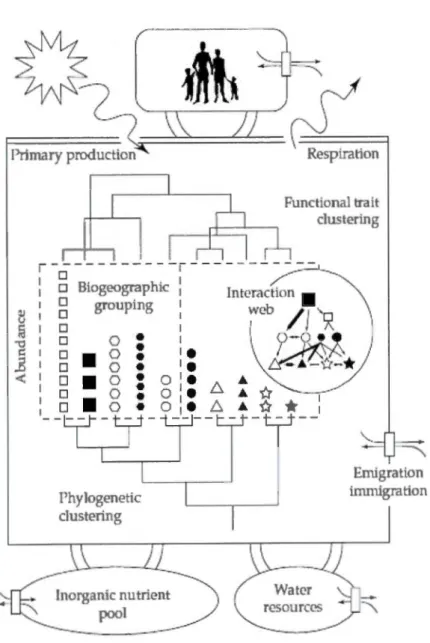
6 LIST OF FIGURESRelationship between biodiversity, ecosystem functioning and human well-being. Species are represented in the center by black and white abjects with various shapes and sizes (Source: Naeem et al., 2009) ... .
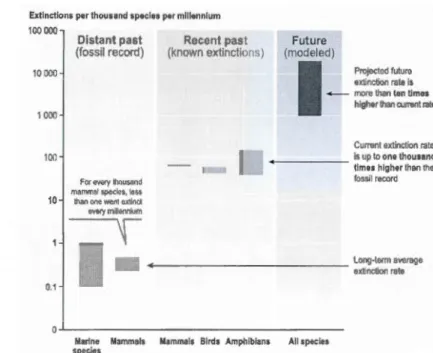
Species extinction rates from fossil data, real data and predictions
for the future. (Source: MA, 2005) ... .
Anthropogenic impact on the world's oceans (investigation performed in 20 ecosystem types). Colors correspond to impact intensity, see above. (Source: Halpern et al., 2008) ... .
Factors affecting the genetic differentiation, and thus speciation and biodiversity, in the sea. (Partially compiled from Palumbi, 1994 and Grosberg and Cunningham, 2000) ... .
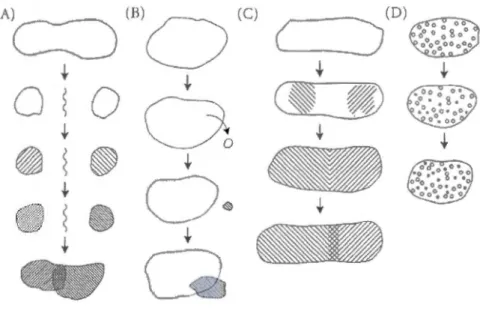
Speciation models depend on the spatial scale involved. A: allopatric madel when reproductive isolation occurs between populations physically isolated; B: peripatric model (founder effect) with a small population being physically separated and evolving towards reproductive isolation; C: parapatric madel with reproductive barriers occurring between contiguous populations due to low dispersal; D: sympatric model with reproductive barriers developing within the same geographie area. (Source: Futuyma, 1998) ... .
Mitochondrial genome of the Arctic amphipod Onisimus nanseni. The position of COl is indicated by an arrow. (Modified from Ki et al., 2010) ... . Page 3 6
7
11 13 177 8 9 10 11 12 1.1
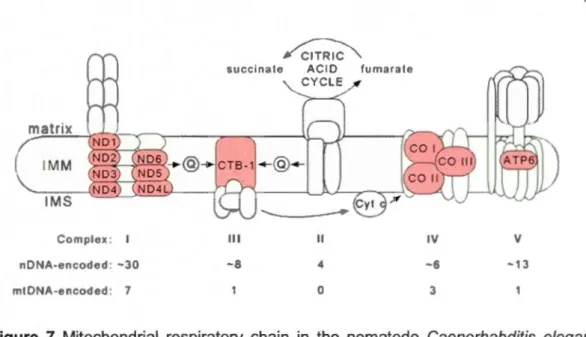
Mitochondrial respiratory chain in the nematode Caenorhabditis elegans with five complexes of proteins encoded by mtDNA (red) and nDNA (green). IMM: inner mitochondrial membrane; IMS: intermembrane space; Q: ubiquinone; Cyt c: cytochrome c. (Note:
in C. elegans there are only 12 protein-coding mt genes). (Source: Lemire, 2005) ... .
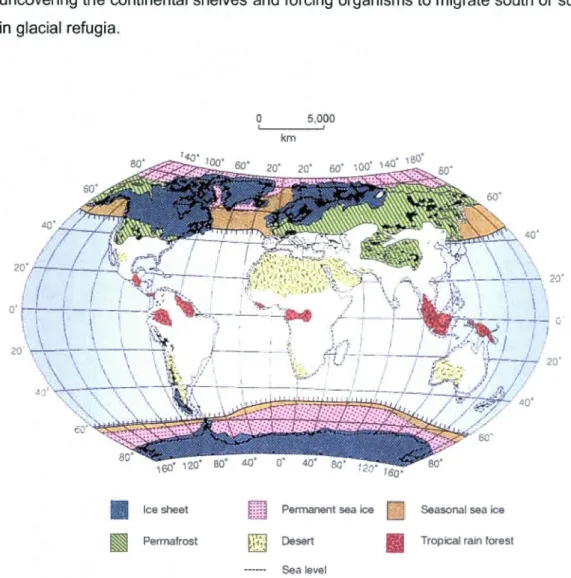
The extent of ice and sea level retreat during LGM. (Source:
Hewitt, 2000) ... .
Present-day circulation in the North Atlantic. Currents: red -warm, blue - cold. GIN - Greenland/lceland/Norway. Black rectangle: Atlantic Canada. (Source: www.planetastronomy.com) ..
Circulation patterns within the Estuary and the Gulf of St. Lawrence. (Source: DFO) ... .
Representatives of the main crustacean groups targeted in this study. A-D: peracarids (A, B: amphipods, C: isopod, D: mysid), E-H: eucarids (E: euphausiid, F-E-H: decapods) ... .
Example of data and metadata related to a DNA barcoding project in BOLD. Ali data can be downloaded. A: Project page (code:
\fiNI!T AL) with a list of specimens included in the project, links to specimen and sequence details, and to various analyses that can be conducted directly in BOLD. 8: Specimen page with metadata for a specimen of Uhlorchestia uh/eri (voucher details, taxonomy,
image, and collection details with GPS coordinates and site map).
C: Sequence page for the same U. uhleri specimen with details about the sequencing step (primers used, DNA sequence and amino acid translation). D: Chromatogram (forward reaction) for the sa me U. uh/eri specimen ... .
The amount of articles focusing on marine biodiversity since 1988
("biodiversity" and "marine" used as keywords in Web of Science) ... . 18 22
23
23
2629
37
1.2 1.3 1.4 2.1 2.2 2.3 3.1 3.2
Average number of marine animal species per taxon described every year. (Modified from Bouchet, 2006) ... .
Proportion of barcoded species across marine animal taxa. (Data provided by D. Steinke, MarBOL coordinator) ... .
The amount of barcoding studies targeting marine systems ("DNA barcod*" and "marine" as keywords in Web of Science) relative to barcoding studies in general ("DNA barcod*") ... .
Distribution map for ali sampling sites within the Estuary and Gulf of the St. Lawrence River. Canadian provinces surrounding the study area: Québec (QC), New Brunswick (NB), Nova Scotia (NS), Prince Edward Island (PEl), Newfoundland and Labrador (NFL) ... .
Frequency distribution of mean divergences for COl sequences for 80 species of malacostracan crustaceans from the Gulf of St. Lawrence. Two taxonomie levels are represented: species (solid bars) and genus (shaded bars). For maximum intraspecific divergences higher th an 3%, see Table 2.1 ... .
Branches of the neighbor-joining tree highlighting the four species complexes (and related species) found for malacostracan crustaceans from the St. Lawrence Gulf. Bootstrap values based on 1000 replications are included ... .
Map with sampling localities for supralittoral amphipod species barcoded in this study ... .
Phylogenetic tree of talitrid species based on COl sequences. Tree has been rooted with the hyalid P. fascigera. Sequences for
P. japonica and P. pa/udosus are public sequences from
GenBank. Numbers on branches represent posterior probability >95% for the Bayesian (BI) tree (above) and bootstrap support >70% for the maximum-likelihood (ML) tree (below) ... .
xiii
39
54 57 67 7172
87 913.3 3.4 3.5 3.6
4.1
4.2
Distance graph for m1mmum interspecific distances related to maximum intraspecific variation (based on K2P distances). Ali values are above the line, hence no overlap between these two categories ... .
Haplotype network and geographical distribution of haplotypes for
Platorchestia platensis species complex. Each putative species
(clusters 1 to 3) has a different colour: 1 - brown, 2 - orange, 3 -violet). lnterrupted !ines represent deep divergences separating MOTU's ... .
Haplotype network and geographical distribution of haplotypes for
Orchestia gril/us species complex. Each putative species (clusters
1 to 7) has a different colour: 1 - brown, 2 - dark green, 3 - light green, 4 -light blue, 5- yellow, 6- red, 7- dark blue. lnterrupted lin es re present deep divergences separating MOTU's ... .
Haplotype network and geographical distribution of haplotypes for
Tethorchestia sp. B complex. Each putative species (clusters 1
and 2) has a different color: 1 - dark green, 2 - light green. lnterrupted !ines represent deep divergences separating MOTU's ... .
Collection sites for Gammarus oceanicus and the general circulation patterns for North Atlantic. Circles represent sites from Atlantic Canada (Southern cluster) while triangles are used for sites from the Arctic Canada and Europe (Northern cluster) ... .
The Gulf of St. Lawrence with colored sites corresponding to our populations: ESL -orange, GAP - brown, SGF light blue, PEl -dark blue, MIS - light green, WNF - dark green, NSH - violet, ENF - red, NSC - yellow, FYB - pink. Oceanography includes main currents (thick arrows), secondary currents (thin arrows) and gyres (circle arrows), according to DFO data ... .
4
.3
Phylogenetic tree for G. oceanicus based on COl haplotypes. The dashed line to the outgroup, G. duebeni, is not illustrated to scale. Although bath BI and ML trees identified the same two divergent94
100
102
104
119123
4.4
4.5
4.6
13
14
clusters (Northern and Southern), both of them had weak support ... .
Median-joining haplotype network for the Northern cluster. Circles represent haplotypes, their size being proportional to the subset of
samples exhibiting the particular haplotype, black dots are
missing haplotypes, and lines represent mutational steps. Colors represent different populations: NOR - dark blue, POL - light pink, ICE- yellow, NQC- purple, CHU- brown ... .
Median-joining haplotype network for the Southern cluster. Each circle represents one haplotype (the size corresponds to the number of individuals sharing that haplotype), each line
represents one mutation step, and black dots are missing
haplotypes. Colors represent different populations, identical to the on es used in Figure
4.2 .
...
.
...
...
...
.
.
.
....
..
...
..
.
.
...
..
.
....
.
.
Mismatch distribution for each cluster of G. oceanicus. Black lines: observed values, grey lines: expected values. Colored dashed li nes represent confidence intervals (90%, 95%, 99%) ... .
Some of the species mentioned in Chapters Il, Ill and IV. A: Neomysis americana; B: Ampe/isca eschrichtii; C: lschyrocerus anguipes; D: Echinogammarus ischnus; E: Platorchestia platensis; F: Orchestia gril/us; G: Tethorchestia sp. B; H: Gammarus oceanicus ......................... .
Distribution map for invasive species according to marine ecoregions. Darker red shades indicate higher number of harmful species and greater impact on native communities while dark blue indicates ecoregions with less harmful species. (Source: Molnar et al., 1998) ... .
15 Phylogeographic patterns with the evolutionary circumstances
involved. Rectangles represent various mtDNA haplotypes (denoted by letters) or groups of closely related haplotypes with their geographie distribution. Haplotypes are connected in networks with dashes indicating the number of mutational steps
xv
126
128
129
132
147148
16
17
18
involved within specifie pathways. (Modified from Avise et al., 1987) ... ···
Phylogenetic relationships between populations or species inhabiting geographically separated areas, under vicariance and dispersal. Lowercase letters represent taxa, uppercase letters represent geographie areas. (Modified from Avise, 2000) ... .
Measures to limit the amplification of pseudogenes in DNA barcoding studies. (Source: Song et al., 2008) ... ..
Schematic representation of the main findings of this project. The pyramid represents biodiversity with its main levels, including cultural diversity. Results for each chapter are mentioned on the left side, while future directions are on the right side of the pyramid. Arrows connect the results with the biodiversity levels tackled (full lines for results, dashed lines for future investigations) ... .
153
154
156
LIST OF TABLES
Table Page
Ten economie, ecological, moral, and legal reasons why society needs to protect and manage biodiversity (Modified from Castello,
1998)... 9 1.1 1.2 2.1 3.1 3.2 3.3
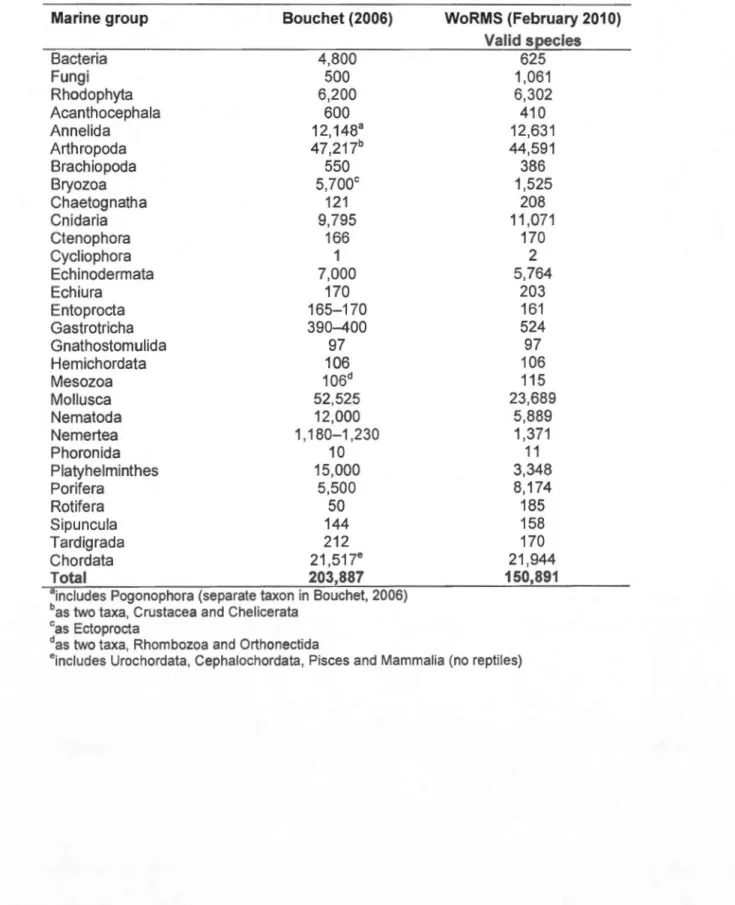
Global numbers of marine species per taxon according to Bouchet (2006) and WoRMS. Only taxa present on both lists were included ... .
Levels of genetic divergence in marine taxa. Only studies using the 5' end of COl and giving average K2P genetic divergences were included. NoS: number of species barcoded; lntra: mean genetic distances within species; Inter: mean genetic distances between species ... .
Crustacean species with maximum intraspecific COl sequence divergences higher than 3% ... .
Species name, taxonomie authority, sample size (N) and geographie origin of taxa included in this study ... .
Salinity tolerance and ecological habitat (Wildish, 1988) of talitrids included in this study ... .
Genetic diversity of talitroid species included in this study: number of haplotypes, mean K2P distances within and between species ... .
4.1 Genetic diversity for pooled collection sites: sample size (N), number of haplotypes per population (H), haplotype diversity (Hel)
36
48
7185
86 934.2
4.3
4.4
2
3
and nucleotide diversity (rr) with standard deviation between brackets ... .
Hierarchical analysis of molecular variance (AMOVA) for G. oceanicus ................................................. .
Pairwise <!:>sr values between populations ... .
Historical demography parameters with 95% confidence intervals ranges and P-values between brackets ... .
Various species concepts (SC) (Modified from Futuyma, 1998). The closest concept to DNA barcoding, the Phylogenetic SC, and the most popular concept, Biological SC, are highlighted ... .
Definitions of "population" according to various criteria (Modified from Waples and Gaggiotti, 2006) ... .
122 128 130 133 159 163
1
1 LIST OF ABBREVIATIONSBI Bayesian inference
BOLD Barcode of Life Data Systems
Bp Base pairs
BSC Biological species concept
COl Cytochrome
c
oxidase subunit 1Co ML Census of Marine Life
CBD Convention of Biological Diversity
DFO Department of Fisheries and Oceans
DNA Deoxyribonucleic acid
ESL Estuary of St. Lawrence
ESU Evolutionary significant unit
GOM Gulf of Mexico
GSL Gulf of St. Lawrence
iBOL International Barcode of Life
ITS Internai Transcribed Spacer
K2P Kimura 2-parameter
LGM Last Glacial Maximum
MarBOL Marine Barcode of Life
ML Maximum-likelihood
MPA Marine protected area
Mt M itochond rial
MYA Million years ago
nD NA Nuclear DNA
NJ Neighbor-joining
NWA Northwest Atlantic
PCR Polymerase chain reaction PSC Phylogenetic species concept
RNA Ribonucleic acid
ROS Reactive oxygen species SEM Scanning electron microscopy SDM Spatial distribution modeling
RÉSUMÉ
La biodiversité est la variété de la vie et elle peut être étudiée à différents niveaux (génétique, espèces, écosystèmes) et à différents échelles (spatiale et temporelle). Les dernières décennies ont montré que la biodiversité marine avait été gravement sous-estimée. Afin d'étudier les caractéristiques de la grande diversité des espèces marines et les processus sous-jacents de l'évolution de ces dernières, il est évident et nécessaire de connaître les espèces. Nous sommes aujourd'hui confrontés aux taux les plus élevés d'extinction depuis la constitution de la société humaine («crise
de la biodiversité») et seule une fraction d'espèces a été officiellement décrite (1 ,9 millions sur 11 millions), en raison, entre autres, d'une pénurie de taxonomistes formés et disponibles pour cet immense travail. Tous ces facteurs ont conduit à la proposition d'outils moléculaires pour permettre et faciliter l'identification des espèces et notamment le barcode moléculaire (le code-barres d'ADN). Il s'agit de séquencer un fragment d'ADN du gène mitochondrial cytochrome c oxydase 1 (COl)
qui constitue alors un outil rapide, précis et rentable pour identifier les espèces. Ainsi, chaque espèce peut être définie par une étiquette d'identification unique et permanente qui ne sera pas changée par une éventuelle modification taxonomique. Outre l'attribution d'échantillons inconnus à des espèces identifiées a priori, les données fournies par le code-barres d'ADN seront très utiles pour des études phylogéographiques comparatives entre taxons multiples, pour clarifier les relations phylogénétiques
à
différents niveaux taxonomiques et pour élaborer des patrons évolutifs et de spéciation entre les groupes d'organismes.Le Chapitre 1 présente une mise en contexte du code-barres d'ADN par une revue des études qui ont été publiées sur le sujet, notamment en ce qui concerne l'identification des espèces marines.
Le Chapitre 2 élabore une bibliothèque pour les crustacés marins de l'estuaire et du golfe du St. Laurent. Toutes les données (taxonomie, informations sur l'échantillonnage, images, séquences d'ADN et chromatogrammes), sont stockées en ligne dans le Barcode of Life Data Systems (BOLD) et sont disponibles pour un usage général. Les spécimens utilisés sont conservés comme 'vouchers' dans des institutions publiques pour des vérifications futures. Les résultats ont montré la présence d'un amphipode invasif dans l'estuaire (mentionné précédemment dans les Grands Lacs et à Montréal, avec des effets sur la faune indigène d'amphipodes), et l'existence d'espèces cryptiques potentielles chez les amphipodes, mysidacés et décapodes.
Le Chapitre 3 est axé sur l'utilisation des séquences COl fournies par le code-barres d'ADN comme un outil complémentaire pour la taxonomie et la phylogénie des amphipodes de la famille Talitridae dans l'Atlantique du Nord. En effet, la distribution et la diversité actuelle des espèces est le résultat de processus d'évolution et
d'interaction avec l'environnement à l'échelle d'une région géographique. Les études phylogénétiques permettent d'appréhender cette problématique en élaborant des scenarios évolutifs des relations entre taxons. Les résultats montrent l'existence d'espèces cryptiques chez trois espèces morphologiques. En outre, les genres anciens ne semblent pas être monophylétiques, suggérant la nécessité d'une révision taxonomique chez cette famille.
Le Chapitre 4 aborde le thème de la diversité génétique qui permet la persistance des populations et des espèces dans le temps en permettant une adaptation continue aux changements environnementaux. À de grandes échelles spatiales, la diversité intraspécifique peut être structurée en généalogies en fonction de la géographie, définissant alors des patrons phylogéographiques, qui peuvent coïncider ou pas avec les divisions biogéographiques. Les séquences COl générées par le code-barres d'ADN ont été utilisées pour déduire des patrons phylogéographiques chez une espèce d'amphipode avec une distribution amphi-Atlantique, Gammarus oceanicus. Cette espèce est très abondante et représente une partie importante des communautés intertidales et des réseaux trophiques côtiers. Les résultats ont montré une division profonde au sein de cette espèce avec deux groupes ayant une séparation latitudinale (la région tempérée du Canada Atlantique versus la région subarctique du Baie d'Hudson et l'Europe), indiquant la présence des deux espèces cryptiques potentielles.
L'ensemble de ces travaux de recherche a montré que la biodiversité marine, notamment chez les crustacés marins de l'Atlantique du Nord, était sous-estimée. Des espèces cryptiques potentielles ont été trouvées chez huit espèces morphologiques, sachant que seulement les espèces les plus communes ont été échantillonnées pour cette étude. Le taux de diversité augmentera certainement avec l'ajout d'échantillonnes de différents taxons, de divers types d'habitat et de régions marines distinctes.
Mots-clés : biodiversité marine; code-barres d'ADN; identification des espèces; Crustacea; diversité cryptique; Atlantique du Nord
ABSTRACT
Biodiversity is the variety of life and can be studied at different levels (genetic, species, ecosystems) and at different scales (spatial and temporal). The past decades have shawn that marine biodiversity has been severely underestimated. To study the characteristics of the great diversity of marine species and the underlying processes of formation and maintenance of marine biodiversity, it is obvious and necessary to know what lives out there. We are now faced with the highest extinction rates since the formation of the human society ("biodiversity crisis") and only a fraction of species was formally described (1.9 million of 11 million), because of a shortage of trained taxonomists available for this immense work, among other things. Ali these factors have led to the proposai of molecular tools to enable and facilitate the identification of species including DNA barcoding. This method uses a DNA fragment of the mitochondrial gene cytochrome c oxidase subunit 1 (COl) as a fast, accurate and cost effective tool to identify species. Thus, each species can be defined by a unique identification tag that will not be changed during taxonomie revisions. ln addition to the assignment of unknown specimens to species identified a priori by taxonomists, data generated through barcoding studies will be very useful for comparative phylogeographic studies of multiple taxa, phylogenetic studies at different taxonomie levels and for studies on evolutionary patterns between groups of organisms.
Chapter 1 provides some background on DNA barcoding with a review on studies that were published on the subject, especially those focusing on the identification of marine species.
Chapter 2 develops a reference library for marine crustaceans from the Estuary and the Gulf of St. Lawrence. Ali data (taxonomy, collection information, images, DNA sequences and chromatograms) are stored online in the Barcode of Life Data Systems (BOLD) and are available for general use. Specimens used for barcoding are kept as "vouchers" in public institutions for future use. The results showed the presence of an invasive amphipod in the estuary (mentioned previously in the Great
Lakes and near Montreal, with impact on the native fauna of amphipods), and the
existence of potential cryptic species in amphipods, mysids and decapods.
Chapter 3 focuses on the use of COl sequences provided through DNA barcoding as a complementary tool for taxonomy and phylogeny of the amphipod family Talitridae
in the North Atlantic. The current distribution and diversity of species is the result of
evolutionary processes and interaction with the environment across a geographie
region. Phylogenetic studies can investigate this issue by developing evolutionary
scenarios on the relationships between taxa. The results show the existence of
cryptic species in three morphological species. ln addition, older genera do not appear to be monophyletic, suggesting the need for taxonomie revisions in this family.
Chapter 4 addresses the issue of genetic diversity which enables the persistence of populations and species over time, allowing continuous adaptation to environmental changes. At large spatial scales, diversity within species can be structured in genealogies according to geography, thus defining phylogeographic patterns, which may coïncide or not with biogeographie divisions. COl sequences generated by DNA barcoding were used to infer phylogeographic patterns in an amphipod species with amphi-Atlantic distribution, Gammarus oceanicus. This species is very abundant and an important part of the intertidal communities and coastal food webs. The results showed a deep division within this species with two divergent groups corresponding to a latitudinal segregation (temperate region of Atlantic Canada versus the subarctic Hudson Bay and Europe), indicating the presence of two potential cryptic species.
This research showed that marine biodiversity, as seen in marine crustaceans from North Atlantic, was underestimated. Potential cryptic species were found in eight morphological species, knowing that only the most common species were sampled for this study. The level of diversity will certainly increase with the addition of different taxa, different types of habitat and distinct marine regions.
Keywords: marine biodiversity; DNA barcoding; species identification; Crustacea; cryptic species; North Atlantic
GENERAL INTRODUCTION
"ln al/ cultures, taxonomie classification means survival. The beginning of wisdom, as the Chinese say, is ca/ling things by their right names"
E.O. Wilson, The Diversity of Life
What's in the "biodiversity" name?
"Biodiversity" is a heavily used term in science and very popular with the
general public (>48 million results on Google, March 2012). lt is a shorthand form of
"biological diversity" and it was defined as "the variability among living organisms
from ali sources including, inter alia, terrestrial, marine and other aquatic ecosystems and the ecological complexes of which they are a part; this includes diversity within species and of ecosystems" (Convention on Biological Diversity, CBD, 1992) or, in simple words, "the variety of life". Conventionally, three levels of biodiversity are recognized (genetic, species, ecosystems) but only one is usually investigated, namely the species level. Reasons for this trend probably include "ease of reach" of species diversity (e.g., observations in nature or experiments, relatively cheap to conduct) and the "ease of understanding" its more intuitive numbers (of species, of individuals etc.). Generally, geographie areas with many species are considered more interesting for conservation than species-poor areas. The species level is, however, more than an easy-to-grasp category due to its practical value: it is a check-list of extant species, a baseline against which to compare future changes towards biodiversity gain or, more likely, biodiversity Joss.
Ali biodiversity levels are interconnected and impacts on any level will trigger responses from the other biodiversity components. For example, genetic variation,
considered to be related to population size (Frankham, 1996; but see Bazin, Glémin and Galtier, 2006), can act as a buffer against environmental changes (natural and anthropogenic), allowing the persistence of populations and species in time. Theory predicts correlations between genetic and species diversity that are either positive (due to environmental heterogeneity and/or time since disturbance) or negative (species richness associated with reduced niche breadth per species, allowing fewer genotypes to coexist) (Lankau, 2011). Ecosystem functioning (e.g., pelagie ecosystem processes) is related to biodiversity in genes, species and functional groups (e.g., richness of producers and consumers) (Duffy and Stachowicz, 2006). Experiments have shown that intraspecific genetic diversity of foundation species (i.e., dominant primary producers) may influence the community structure (i.e., species richness and abundance at higher trophic levels), ecosystem processes and resistance to disturbance (Hughes and Stachowicz, 2004; Reusch et al., 2005; Crutsinger et al., 2006), although the spatial scale has to be considered as weil (Crutsinger, Cadotte and Sanders, 2009).
Biodiversity and ecosystem functioning are directly connected to human well-being through ecosystem services, thus the need to protect biodiversity for the existence of the human society (Figure 1). Humans (Homo sapiens) should not be considered an external factor but an intrinsic part of biodiversity as we are one species among the -8.7 million estimated to exist (Mora et al., 2011 ). Human activities have large impacts on ali levels of global diversity but they are also variable across cultures (although differences between cultures might decrease due to globalization). ln this context, cultural diversity can be considered as an important factor in biodiversity sensu stricto, and even as another level of biodiversity rather than a research subject for a separate field (anthropology). As an index for this diversity, -7,000 languages are spoken worldwide (Davis, 2010), mostly by small groups of indigenous people with livelihoods directly depending on natural resources, thus involved in shaping local biodiversity and continuously evolving with their environment.
r
---,
.. ~ ~F===========
-(
Ptimary production~
~y-~
\\ 27
.
(===
"'j
==
· l\espiration Functional trait c 1 us tC'fÎJl gi-
o---
-i---
;_,:~~---. 1 o Biogeographie 1 1 · 0 1 nteractlon •~
~
gmuping : web/
J
'7(
c 0 ·•1.
,t -oo
o
•
1 ~.5
~
•
0 : 1 •:
*
J
<
o •
o
•
o
1e
A / : 0 • 0 : 0 : · 6 A ù ··~---1 0 0 • 0 1 . / ' .. .. ù*
1 - - - - -t.=_j- - - ' -t...:_t--Emigration immigration 3Figure 1 Relationship between biodiversity, ecosystem functioning and human well-being. Species are represented in the center by black and white abjects with various shapes and sizes. (Source: Naeem et al., 2009)
Marine biodiversity: a few characteristics
Marine biodiversity has long been underestimated due to the general beliet that oceans are homogeneous with limited habitat diversity (compared to land), hence limited species diversity and infrequent speciation events. About 250,000 marine eukaryote species have been described (First Census of Marine Lite, CoML, 201 0). The estimated numbers range, however, from 500,000 (Gray, 1997) to over 10 million (Grassle and Maciolek, 1992) with recent estimates reaching 2.2 million species, which means that -90% of marine species are still to be discovered (Mora
et al., 2011). At higher taxonomie levels, marine diversity is much higher than the
terrestrial counterpart (35 marine phyla versus 11 terrestrial phyla) due to the tact that lite appeared in the sea, and hence has had a longer time for evolutionary diversification (Gray, 1997). The differences in species numbers between land and sea are believed to be quite recent (-11 0 million years ago, MYA), coinciding with an increase in productivity on land, and explained by: i) higher primary productivity on land, on average (although marine kelp forests have higher productivity per surface unit); ii) narrower specialization of terrestrial species; iii) more effective barriers to dispersal on land; iv) greater 3D complexity and niche availability on land; and v) greater viability of low-density populations (and consequently rare species) (Vermeij and Grosberg, 2010).
Biodiversity has a heterogeneous distribution on the planet, with sorne areas being more diverse than others (Gaston, 2000). Sorne marine groups (e.g., bivalves) show a latitudinal diversity gradient with tropics as centers of origin and diversification and poles as species-poor areas (Gaston, 2000 and references therein; Valentine and Jablonski, 201 0). The Arctic regions are less diverse compared to the Antarctic regions due to historical differences such as age and glacial history (Gray, 1997). Other patterns include an increase of species richness from shallow-waters to the deep-sea in soft sediments, higher diversity in the benthic
5 compared to the pelagie realm, a diversity peak for coastal species in the western Pacifie and for oceanic groups at mid-latitudes (Gray, 1997; Tittensor et al., 201 0).
Both species and genes (within species) have a heterogeneous distribution in nature, thus the importance of geography for biodiversity. Species-rich and endemie species-rich areas are considered hotspots of biodiversity, in need of conservation. Likewise, genetically diverse or evolutionary distinct populations (evolutionary significant units, ESU) are hotspots of intraspecific diversity and should be considered as such in conservation plans (Crandall et al., 2000; Rauch and Bar-Yam, 2004).
Current status: threats and mitigation measures
Many species are currently going extinct (or are predicted to do so) leading scientists to declare a state of emergency, or "biodiversity crisis". The world is dynamic with species being formed and lost through natural processes. Large extinction events have occurred throughout Earth's history (five mass extinctions between 440 MYA - 65 MYA; Futuyma, 1998). The genus Homo has also caused marked changes in ecosystems and species extinctions since the formation of primitive human communities. There have been a number of recent calls for defining a "sixth mass extinction" in the eurre nt era, in light of extinction rates between 100-1,000 times higher than pre-human values and estimated future rates 10 times the current rates (Figure 2) (Pimm et al., 1995; Pimm and Raven, 2000; Millennium Ecosystem Assessment, MA, 2005). ln the sea, humans have so far directly caused the global extinction of more than 20 species including mammals, seabirds, fishes, invertebrates and algae, along with many more local or regional extinctions (Sala and Knowlton, 2006 and references therein). As species do not live in isolation but in interactions, the extinction of one species triggers effects at ether biodiversity levels. However, the functional role might be more important than the number of species going extinct perse (O'Connor and Crowe, 2005).
Extinctions per thou sand species per millennlum 100 000 10 000 1000 100 10 0.1 Distant past (fossil record) For fNè')' lhousnnd n)arrm;:tl SI)«:ICS, 165-S M<:wertc..x:tm t'oiè!'f rruth:m11um Recent past (known extinctions) Future (modeled)
1
Pro;octod tuturo extinction rat& ls ~ more than ton timesh îghor ln an rurrem rate
Cumml e~inction rato
11
is up to DilO tllousarld- - - - -tirnos lllghor ihan the
fossil record
\
\
1 -
- < - - - - -- - - -long·terrnavorago ex· ction nl1e0~---
---Marine Mamrnals Mammals Blrds Arnphibians Ali speclcs species
Figure 2 Species extinction rates from fossil data, real data and predictions for the
future. (Source: MA, 2005)
The greatest threats for marine biodiversity include overharvesting, pollution
(partly due to agricultural run-off), habitat destruction, climate change (increasing
surface sea temperatures, acidification due to an increase in C02) and invasive
species (UNEP report on marine biodiversity, 201 0). Coastal systems are more
susceptible to be affected due to a growing human population concentrating on
coastlines (Gray, 1997). lndeed, it has been estimated that no pristine marine area is
left and that 41% of oceans are heavily impacted by hu mans (Figure 3; Halpern et
al., 2008). This view stands in opposition to the view of oceans as open systems,
less susceptible to be seriously affected by human activities (at least pollution)
compared to land (Gray, 1997; Boero, 2009). Marine fisheries are predicted to
collapse by the mid-21 st century (Worm et al., 2006), wh ile local collapses of small fish species can have ecosystem-wide impacts by reducing food supply for larger fish, seabirds, and marine mammals (Pinsky et al., 2011 ).
7
Very Low Impact (<1.4) Med1um Impact (4 95-8 47) • H1gh Impact (12-15 52) Lowlmpact(14--495) Med1UmH1ghlmpact(847-12) • VeryH1ghlmpact(>1552)
Figure 3 Anthropogenic impact on the world's oceans (investigation performed in 20 ecosystem types). Colors correspond to impact intensity, see above. (Source: Halpern et al., 2008)
The present-day extinction rates for species (but also for plant varieties and for domestic animal breeds) are worrisome. One species, our own, has had an enormous influence, directly and indirectly, on the rest of the biodiversity. Equally
impressive are changes in our own cultural diversity. About 50% of existing languages are predicted to disappear within 1-2 human generations (Davis, 201 0). Since languages can be considered as markers of distinct cultures, this implies that we stand to lose "half of humanity's social, cultural and intellectual legacy" (Davis,
201 0). Notably, the globalized, industrializèd culture, which is in great ascension, poses the greatest risk to biodiversity in the conventional sense.
ln order to mitigate global biodiversity loss there is a need for sound
species level attributes (e.g., richness, endemism). However, genetic data should be included as weil when designing marine protected areas (MPA) due to its capability to infer population connectivity in protected species (Palumbi, 2003) and to identify populations with different evolutionary histories in need of protection (Crandall et al., 2000).
The economies of biodiversity
Humans are an intrinsic part of global biodiversity and our very existence depends heavily upon biodiversity preservation. We are living in a dynamic environment and we are witnessing a shift in our perception on biodiversity and its importance. Since the formai recognition of the term, biodiversity was considered important and worthy of conservation measures due to its role in supplying food, raw materials, biotechnological resources, ecosystem health and many other services (Table 1 ), although the ove rail value was difficult to grasp. ln this context, a new approach focused on applying economie concepts to biodiversity valuation has been proposed and a synthesis on the global economie benefits of biodiversity and the costs of biodiversity loss has been published (TEEB, 201 0). The overall goal of this emerging direction is to provide a link between science, policy making and business, thus a new vision for managing natural resources.
Ecosystem "goods and services" (provisioning, regulating, cultural and supporting services; MA, 2005) have been valued at US$ 16-54 trillion per year (average of US$ 33 trillion/year) for the entire biosphere while the global gross domestic product was -US$ 18 trillion per year (Costanza et al., 1997). The marine environment contributes -63% of the estimated value with most services coming from coastal systems (US$ 10.6 trillion/year). For instance, half a billion people depend on coral reefs for their livelihoods and the monetary value of reefs was
9
estimated at US$ 6,000/ha/year (Constanza et al., 1997) or US$ 360 million/year for
Hawaiian reefs alone (TEEB 201 0).
Table 1 Ten economie, ecological, moral, and legal reasons why society needs to
protect and manage biodiversity (Modified from Castello, 1998) Economie
1 lt is essential for the assimilation and recycling of wastes derived from human
activity.
2 lt is the source of food for hu mans and domestic animais.
3 lt provides valuable recreational resources.
4 lt contains biotechnological resources of increasing commercial importance.
5 lt produces non living resources of commercial importance.
Ecological
6 lt supports economie resources through the food web and interaction between
species.
7 lt maintains local-ta-global ecosystem health through its interaction with the
physical and chemical environment (e.g., atmospheric carbon dioxide,
oxygenation) and can buffer the world against climate change.
Moral and Ethical
8 lt is generally accepted that other life forms have a right to exist, and that
humans have a responsibility of stewardship to protect our natural inheritance
for future generations. lndeed, a review of history suggests that we can have
little idea of what uses and values future generations may discover in
biodiversity.
9 The production of unnecessary waste, and thus pollution, can be considered
immoral. Legal
10 The Convention on Biological Diversity and other laws now place a legal obligation on most countries and their citizens to protect and sustainably use
biodiversity. This is essential because sorne people will either not have the
ability or willingness to understand the importance of biodiversity, or their short-term selfishness and greed will result in their activities reducing biodiversity.
TEEB might be seen as giving a priee to something priceless. However, it might be an effective direction for sustainable development because the human mind can deal better with numbers (e.g., US$ 19,580/ha/year for swamp/floodplains) than with ecological/ethical reasons when protecting nature. As global biodiversity and services it provides are dynamic, there is a need to forecast modifications associated with climate change and globalization, to update CBD to the current pace of global change and to find viable solutions at local, regional and global levels (Bayon and Jenkins, 201 0; Mooney, 201 0; TEEB 201 0). However, a prerequisite for ali conservation plans is to know the extent of biodiversity, how it was developed and what processes maintain it.
The origin of marine biodiversity - how do species arise?
Those people who believe that life is dynamic and continuously evolving have wondered about the underlying mechanisms of diversification (an intrinsic part of biodiversity). Marine organisms are not uniformly distributed but they are rather grouped into local populations connected by dispersal. The ability to maintain population connectivity in the sea will affect the genetic structure, which ranges from lack of structure, indicating panmixia, to various degrees of differentiation, which will eventually culminate in the formation of new species (Figure 4) (Hedgecock, 1986;
Palumbi, 1994; Bohonak, 1999). Dispersal capability in the sea is mainly determined by biological factors such as the developmental mode of organisms and by environmental factors such as the oceanographie features. Pelagie species (the less diverse component of marine biodiversity; Gray, 1997) are usually highly dispersive through ocean currents, and are therefore believed to be panmictic. Benthic species
(accounting for 98% of marine species; Brunei, 2005) usually have an adult benthic phase and a larval pelagie phase. Larvae are released into the water column and can disperse over large spatial scales via oceanographie currents depending on the
11
rate and direction of the currents (Scheltema, 1986; Hohenlohe, 2004). Other benthic species are direct developers with eggs hatching into juveniles or non-dispersive larval forms (often associated with maternai care), thus lacking a pelagie larval phase and apparently being highly restricted in their dispersal. Alternative modes of dispersal for benthic taxa include adult active dispersal (by swimming or crawling) and passive dispersal through rafting on floating objects or transport by human vectors (e.g., shipping) (Scheltema, 1986; Thiel and Gutow, 2005).
BIODIVERSITY (species richness)
1 /
SPECIATI ON 1
Genetic ...,.._
1
Gene flow1
...,.._
Dispersaldifferentiation (active, passive)
'
1 1Other factors: oceanographie
features, historical biogeography, demographie history, behaviour,
natural selection
1 1 1
Figure 4 Factors affecting the genetic differentiation, and thus speciation and
biodiversity, in the sea. (Partially compiled from Palumbi, 1994 and Grosberg and Cunningham, 2000)
Measuring dispersal in the marine environment is a difficult task but is crucial in determining the size of spatial neighborhoods to be considered in management plans (Palumbi, 2004). Historical patterns of dispersal can be indirectly inferred from fossil data (when such data exist), while the present-day dispersal can be directly measured by tagging organisms or indirectly inferred from genetic data. Tracking individuals with various electronic deviees is used mainly for marine vertebrates (mammals, turtles, seabirds, fishes) (Biock et al., 2011 ), less so for invertebrates
(Frei re and Gonzalez-Gurriaran, 1998; Gilly et al., 2006) and only for the adult or late-juvenile phases. Therefore, genetic studies are widely employed to investigate the influence of marine dispersal on gene flow and genetic structure with the prediction that direct developers (or species with abbreviated larval development) will show stronger genetic structure (potentially leading to isolation by distance and even allopatric fragmentation) compared to species with dispersive larval phases. lndeed, support for these theoretical expectations has been found in studies of bryozoans (Watts and Thorpe, 2006), gastropods (Kyle and Boulding, 2000; Collin, 2001; Johnson and Black, 2006) and crustaceans (Teske et al., 2007). However, many ether genetic studies found various patterns not concordant with the developmental mode- gene flow hypothesis (Costa et al., 2004; Richards et al., 2007; Weetman et al., 2007; Luttikhuizen et al., 2008). Based on genetic evidence, dispersal (i.e., successful movement to a new location) cannet be equalled with gene flow (i.e., successful reproduction of migrants in the new location), although direct developers are obviously less connected at the geographie and genetic levels (Hedgecock, 1986; Scheltema, 1986; Bohonak, 1999). Genetic differentiation and marine speciation are also influenced by environmental factors (e.g., oceanographie features, climatic oscillations, plate tectonics, topography) as weil as demographie history, or behavioral, ecological and genetic factors (Figure 4) (review in Palumbi, 1994 and Grosberg and Cunningham, 2000).
The evolution of genetically divergent populations into closely related species (i.e., reproductively isolated units) is based on the appearance of pre/post-zygotic reproductive barriers (e.g., oceanographie features, environmental tolerance, habitat specialization, mate preference and recognition, spawning synchrony, fertilization, offspring viability) (Palumbi, 1994), even if sorne external barriers are temporary (Hohenlohe, 2004). Depending on the spatial scale involved in the formation of reproductive barriers, speciation can be allopatric, parapatric, peripatric and sympatric (Figure 5) and while the allopatric mechanism seems more likely to occur (reproductive isolation is "helped" by geographie separation), ether mechanisms are
13 also occurring in the sea and might be even more common than previously believed (Malay and Pau lay, 201 0; Miglietta, Faucci and Santini, 2011 and references therein).
(A) (B) (C)
~0
...
t
o
~or
...
1Figure 5 Speciation models depend on the spatial scale involved. A: allopatric mode! when reproductive isolation occurs between populations physically isolated; B: peripatric mode! (founder effect) with a small population being physically separated and evolving towards reproductive isolation; C: parapatric mode! with reproductive barriers occurring between contiguous populations due to low dispersal; D: sympatric mode! with reproductive barriers developing within the same geographie area.
(Source: Futuyma, 1998)
The application of molecular techniques to the study of marine biodiversity and speciation has challenged the once widely-held view of oceans as homogenous environments with few barriers to dispersal, and of marine species as truly panmictic with large population sizes, high fecundity and high dispersal capability. ln the light of genetic evidence, speciation appears to be very common in the sea (review in Palumbi, 1994 and Miglietta, Faucci and Santini, 2011 ). Dispersal in sorne groups is
up to 10-100 km (e.g., adult demersal fishes and invertebrates) and larval dispersal of only 1 0-1 00 km in invertebrates and of only up to 50-200 km in fishes (review in Palumbi, 2004). Cryptic speciation, due to ecological divergence of species without morphological differentiation, is also common in the sea (Knowlton, 1993). The end product of this process, namely cryptic species, cannot be identified based on morphological characters but just by using molecular methods. Many taxa previously considered cosmopolitan are actually complexes of cryptic species with geographical separation. Other cryptic complexes followed a sympatric model of speciation with reproductive barriers resulting from differences in habitat choice or resource use (Miglietta, Faucci and Santini, 2011 and references therein). Cryptic species are a hidden aspect of marine biodiversity and seem to occur across ali marine groups, therefore the extent of marine biodiversity (i.e., species richness) might eventually rival that of the terrestrial realm after more detailed investigation. The identification of cryptic species can be highly controversial (see the following sections) but genetic data can reveal at least the existence of intraspecific genetic groups that are very divergent from one another and, usually, separated geographically (i.e., phylogeographic groups) (Avise et al., 1987) according to marine biogeographie divisions (Dawson, 2001). Whether or not a cryptic species is formally recognized, the occurrence of such intraspecific divergent groups indicates a separate evolutionary history (i.e., ESU), and hence of importance for biodiversity and for management strategies.
Towards a global inventory
The need to have a global inventory of extant species is not provoked only by our curiosity and ambition to organize nature in a professional way (e.g., a stamp collection). Such a checklist will act as a baseline for assessing future biodiversity changes with implications on ecosystem services and, consequently, on human well -being. Moreover, it will help us understand the ecological and evolutionary processes
15 which are generating and maintaining biodiversity. Surprisingly for the general public, the number of world extant species (or even described species) is unknown. Not surprisingly for scientists, the difficulty in adding up numbers cames from the weakness of extrapolation methods to estimate richness, the scarce sampling of the Earth, the multitude of synonyms (2 million names for 1.6 million described species; Stark, 1997) and taxonomie splitting (i.e., division of one species into two or more). lt has been suggested that the number of species on Earth lies anywhere between 3 and 100 million species (Wilson, 2003 and references therein), but most likely around 11 million species inhabit the planet (Chapman, 2009). The latest estimate is a bit lower, -8.7 million species, but still indicates a large amount of species awaiting discovery (Mora et al., 2011). ln addition, we lack sound information on most species that do have names (e.g., distribution ranges, threat of extinction; Stark, 1997).
Traditionally, species have been classified, named and described according to their morphological characteristics within the field of taxonomy (i.e., alpha-taxonomy). This procedure follows a strict protocol according to the International Codes of Nomenclature by which species have unique binomial scientific names (genus and species) and are linked to type specimens (from type localities) preserved in museum collections. Establishing this Linnaean taxonomie system is a very laborious task, which involves the analysis of, ideally, hundreds or thousands of specimens per species in arder to assess the extent of intraspecific morphological variation. Consequently, only a fraction of presumed species richness has been described in 250 years. About 6,000 taxonomists are believed to practise worldwide (Wilson, 2003) and their number is rapidly decreasing due to shortage in funding and to the lack of interest in pursuing a "dead" specialization on the job market. The resulting "taxonomie impediment" and the eurre nt progress in classifying life ( -1 ,600 species described everyyear; Bouchet, 2006) predict a timeframe of >1 ,000 years for an inventory of marine biodiversity alone. Considering also the rates of biodiversity loss, it is evident that many species will go extinct before we even know
With the lack of trained personnel and the inherent difficulties to identify many
invertebrate groups (especially the various life history phases of species with
complex life histories and groups with highly plastic morphology such as corals), it is no wonder that marine faunal inventories usually fail to identify one third of specimens to the species level (Schander and Willassen, 2005). ln addition, cryptic species will add to the species level of biodiversity (once they are validated) but also to the difficulty in compiling such lists as they are almost impossible to detect by
morphological characters. Therefore, molecular methods have been proposed for
species identification (DNA barcoding) as weil as for a new taxonomie system
(DNA-taxonomy; Tautz et al., 2003).
A new tool: DNA barcoding
The term "DNA barcoding" was coined by analogy with the Universal Product Codes, in which every product has a unique barcode, and it was proposed as a fast,
reliable and cast-effective identification tool that uses DNA sequences unique to each species (Hebert et al., 2003). ln most animais, this approach uses a fragment
of the mitochondrial (mt) gene cytochrome
c
oxidase subunit 1 (COl) to assignunidentified specimens to known species (previously identified by experts and stored in a reference DNA library). The choice of mtDNA over nuclear DNA is based on a few characteristics: i) large copy numbers in each cell, therefore easier to amplify from small amounts of tissue or when DNA is degraded; ii) maternai inheritance,
therefore no recombination (but see Galtier et al., 2009); iii) higher evolutionary rate;
and iv) lack of introns (Hebert et al., 2003). 1 n most animais, the circular mt genome
includes 24 genes for mtDNA translation (2 ribosomal RNAs: 12S, 16S; 22 transfer RNAs) and 13 protein-coding genes for the electron transport chain (Figure 6).
These 37 genes interact with -1 ,500 genes encoded by nuclear DNA (nDNA)