HAL Id: hal-01374401
https://hal.archives-ouvertes.fr/hal-01374401
Submitted on 25 May 2018
HAL is a multi-disciplinary open access archive for the deposit and dissemination of sci-entific research documents, whether they are pub-lished or not. The documents may come from teaching and research institutions in France or abroad, or from public or private research centers.
L’archive ouverte pluridisciplinaire HAL, est destinée au dépôt et à la diffusion de documents scientifiques de niveau recherche, publiés ou non, émanant des établissements d’enseignement et de recherche français ou étrangers, des laboratoires publics ou privés.
SpottingNet: Learning the Similarity of Word Images
with Convolutional Neural Network for Word Spotting
in Handwritten Historical Documents
Zhuoyao Zhong, Pan Weishen, Harold Mouchère, Christian Viard-Gaudin, Jin
Lianwen
To cite this version:
Zhuoyao Zhong, Pan Weishen, Harold Mouchère, Christian Viard-Gaudin, Jin Lianwen. SpottingNet: Learning the Similarity of Word Images with Convolutional Neural Network for Word Spotting in Handwritten Historical Documents. International Conference on Frontiers in Handwriting Recognition (ICFHR), Oct 2016, Shenzhen, China. �10.1109/ICFHR.2016.58�. �hal-01374401�
SpottingNet: Learning the Similarity of Word Images with Convolutional Neural
Network for Word Spotting in Handwritten Historical Documents
Zhuoyao Zhong, Weishen Pan, Lianwen Jin+
School of Electronic and Information Engineering South China University of Technology
Guangzhou, China z.zhuoyao@mail.scut.sdu.cn
+lianwen.jin@gmail.com
Harold Mouchère, Christian Viard-Gaudin
IRCCyN/IVC - UMR CNRS 6597 Ecole Polytechnique de I’Université
Nantes, France
harold.mouchere@univ-nantes.fr christian.viard-gaudin@univ-nantes.fr
Abstract—Word spotting is a content-based retrieval process
that obtains a ranked list of word image candidates similar to the query word in digital document images. In this paper, we present a convolutional neural network (CNN) based end-to-end approach for Query-by-Example (QBE) word spot-ting in handwritten historical documents. The presented mod-els enable conjointly learning the representative word image descriptors and evaluating the similarity measure between word descriptors directly from the word image, which are the two crucial factors in this task. We propose a similarity score fusion method integrated with hybrid deep-learning classifica-tion and regression models to enhance word spotting perfor-mance. In addition, we present a sample generation method using location jitter to balance similar and dissimilar image pairs and enlarge the dataset. Experiments are conducted on the George Washington (GW) dataset without involving any recognition methods or prior word category information. Our experiments show that the proposed model yields a new state-of-the-art mean average precision (mAP) of 80.03%, sig-nificantly outperforming previous results.
Keywords-component; word spotting; similarit learning; similarity score fusion; convolutional neural network
I. INTRODUCTION
With the increased demand for text understanding and semantic analysis in document images and the lack of relia-ble and robust optical character recognition (OCR) for spe-cific languages, symbols or low quality images, word spot-ting has attracted considerable attention from the document analysis community. The goal of word spotting is to search an ordered list of word image candidates similar to the que-ried word in the entire image dataset during the con-tent-based retrieval procedure. According to the different representations of the query word, there are two main ap-proaches to word spotting, namely, Query-by-String (QBS) [4] and Query-by-Example (QBE) [1]. If the query word is represented as an arbitrary text sequence, the technique used is QBS; alternatively, if an image of the queried word exists in the document, QBE is used.
In this work, we focus on QBE and assume that an anno-tated location of the word in the document images is sup-plied; thus, we apply the cropped word image directly with-out involving text localization and segmentation. That is, we mainly address the content-based retrieval process. The two
key challenges of QBE word spotting are the representation of word images and the similarity measure between word image representations. Most popular algorithms are based on applying projection profiles [2][3], word geometry infor-mation [2][3], statistical features [7], SIFT [6][9], or other hand-crafted features to generate fixed or variable length feature sequences for word image descriptors, while using Dynamic Time Warping (DTW) [2][3][5][6], Hidden Mar-kov Models (HMMs) [6][7] and BLSTM [4][8] to measure the relevance of the word feature representations; and achieved promising results on different word spotting benchmarks.
However, effectively spotting words in image-based documents, especially handwritten or historical documents, poses a great challenge owing to the large variability and confusion of handwritten manuscripts or the low quality of historical images, resulting in inadequate performance of previous research. For example, the state-of-the-art mean average precision (mAP) of a widely used historical hand-written dataset, known as the George Washington (GW) da-taset [2], is about 62.72% [9] in the case where recognition methods and prior word category information are not acces-sible in the literature.
Conversely, with the increased development of deep learning algorithms in recent years, convolutional neural networks (CNN) [10] have enabled a breakthrough in many computer vision tasks [11-16]. Many research studies have subsequently applied CNNs to learn the similarity of two input image patches. Zbontar and Lecun [17] proposed CNN-based methods to learn the similarity of image patches for a stereo matching problem and showed improved per-formance results on the KITTI datasets. Hu et al. [19] pre-sented a discriminative deep metric learning method using a CNN for face verification in the wild and achieved very promising performance on the LFW and YFT datasets. Zagoruyko et al. [18] applied several different CNN archi-tectures to compare image patches as well as encode a gen-eral similarity function and attained the best results on sever-al locsever-al image patch benchmarks.
In this paper, we propose a similarity score fusion meth-od based on a deeply trained classification and regression model in a complementary, facilitative and optimized man-ner. Our designed models can learn the word descriptors and similarity score between word descriptors directly from a
cropped word image thanks to the CNN’s outstanding end-to-end mechanism. Moreover, through the presented location jitter sample generation approach, we can construct a balanced and sufficiently large dataset with positive (simi-lar) image pairs and negative (dissimi(simi-lar) image pairs of word images to overcome data imbalance problem. Inspired by [18], we design different traditional CNN architectures, including 2-channel, Siamese, and pseudo-Siamese networks to investigate the similarity learning performance of diverse models.
The remainder of this paper is set out as follows. Section 2 gives a detailed introduction to our approaches, while Sec-tion 3 presents our experimental results and an analysis thereof. Finally, the conclusion is given in Section 4.
II. METHODOLOGY
A. Learning optimization
It is noted that we can consider the similarity comparison of two word images as a classification as well as a regression problem by collecting a dataset with positive and negative word image pairs using supervised learning. For the classifi-er, we can obtain a 2-dimensional label distribution, while for the regressor, a 1-dimensional similarity score ranging from 0 to 1 can be acquired directly. Suppose we have categories and the training data for each category are denoted as , , where and are the feature vector and label, respec-tively. Specifically, means it is a similar image pair, and zero denotes a dissimilar pair. In addition, is represented as the model parameters, and as the weight decay for regularization.
1) Classification model: With the development of deep
learning algorithms, using the softmax loss function for classification problems [12] has become popular. The loss is described as: ‖ ‖ {∑ ∑ { } ∑ } (1) where ∑ is a factor of normalization, and is
the indicator function defined as following: {
. (2)
Furthermore, as hinge loss function is also widely used for binary classification, hence we intend to evaluate the performance of the same model with an embedded corre-sponding loss function for optimization. The hinge loss func-tion is given by Eq. (3).
‖ ‖ {∑ ∑ { }
}
(3) where is given as:
{ } {
(4)
The loss functions defined in Eq. (1) and (3) can be minimized by the stochastic gradient descent algorithm dur-ing the traindur-ing process.
2) Regression model: For the regression model, we use
the binary cross-entropy loss for training and obtain a similarity value mapped onto the range [0, 1] by the sigmoid function. The loss is given:
‖ ‖ {∑
}
(5) where is defined as ⁄ The output of the model is expected to be closed to the target label.
3) Similarity score fusion method: As previously
men-tioned, the similarity measure for word image pairs can be regarded as a classification and a regression problem, and thus we assume that these two model types can be combined to improve the performance in a joint and complementary manner. In this section, we explain the similarity score fu-sion method based on a deep learning classifier and regressor model. Suppose and are the similarity confidence
scores obtained from the classifier and regressor model, re-spectively. The classifier obviously provides a 2-dimensional class distribution, and can be computed in terms of
probability normalization as:
∑ . (6)
The regressor outputs 1-dimesional similarity score directly and we map it onto the range [0, 1] via a sigmoid function. Thus, is denoted as:
. (7)
Moreover, the fusion similarity score is denoted as: ( ) (8)
where is the fusion function and is the
input for .
Our experiments in next section will show that our pro-posed score fusion method yields a better mAP result than using only single classification or regression model. An overview of similarity score fusion is illustrated in Fig. 1.
Figure 1. Score fusion method based on deep-learning classifier and regressor models.
DCNN Network 2-dimension Label Distribution DCNN Network 1-dimension Similarity Score
Classifier Score Fusing Regressor
Output Similarity Confidence Score Sigmoid Normalization
B. Location jitter for data augmentation
There are not nearly as many positive pairs as negative pairs, which may result in data imbalance and incorrect net-work guidance. For instance, suppose there are words from classes with images per class . In this case, we can collect positive image
pairs, and negative pairs, which
easily leads to the conclusion that ,
. Under the condition , it is obvious that
is much greater than . Therefore, it is necessary to
arti-ficially enlarge the dataset by a label-preserving transfor-mation to keep the data balanced. In this work, we present a random location jitter approach to augment the data and re-tain the word content information integrity as far as possible, which is crucial to word image similarity learning. The pro-posed sample generation method is described below:
Given an original word image of size , cal-culate its center point coordinate .
De-note as the jittered target center
point coordinate;
Define [ ] and [
], where denotes the union distribution, and represent the jitter scope on the x- and y-axes, respectively, and with used in
practice. Sample and to obtain
;
Apply as the central anchor to crop
the image patch of size .
In this way, several jitter-generated samples for each original word image can be obtained. Using this data aug-mentation operation, we can greatly increase the number of positive pairs and then randomly select an equal number of negative pairs to keep the data balanced.
C. Network models
Inspired by [18], we use the following three fundamental CNN models to compare the similarity of two cropped word images, as well as to evaluate the trade-off between flexibil-ity and performance, while taking into consideration the effi-ciency of the different models.
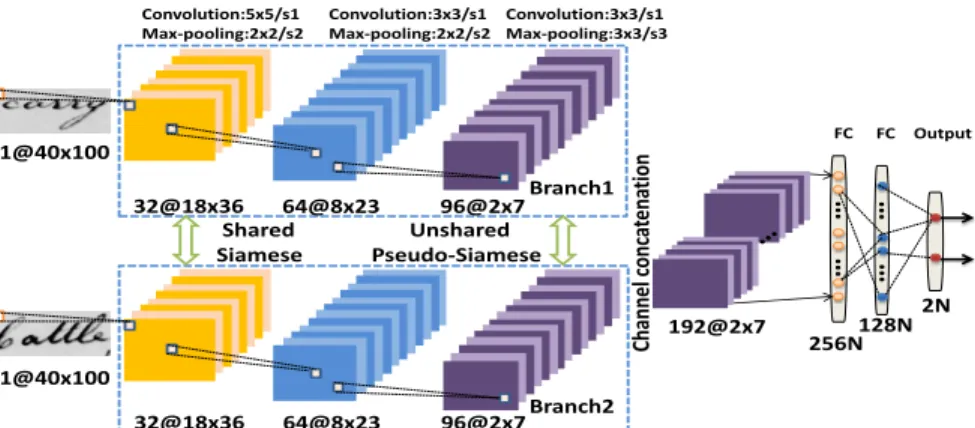
Siamese network [20][21] is divided into two dependent
branches with each branch sharing parameters in every weighted layer. Each branch takes one of image pair as input and proceeds to feature extraction via a series of convolu-tional and sub-pooling layers synchronously. The equal-size feature maps extracted from each branch are concatenated across the channel and then connected to the decision net-work (classification or regression netnet-work) to calculate the similarity measure of this word image pair.
Pseudo-siamese network resembles the Siamese
net-work, but differs in that its two branches are independent without shared parameters. This increases the number of parameters, while improving the flexibility of the network architecture for each branch.
2-channel network applies an image pair as a 2-channel
input image array, with the channels jointly convolved in the first convolutional layer. This is the most flexible and fastest of the three network models with respect to the training pro-cess. The three network model architectures designed are depicted in Figs. 2 and 3.
Figure 2. Illustration of 2-channel regression network model.
Convolution:5x5/s1 Max-pooling:2x2/s2 Convolution:3x3/s1 Max-pooling:2x2/s2 Convolution:3x3/s1 Max-pooling:3x3/s3 FC
…
…
…
…
FC Output 2@40x100 32@18x36 64@8x23 96@2x7 256N 128N 1NFigure 3. Overview of Siamese and pseudo-Siamese classification network models.
Output 2N Convolution:5x5/s1 Max-pooling:2x2/s2 Convolution:3x3/s1 Max-pooling:2x2/s2 Convolution:3x3/s1 Max-pooling:3x3/s3 FC … … … … 1@40x100 32@18x36 64@8x23 96@2x7 256N128N 1@40x100 Branch1 Branch2 Shared Unshared Siamese Pseudo-Siamese 32@18x36 64@8x23 96@2x7 192@2x7 Cha nnel co nc at ena tio n FC
Fig. 5. mAP results of similarity score fusion method
over five runs.
1 2 3 4 5 0.50 0.55 0.60 0.65 0.70 0.75 0.80 Experiment No. m AP 2-ch-cls 2-ch-reg 2-ch-cls+2-ch-reg
III. EXPERIMENTS ANDANALYSIS
A. Experimental data
The GW dataset [2] is a collection of 20 pages of letters and 4860 words annotated at word level written by George Washington and his assistants. The dataset was split ran-domly into 15 pages for training and the remaining five pag-es for tpag-esting, so a certain category of word, which may exist in the testing set, is not likely to appear in the training set. Having evaluated the aspect ratio (height/width) and width distribution (width is more important for the word image itself) of the dataset, we decided to normalize the word im-ages to size 40×100. Standard mAP was used as the evalua-tion method.
B. Implementation details
We trained our proposed classification and regression model from scratch via back-propagation and stochastic gra-dient descent (SGD) in an end-to-end manner. All the weights of the new layers were initialized with a zero mean and a standard deviation of 0.01 Gaussian distribution. The base learning rate was 0.01 and divided by 10 for each 50K mini-batch until convergence. We use a momentum of 0.9 and weight decay of 0.0002. Our experiments were carried out on the popular CNN platform, Caffe [22], using a GTX TITAN BLACK GPU card. Furthermore, for the similarity score fusion function , we simply set as: ( ) in practice after
empirically observation.
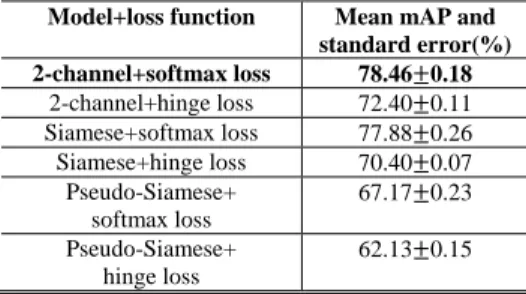
C. Evaluation of three classification models embedded corresonding binary loss function for optimization
In this section, we compare the performance of the pro-posed three fundamental classification models with an em-bedded corresponding loss function on the five-page testing dataset over five runs using the same training details and strategies. The results are given in Table 1. It is generally seen that the 2-channel network is superior to the other two models and the softmax loss function is better suited to this similarity learning task. The best mean mAP and standard error (%) performance of the 2-channel model with softmax loss function is 78.46 0.18.
D. Analysis of similarity score fusion approach
An important finding from our experiments is that the 2-channel network precedes the other model architecture.
Thus, when considering this similarity learning task as a re-gression problem, we also trained a 2-channel CNN-based regression model with embedded binary cross-entropy loss for optimizing from scratch to obtain a 1-dimensional simi-larity score. In this way, we obtained an average mAP and standard error (%) of 77.51±0.27. As mentioned above, the mAP rate of the proposed 2-channel classification model with softmax loss function for training is 78.46±0.18. In this section, we evaluate these two models ensemble perfor-mance using the proposed similarity score fusion method. The corresponding experiments are denoted as 2-ch-cls, 2-ch-reg, and 2-ch-cls+2-ch-reg, respectively. Figure 5 shows the results of the three experiments over five runs. It can be seen that our score fusion method yields a better mAP result than using only a single classifier or regressor model with the best mAP of 80.03%.
E. Comparison with different methods on GW dataset
To further evaluate our proposed approaches, we com-pared the performance of different QBE word spotting methods on the GW dataset without involving recognition methods or any word category prior information. The com-pared methods include DTW [5], SC-HMM [5], BoVW+Cosine Distance [6], and SIFT+FV [9] with the sults given in Table 2. It is worth noting that not all the re-sults are directly comparable because the training and testing dataset partitions are not official and may differ from each other. However, the published results in the literature provide an evaluable measure of the proposed ideas in the expected scope. In the table, we can see that our 2-ch-cls or
2-ch-cls+2-ch-reg model outperforms previous
state-of-the-art results with a 15%–38% improvement in mAP. To the best of our knowledge, this is the first time CNN-based methods have been applied to learn the similari-ty of two word image patches for QBE word spotting. The qualitative results for word spotting on the GW dataset are shown in Fig. 6.
Table 1 Comparison of three network models with
coresponding loss function in terms of mAP for five runs.
Model+loss function Mean mAP and standard error(%) 2-channel+softmax loss 78.46 0.18 2-channel+hinge loss 72.40 0.11 Siamese+softmax loss 77.88 0.26 Siamese+hinge loss 70.40 0.07 Pseudo-Siamese+ softmax loss 67.17 0.23 Pseudo-Siamese+ hinge loss 62.13 0.15
Table 2 mAP of our proposed techniques and reported
meth-ods using the GW for word spotting
Methods mAP(%) BoVW+Cosine Distance [6] DTW [5] SC-HMM [5] SIFT+FV [9] 42.20 50.00 53.10 62.72 Proposed 2-ch-cls 78.46 Proposed 2-ch-cls+2-ch-reg 80.03
IV. CONCLUSION AND DISCUSSION
In this paper, we presented a CNN based end-to-end ap-proach for QBE word spotting in historical handwritten documents. A new similarity score fusion method based on a deep-learning classification model and regression model was proposed to achieve better retrieval performance. Further-more, we presented a location jitter sample generation method that retains the maximum word content information, to construct a balanced and sufficiently large image pair da-taset. In addition, we explored three different CNN architec-tures embedding two common loss functions for classifica-tion. We showed that the 2-channel network is superior to both the Siamese and pseudo-Siamese networks while the softmax loss function is better suited to this task. Using the proposed score fusion method, we achieved improved mAP performance in a complementarily optimized way. The best mAP rate we obtained is 80.03% on the GW dataset, which is a significant improvement over previous approaches
ACKNOWLEDGMENT
We gratefully appreciate the support of NVIDIA Corpo-ration with the donation of GPUs used for this research.
REFERENCES
[1] R. Manmatha, C. Han, et al, “Word spotting: A new approach to indexing handwriting,” In Conference on Computer Vision and Pattern Recognition(CVPR), 2003.
[2] T. M. Rath and R. Manmatha, “Word Image Matching Using Dynamic Time Warping,” In Conference on Computer Vision and Pattern Recognition(CVPR), 2003.
[3] T. Rath and R. Manmatha, “Word spotting for historical documents,” Int. Journal on Document Analysis and Recognition, 9(2–4): 139–152, 2007.
[4] V. Frinken, A. Fischer, et al, “Adapting BLSTM neural network based keyword spotting trained on modern data to historical documents.” IEEE International Conference on Frontiers in Handwriting Recognition(ICFHR), 2010.
[5] J.A. Rodriguez-Serrano and F. Perronnin, “A Model-Based Sequence Similarity withApplication to Handwritten Word Spotting,” IEEE Transactions on Pattern Analysis and Machine Intelligence, 34(11): 2108-2120, 2012.
[6] J. Lladós, M. Rusiñol, et al, “On the influence of word representations for handwritten word spotting in historical documents,” Int. Journal
of Pattern Recognition and Artificial Intelligence, 26(05): 1263002, 2012.
[7] A. Fischer, A. Keller, et al, “Lexicon-free Handwritten Word Spotting Using Character HMMs,” Pattern Recognition Letter, 33 (7): 934– 942, 2012.
[8] V. Frinken, A. Fischer, et al, “A novel word spotting method based on recurrent neural networks,” IEEE Transactions on Pattern Analysis and Machine Intelligence, 34(2): 211–224, 2012.
[9] J. Almazán, A. Gordo, et al, “Word spotting and recognition with embedded attributes,” IEEE Transactions on Pattern Analysis and Machine Intelligence, 36(12): 2552-2566, 2014.
[10] Y. Lecun, L. Bottou, et al, “Gradient-based learning applied to document recognition,” Proceedings of the IEEE, 86:2278–2324, 1998.
[11] G.E. Hinton and R.R. Salakhutdinov, “Reducing the dimensionality of data with neural networks,” Science, 313(5786): 504-507, 2006. [12] A. Krizhevsky, I. Sutskever, “Imagenet classification with deep
convolutional neural networks,” In Neural Information Processing Systems Conference(NIPS), 2012.
[13] R. Girshick, J. Donahue, et al, “Rich feature hierarchies for accurate object detection and semantic segmentation,” In Conference on Computer Vision and Pattern Recognition (CVPR), 2014.
[14] M. Jaderberg, K. Simonyan, et al, “Reading text in the wild with convolutional neural networks,” International Journal of Computer Vision, 1-20, 2014.
[15] H. Noh, H. Seunghoon, et al, "Learning Deconvolution Network for Semantic Segmentation," arXiv preprint arXiv:1505.04366 , 2015. [16] A. Karpathy and F.F. Li, “Deep visual-semantic alignments for
generating image descriptions,” In Conference on Computer Vision and Pattern Recognition(CVPR), 2015.
[17] J. Žbontar and Y. LeCun, “Stereo Matching by Training a Convolutional Neural Network to Compare Image Patches,” arXiv preprint arXiv:1510.05970, 2015.
[18] S. Zagoruyko and N. Komodakis, “Learning to Compare Image Patches via Convolutional Neural Networks,” In Conference on Computer Vision and Pattern Recognition(CVPR), 2015.
[19] J.L. Hu, J.W. Lu, et al, “Discriminative Deep Metric Learning for Face Verification in the Wild,” In Conference on Computer Vision and Pattern Recognition(CVPR), 2014.
[20] J. Bromley, I. Guyon, et al, “Signature Verification using a "Siamese" Time Delay Neural Network,” In Neural Information Processing Systems Conference(NIPS), 1994.
[21] S. Chopra, R. Hadsell, et al, “Learning a Similarity Metric Discriminatively, with Application to Face Verification,” In Conference on Computer Vision and Pattern Recognition(CVPR), 2005.
[22] Y. Jia, E. Shelhamer, el al, “Caffe: Convolutional architecture for fast feature embedding,” In Proceedings of the ACM International Conference on Multimedia(ACM), 2014.