HAL Id: hal-00617162
https://hal.archives-ouvertes.fr/hal-00617162
Submitted on 26 Aug 2011
HAL is a multi-disciplinary open access
archive for the deposit and dissemination of
sci-entific research documents, whether they are
pub-lished or not. The documents may come from
teaching and research institutions in France or
abroad, or from public or private research centers.
L’archive ouverte pluridisciplinaire HAL, est
destinée au dépôt et à la diffusion de documents
scientifiques de niveau recherche, publiés ou non,
émanant des établissements d’enseignement et de
recherche français ou étrangers, des laboratoires
publics ou privés.
Modern displays: Why we see different colors, and what
it means?
Abhijit Sarkar, Laurent Blondé, Patrick Le Callet, Florent Autrusseau, Jürgen
Stauder, P. Morvan
To cite this version:
Abhijit Sarkar, Laurent Blondé, Patrick Le Callet, Florent Autrusseau, Jürgen Stauder, et al.. Modern
displays: Why we see different colors, and what it means?. 2nd European Workshop on Visual
Infor-mation Processing (EUVIP), 2010, Jul 2010, paris, France. pp.1 - 6, �10.1109/EUVIP.2010.5699137�.
�hal-00617162�
MODERN DISPLAYS: WHY WE SEE DIFFERENT COLORS, AND WHAT IT MEANS?
Abhijit Sarkar
1,2, Laurent Blondé
1, Patrick Le Callet
2, Florent Autrusseau
2, Jürgen Stauder
1, Patrick
Morvan
11
Technicolor Research & Innovation, Rennes, France
2
IRCCyN-IVC, Polytech’ Nantes, University of Nantes, Nantes, France
ABSTRACT
One of the basic tenets of conventional applied colorimetry is that the whole population of color normal observers can be represented by a single “standard” observer with reasonable accuracy. The 1964 CIE standard colorimetric observer has indeed served us well in all industrial color imaging applications, until recently. With the proliferation of modern wide-gamut displays with narrow-band primaries, color scientists and engineers face a new challenge. Various recent studies, including those by the current authors, have shown that the color perception on such displays varies significantly among color normal observers. Conventional colorimetry has no means to predict this variation. In this paper, we explore this problem by summarizing the results from an ongoing study, and explain the practical significance of this issue in the context of display applications.
Index Terms— Color Vision, Cone Fundamentals,
Color Matching, Observer Variability, Displays
1. INTRODUCTION
The perception of color arises due to the response of the human visual system to light, and the interaction of light with objects. Thus, the perception of color requires three components, a light source, an object and an observer. Contributions of relative spectral power of each component, integrated over a range of wavelengths, constitute a mathematical representation of the visual response. This representation, referred to as tristimulus values, forms the basis of all colorimetric computations in basic and applied colorimetry. As shown in Eq. (1), these values are obtained by the integration of the spectral power distribution of a standard light source (Sλ), the reflectance factor of the object
(Rλ), and the color matching functions of an average,
standard observer (xλ,yλand zλ) [1]. Here, k is a
normalization factor that assigns the luminance of white an arbitrary value of 100. λ λ λ λ λ λ λ λ λ λ λ λ λ λ λ λ λ λ λ ∆ = ∆ = ∆ = ∆ =
∑
∑
∑
∑
y S k z R S k Z y R S k Y x R S k X 100 ; ; (1)When two color stimuli produce the same visual response, i.e. identical tristimulus values, a visual match is obtained. (Note: small differences in tristimulus values cannot be perceived under normal circumstances, so the tristimulus values do not strictly need to be identical for a visual match. However, this perceptibility issue is not relevant for our current discussion.) By virtue of the wavelength-wise integration process, two stimuli with very different spectral power distribution can give rise to identical visual response, leading to a metameric match. However, such a match established by one observer can, and quite often does lead to a mismatch for a different observer, as the second observer has a different set of color matching functions than the former. This phenomenon is commonly termed as observer metamerism.
1.1. CIE standard observers and observer metamerism
Either of the two standard observers, as defined by the CIE (Commission Internationale de l’Eclairage), is currently used in applied colorimetry. The first is the 1931 CIE 2° standard observer, and the second is the 1964 CIE 10° standard observer (hereafter referred to as 10° SO). The latter is more suitable for large-field color stimuli, as encountered in most practical industrial applications.
The use of a standard observer in colorimetric computations is essentially based on the assumption that the whole population of color normal observers can be reasonably represented by a single observer model. In 1989, CIE recognized the variability among individual observers by introducing the concept of standard deviate observer [2], but the model significantly under-predicted inter-observer variability [3], and was never adopted by the industry.
Thus, applied colorimetry in its current form does not have any provision of incorporating observer variability into the computations.
1.2. CIE 2006 Physiologically-Based Observer
In 2006, CIE’s technical committee TC 1-36 published a report [4] (described hereafter as CIE06) on the choice of a set of Color Matching Functions (CMFs) and estimates of cone fundamentals for the color-normal observers. The cone fundamentals represent cone spectral sensitivities at the corneal plane, while color matching functions represent spectral tristimulus values of monochromatic stimuli of unit radiant power that embodies the color matching properties of the observer eye in a given system of primary stimuli R, G and B [5] (pp. 124). CMFs can be obtained through a linear transformation of the cone fundamentals. The CIE06 model is largely based on the work of Stockman and Sharpe [6]. Starting from 1959 Stiles-Burch (described hereafter as S&B) 10° CMFs [7], it defines 2° and 10° reference observers and provides a convenient framework for calculating average cone fundamentals for any field size between 1° and 10° and for an age between 20 and 80.
The introduction of CIE06 model is perhaps one of the most fundamental contributions in the field of color science since the establishment of 10° SO in 1964. This model was introduced to address the need of modeling the variability in observer color vision. Recent studies by current authors, as will be reviewed shortly, show that an age-dependent observer model may not be very effective for practical color imaging applications. However, this model provides an opportunity to further refine the 10° SO functions.
2. OBSERVER VARIABILITY IN THE CONTEXT OF DISPLAY COLORIMETRY
The relevance of the observer metamerism issue is quite dependent on the application context. In cross-media color reproduction, i.e. when a display color is compared with its printed version on paper, the significance of observer variability has not been found to be significant [8]. This is presumably true for most of the industrial applications of the past several decades, be it printing, photography, painting or textile. Thus, taking into account individual observer variability in applied colorimetry did not warrant a serious consideration in the past.
However, this limitation has become non-trivial with the advent and wide-spread adoption of modern wide-gamut consumer displays. Colors on two displays with very different spectral characteristics are highly metameric in nature, often resulting in colors that are a satisfactory match for one observer, and an unacceptable match for another. The observer metamerism is particularly significant when colors are compared on a display with broadband primaries (e.g. a CRT), and on another display with narrow-band primaries. Many modern Liquid Crystal Displays (LCDs) are fitted with Light Emitting Diode (LED) backlight (or sometimes, laser primaries) in order to achieve more vivid, more saturated and brighter colors. These displays are particularly susceptible to observer variability [9][10], since
their peaky primaries can cause noticeable shift in the chromaticities of perceived colors with relatively minor change in the visual characteristics of the observer. Not surprisingly, similar observer metamerism issue has been observed when narrow band RGB-LEDs were matched with broadband lights [11]. Note that none of the traditional industrial color applications mentioned before involved a color system with spectral characteristics similar to modern displays or the LEDs.
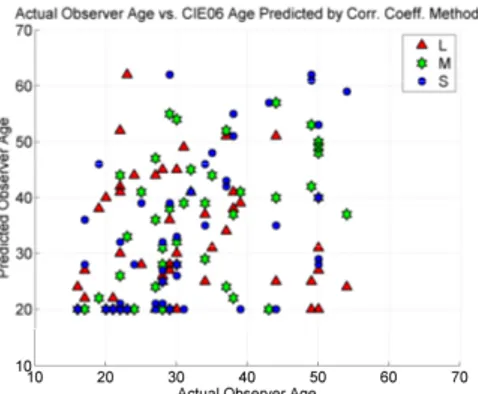
Fig. 1. Age correspondence between CIE06 model’s best prediction and 47 Stiles-Burch observers’ visual data, actual observer age vs. CIE06 predicted age
3. LIMITATIONS OF AN AGE-DEPENDENT OBSERVER IN AN APPLIED CONTEXT
CIE06 age parameter does not necessarily correspond to real observer ages. In other words, predicted model functions that best match the real observer data may not always be obtained using real observer ages. This may happen because of random observer variability, and/or because of the exclusion of one or more age-independent physiological factors from the CIE06 model [12][13]. CIE committee TC 1-36 also recognized this restriction by pointing out that CIE06 fundamental observer was a theoretical construct [4].
The CIE06 age parameters that resulted in the best predictions of individual S&B observer cone fundamental data were determined. This was done by computing the correlation coefficients between the normalized cone fundamentals for each S&B observer and those corresponding to all possible CIE06 age parameter values between 20 and 80 (a total of 61). For each S&B observer, the corresponding CIE age was the one yielding the highest correlation coefficient for a given cone fundamental. This process was repeated for all three cone fundamentals and for all 47 S&B observers. In Figure 1, the actual ages of 47 S&B observers have been plotted against the CIE06 predicted ages obtained using the correlation coefficient (CORR) method, applied separately to L, M and S. Evidently, no direct correspondence exists between the real and predicted ages that can be explained through a mathematical function. As will be seen in the next section, using real observer ages in the CIE model can lead to larger
error in average observer prediction than what results from using the 10° SO. For this reason, there is limited usefulness of using an age-dependent observer in practical industrial applications.
Fig. 2. x- CMFs for the average S&B observer, CIE06 model predictions and 10° SO for Group-1 [top] and -3 [bottom]
4. PREDICTING INTRA-GROUP AVERAGE OBSERVERS WITH CIE06 MODEL AND 10° SO
The introduction of the physiologically based fundamental observer model by CIE warrants a comparative evaluation of the model and the 10° SO, to determine which is a better representation of average real observer data: CMFs derived from the CIE06 model, or the 10° SO. This issue was explored through a theoretical analysis performed in the context of display colorimetry. Experimental data from the 1959 S&B 10° CMFs involving 47 observers were used. Out of the 47 S&B observers, three age-groups were identified. Group-1 was formed by six observers with ages between 22 and 23, Group-2 consisted of ten observers with ages between 27 and 29 and another six observers with ages between 49 and 50 were placed in Group-3.
Because of space constraint, only x-CMF plots for Group-1 and -3 are shown (Figure 2), for which variations of model predictions and their potential impact on color perception were found to be significant. Intra-group minimum, maximum and average values are shown along with the 10° SO and CIE06 model predictions, with and without the age correspondence.
Table 1 lists the results of a statistical comparison of the S&B observer CMF data, 10° SO and CIE06 model predictions with and without age correspondence. Values corresponding to x-, y- and z- functions (corresponding to long-, medium- and short- wavelengths) for each group are shown. All values are computed by weighting wavelength-wise values by a scale-factor, followed by averaging over all wavelengths. The scale factor used was the respective intra-group average S&B observer data divided by their sum over all wavelengths, so that more weights were assigned to the values around the peak than those in the lower end of the ordinate. Note that since the x-, y- and z- CMFs do not have the same ordinate scale, the rows should not be compared as such. The 3rd column in this table shows the intra-group standard deviation of the S&B data (note that standard deviation has the same units as the data), signifying intra-group observer variability. Following three columns list absolute difference of various functions from the intra-group mean, averaged over all wavelengths. The three functions considered here are i) 10° SO, ii) CIE06 with real observer ages as input (no age correspondence), and iii) CIE06 with corresponding ages as input (with age correspondence, as described in the previous section).
Table 1. Comparison of CMF data from intra-group average S&B observer, 10° SO and CIE06 model predictions with and without age correspondence
CMF Grp. No. Mean Intra-group S&B Std. Dev.
Mean Abs. Diff. From Mean Intra-group S&B Data 10° Std. Obs. CIE06 No Age Corres. With Age Corres. x 1 10.11 5.68 6.53 2.51 2 11.28 2.54 1.74 1.99 3 9.12 9.93 10.58 6.06 y 1 6.02 2.81 4.73 1.13 2 6.68 2.28 2.42 2.43 3 5.41 2.12 4.21 2.5 z 1 22.7 19.25 8.22 7.55 2 25.54 10.88 6.2 6.17 3 21.43 11.71 5.21 3.99
As shown in Figure 2, in case of x-CMFs for Group-1 and -3, both CIE06 model predictions and 10° SO deviate from the intra-group average. Based on the results shown in Table 1, CIE06 model with real observer ages generally performs similar to or worse than the 10° SO x- and y-CMFs. For Group-1 and -3, the age correspondence method improves CIE06 predictions, and is mostly better than the 10° functions. For Group-2, the prediction error is relatively low even without age correspondence, indicating CIE06 model’s age parameter works well for the age group of
27-29. This is not surprising since the average observer age in the S&B study, on which CIE06 is based, was 32.
Fig. 3. Spectral Power Distribution of the CRT and the LCD used in the experiments
As far as the z-CMF is concerned, the CIE06 model produces better results than the 10° SO, even without age correspondence. On an average, the reduction in mean absolute difference is more than 50%. Within the constraints of current analysis, CIE06 seems to offer an improvement over the 10° SO z-function.
Any statistical method used to compare the model predictions with real observer data is incomplete without an analysis of the perceptual effect of the prediction errors. Thus, an additional analysis was performed to simulate the effect of the deviations of CIE06 and 10° SO from the average intra-group observer data on display color perception. In this analysis, two displays were used. The first was a Sony BVM32 Cathode Ray Tube (CRT) reference studio display (hereafter referred to as Ref-CRT). The second was a Hewlett-Packard DreamColor Wide-Gamut Liquid Crystal Display with LED backlight (hereafter referred to as WG-LCD). The spectral characteristics of the CRT and the LCD are significantly different (see Figure 3).
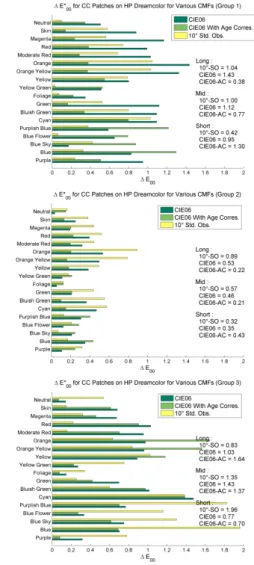
Figure 4 shows the perceptual color difference in terms of CIELAB delta-E 2000 values (an advanced color difference formula denoted as ∆E*00) for 24 Colorchecker
patches (an industry standard color dataset) simulated for WG-LCD, and computed with CIE06 CMFs and 10° SO. The magnitude of the ∆E*00 values are represented along the
abscissa, and the color differences for all 24 colors are plotted as bars along the ordinate. For each group, the colors were divided into three categories, long (magenta through orange yellow – see Figure 4), mid (cyan through yellow) and short (purplish blue through purple), and the 90th percentile values were computed separately for each category (indicated in Figure 4). Neutral and skin colors are shown separately. Note that all these ∆E*00 values are
computational color differences with respect to the intra-group S&B average observer data, and simply help us compare model prediction errors in a perceptual space. These do not represent color differences perceived by a real observer. The reader should be warned that the Euclidean nature of the perceptual color space (and that of the color
difference equation) is potentially distorted when the 10° SO is replaced by a different set of observer CMFs. So, there is a practical limitation in evaluating performances of different observer models in a perceptual color space. Further, because of the nonlinear transformations and interactions of x-, y- and z- CMFs in computing perceptual color difference, it is difficult to directly correlate the prediction errors in individual CMFs (Table 1) with perceptual color differences in Figure 4.
Fig. 4. Simulated ∆E*00 plots (90th percentile) for
ColorChecker patches shown on WG-LCD and computed for various CMFs corresponding to Group-1, -2 and -3 [top to bottom, respectively]
Based on Figure 4, 10° SO generally performs better than the CIE06 model for Group-1 and -3, except in the blue/blue-purple region for Group-3. For Group-2, all predictions errors are relatively low. Age correspondence improves the results for Group-1 and -2, which are often better than those of the 10° SO. However, this is not so
evident in case of Group-3. For Group-3, the prediction error is markedly higher for 10° SO in the blue/blue-purple region.
For Ref CRT, the difference between the CIE06 CMFs and the 10° SO in predicting intra-group average observer data was less apparent.
Overall, this analysis suggests that the CIE06 model, in its original form, does not offer an improvement over the 10° SO in predicting average observer x- and y- functions for various age-groups. However, for the z- function, CIE06 in all cases appears to perform better than the 10° SO in the tristimulus space.
5. A COLOR MATCHING EXPERIMENT USING TWO DISPLAYS
While metameric color matching data are available from several past studies on cross-media color reproduction, no experimental data have so far been available on display color matching, in particular, for displays with vastly different spectral characteristics. To address this need, a preliminary set of color matching experiments [14] were performed on the same two displays used in the theoretical analysis. Because of the significant difference in the spectral characteristics of the CRT and the LCD (Figure 3), color matches were expected to vary significantly from one observer to the other.
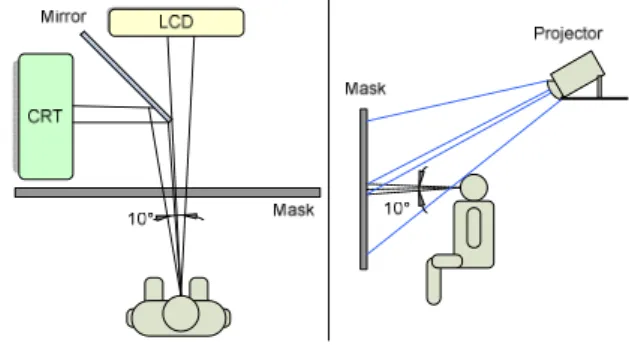
Fig. 5. Experimental setup
The displays were placed perpendicular to each other, as shown in Figure 5. A front-surface reflection mirror was placed in front of the CRT, and a mask was placed between the observer and the displays such that the observer’s visual field consisted simply of a 10° circular area divided vertically in two equal parts (called bipartite field). The right half of the bipartite field was the LCD screen, and the left half was the CRT screen, seen through the mirror. The experiment was conducted both in dark and white surround conditions. For the latter, a white mask uniformly lit by an overhead projector was used. The observers were asked to adjust the color on the left half of the bipartite field (CRT) to match the color on the right half (LCD). After each match, the spectra of the colors on the two displays were measured. Each observer matched nine colors (these were pre-selected along physiologically significant axes in the
Macleod-Boynton chromaticity diagram [14]). A total of ten observers participated in the experiment.
For a more detailed discussion on the experiments, the readers are directed to reference [14].
In order to analyze the experimental data, XYZ values were computed from the spectral data for both the LCD test colors and the CRT matching colors, using CIE 10° SO. For each observer, the XYZ values over all repetitions were averaged, and then were converted to CIELAB values. Finally, ∆E*00 color difference between these two sets of
CIELAB values (corresponding to CRT and LCD) were computed. These ∆E*00 values represent the differences
perceived by an observer identical to the CIE 10° SO between the LCD and CRT colors, while in reality they were satisfactory matches for individual observers. Table 2 lists these ∆E*00 values. Figure 6 plots the ∆E*00 color
difference values corresponding to individual observer matches on LCD and CRT, for both pilot tests (without and with surround). There are nine colors shown along the x-axis. The color differences along the y-axis are represented in the form of bars, grouped by the number of observers.
Fig. 6. ∆E*00 Color difference between CRT and LCD
observer matches as predicted by 10° SO, for dark surround (top) and white surround (bottom)
From the data in Table 2 and the plots in Figure 6, it is apparent that for several stimuli, the colors on the two displays that matched for individual observers were predicted by the CIE 10° SO as having a perceptible color difference. In a similar analysis it was found that when the colors, which were predicted by the standard observer to be a match, were shown on the two displays, they were
significantly different from individual observer matches. The errors are the highest for the test color #4, a saturated blue (Table 2). In case of dark surround test, the mean, maximum and the 75th percentile ∆E*00 values between
individual observer matches on LCD and CRT, across all stimuli and all observers, were 1.39, 3.41 and 1.86 respectively. In case of white surround, the values were 1.4, 3.47 and 1.84 respectively. Overall, no significant effect of surround on color matching is evident from the results.
The significance of the ∆E*00 values depends on the
context, viewing condition and the observer. While the values reported here are possibly low in case of complex images and surrounds, for a carefully controlled experimental setup such as ours, where uniform color stimuli are matched by experienced observers, a ∆E*00 value
much larger than 1.0 is likely to be perceptible. In color critical applications involving expert observers, such a difference will even be unacceptable. This was further confirmed during the course of the study, when color matches made by one observer, and confirmed to be a satisfactory match, was presented to others. In several instances, color match of any one observer was rejected by some others, and vice versa.
Table 2. Color difference (∆E*00) values computed between
the test colors on LCD and observer matches on CRT
Stimulus ID
∆E*00 for Av. Observer Matches (LCD and CRT) Pilot Test 2 Pilot Test 3
1 1.11 1.34 2 1.89 1.91 3 1.45 1.37 4 2.07 2.13 5 1.07 1.26 6 1.58 1.50 7 1.05 0.98 8 0.86 0.70 9 1.40 1.36 6. CONCLUSIONS
In the context of modern display colorimetry, when colors are compared on two displays with very different spectral power distributions, color perception can vary significantly among color normal observers. Thus, using the CIE 10° standard observer in colorimetric computation in such applied context can lead to an unacceptable color match for many color normal observers. In this paper, we explored this problem by summarizing the results from our ongoing study on observer variability, involving both theoretical analysis and visual experiments. Following are the two key inferences that emerge: 1) an age-dependent observer model such as CIE 2006 may not be very suitable for practical applications, since variations in color perception within a given age-group is significant, and cannot be predicted by
such models; 2) in the tristimulus space, the short-wave sensitive (z-) average observer CMF is better predicted by the CIE 2006 model than by the CIE 10° standard observer. This needs to be further investigated with a larger set of observers belonging to various age-groups.
In the concluding remark, next generation colorimetry must offer a practical framework to take into account observer variability in highly color-critical professional applications, specifically those involving modern displays with narrow-band primaries. This is the ultimate goal of the present work.
7. REFERENCES
[1] R.S. Berns, Billmeyer and Saltzman’s principles of color technology, Willy, New York, USA, 2000.
[2] CIE, “Special Metamerism index: Change in observer”, CIE Publ. No. 80, Central Bureau of the CIE, Vienna, 1989. [3] R.L. Alfvin and M.D. Fairchild, “Observer Variability in
Metameric Color Matches Using Color Reproduction Media”, Color Res. & Appl., 22(3): pg. 174-188, 1997. [4] CIE. “Fundamental Chromaticity Diagram with
Physiological Axes – Part I”, CIE Technical Report 2006: 170-1.
[5] G Wyszecki and W.S. Stiles, Color Science, Concepts and Methods, Quantitative Data and Formulae, New York: Wiley, 1982.
[6] A. Stockman and L.T. Sharpe, “The spectral sensitivities of the middle- and long- wavelength-sensitive cones derived from measurements in observers of known genotype”, Vision Research, Vol. 40, pp. 1711-1737, 2000.
[7] W.S. Stiles and J.M. Burch, “N.P.L. Colour-matching investigation: final report”, Optica Acta, 6:1-26, 1959 [8] B. Oicherman, M.R. Luo, B. Rigg, and A. R. Robertson,
“Effect of observer metamerism on colour matching of display and surface colours”, Color Res. & Appl., 33 (5), pp. 346-359, 2008.
[9] M.D. Fairchild and D.R. Wyble, “Mean Observer Metamerism and the Selection of Display Primaries”, Final Program and Proceedings-IS&T/SID Color Imaging Conference, pp. 151-156, Albuquerque, NM, USA, 2007. [10] R. Ramanath, “Minimizing Observer Metamerism in Display
System”, Color Res. & Appl., 34(5), pp. 391-398, 2009. [11] P. Csuti, and J. Schanda, “Colour matching experiments with
RGB-LEDs”, Color Res. & Appl., 33(2), pp 108-112, 2008. [12] Sarkar et al, “Study of Observer Variability on Modern
Display Colorimetry: An Analysis of CIE06 Model”, Final Program and Proceedings, the 11th Congress of the International Colour Association (AIC) 2009, Sydney, Australia, 2009.
[13] Sarkar et al, “Study of Observer Variability on Modern Display Colorimetry: Comparison of CIE 2006 Model and 10° Standard Observer”, Final Program and Proceedings, the 11th Congress of the International Colour Association (AIC) 2009, Sydney, Australia, 2009.
[14] Sarkar et al, “A color matching experiment using two displays: design considerations and pilot test results”, Final Program and Proceedings, CGIV 2010 conference, Joensuu, Finland, 2010.
![Fig. 2. x- CMFs for the average S&B observer, CIE06 model predictions and 10° SO for Group-1 [top] and -3 [bottom]](https://thumb-eu.123doks.com/thumbv2/123doknet/8047305.269740/4.892.128.347.238.613/fig-cmfs-average-observer-cie-model-predictions-group.webp)