HAL Id: hal-02141588
https://hal.archives-ouvertes.fr/hal-02141588
Submitted on 20 Jan 2021
HAL is a multi-disciplinary open access
archive for the deposit and dissemination of
sci-entific research documents, whether they are
pub-lished or not. The documents may come from
teaching and research institutions in France or
abroad, or from public or private research centers.
L’archive ouverte pluridisciplinaire HAL, est
destinée au dépôt et à la diffusion de documents
scientifiques de niveau recherche, publiés ou non,
émanant des établissements d’enseignement et de
recherche français ou étrangers, des laboratoires
publics ou privés.
optimized sensitivity for the analysis of mixtures
Laetitia Rouger, Boris Gouilleux, Mariane Pourchet-Gellez, Jean-Nicolas
Dumez, Patrick Giraudeau
To cite this version:
Laetitia Rouger, Boris Gouilleux, Mariane Pourchet-Gellez, Jean-Nicolas Dumez, Patrick Giraudeau.
Ultrafast double-quantum NMR spectroscopy with optimized sensitivity for the analysis of
mix-tures. Analyst, Royal Society of Chemistry, 2016, 141 (5), pp.1686-1692. �10.1039/c6an00089d�.
�hal-02141588�
Journal Name
ARTICLE
a.Université de Nantes, UMR CNRS 6230 CEISAM, Nantes, France. E-mail :
patrick.giraudeau@univ-nantes.fr
b.MFP Michelin, Clermont-Ferrand, France.
c. Institut de Chimie des Substances Naturelles, CNRS UPR2301, Univ. Paris-Sud,
Université Paris-Saclay, Gif-sur-Yvette, France. E-mail : jeannicolas.dumez@cnrs.fr
d.Institut Universitaire de France, Paris, France.
Electronic Supplementary Information (ESI) available: THEORY: Propagation of the density matrix, Figure S1: β-modulation for an AMX spin system, Figure S2: conventional “constant-time” COSY and “constant-time” DQS spectra of a metabolite mixture, Figure S3: conventional CT-DQS pulse sequence (PDF). See DOI: 10.1039/x0xx00000x
Received 00th January 20xx, Accepted 00th January 20xx DOI: 10.1039/x0xx00000x
www.rsc.org/
Ultrafast double-quantum NMR spectroscopy with optimized
sensitivity for the analysis of mixtures
L. Rouger,a,b B. Gouilleux,a M. Pourchet-Gellez,a J.-N. Dumez*c and P. Giraudeau*a,d
Ultrafast (UF) 2D NMR enables the acquisition of 2D spectra within a single-scan. This methodology has become a powerful analytical tool, used in a large array of applications. However, UF NMR spectroscopy still suffers from the need to compromise between sensitivity, spectral width and resolution. With the commonly used UF-COSY pulse sequence, resolution issues are compounded by the presence of strong auto-correlation signals, particularly in the case of samples with high dynamic ranges. The recently proposed concept of UF Double Quantum Spectroscopy (DQS) allows a better peak separation as it provides a lower spectral peak density. This paper presents the detailed investigation of this new NMR tool in an analytical chemistry context. Theoretical calculations and numerical simulations are used to characterize the modulation of peak intensities as a function of pulse-sequence parameters, and thus enable a significant enhancement of the sensitivity. The analytical comparison of UF-COSY and UF-DQS shows similar performances, however the ultrafast implementation of the DQS approach is found to have some sensitivity advantages over its conventional counterpart. The analytical performance of the pulse sequence is illustrated by the quantification of taurine in complex mixtures (homemade and commercial energy drinks). The results demonstrate the high potential of this experiment, which forms a valuable alternative to UF-COSY spectra when the latter are characterized by strong overlaps and high dynamic ranges.
Introduction
NMR spectroscopy is an essential analytical tool in a wide array of applications such as structure elucidation of organic or
biological analytes, quantitative analysis or in vivo
spectroscopy. Two-dimensional experiments1, 2 are particularly
informative, and when associated with analytical procedures such as calibration or standard addition they become an efficient tool for the quantitative analysis of complex mixtures of small molecules.3-7 The classic acquisition strategy of 2D
NMR spectra, however, does suffer from long experiment durations. This is due to the requirement to repeat the same sub-experiment multiple times, with an incremented delay, to sample the indirect time dimension (t1). This long experiment
duration –from ten minutes to several hours– is not compatible with high-throughput analysis, the study of unstable samples or the coupling with on-flow techniques. Moreover, it makes conventional 2D NMR spectroscopy sensitive to hardware instabilities in the course of the
experiment.8 Such instabilities may lead to significant
additional noise-like features, the so-called “t1 noise”, which
affects the precision of quantitative analysis. This is particularly
critical when the samples contain analytes whose
concentrations are spread over a large range of values, as the signals of low-concentrated analytes can be hidden in the noise ridges generated by the high-concentrated ones. Several strategies have been developed to overcome this major time limitation.9 For example, the inter-scan delay can
be optimized together with the radio-frequency (RF) pulse angles.10 Several “non-uniform sampling” (NUS) strategies
have also been proposed, which consists of collecting only a
randomly selected subset of t1 increments and use non-Fourier
signal processing methods.11-13 Other developments are based
on alternatives to time encoding, such as Hadamard spectroscopy.14, 15
A decade ago, a generic multidimensional approach was designed by Frydman and co-workers, which makes it possible to acquire 2D NMR spectra within a single scan.16, 17 In this
so-called “ultrafast” (UF) method, the incremented evolution period (t1) is replaced by a spatial encoding scheme, based on
a combination of bipolar gradients and linearly frequency-swept pulses,18 and the acquisition is carried out with an
MRI-inspired strategy.19, 20 The sensitivity and resolution of UF NMR
have been significantly improved during the last decade thanks to several methodological developments, and UF NMR spectroscopy is nowadays applied in a variety of fields such as real-time monitoring, metabolomics, or coupled techniques like chromatography or dissolution dynamic nuclear
ARTICLE Journal Name
polarization (DNP).21 UF NMR has been applied recently to the
quantitative analysis of complex mixtures, showing a precision and an accuracy of a few percent.22
In spite of its high potential, ultrafast 2D NMR still suffers from the need to compromise between sensitivity, spectral widths and resolution.23, 24 However, when the targeted applications
are compatible with experiment durations of a few seconds to a few minutes, spatial-encoding-based techniques still form a valuable alternative to conventional 2D NMR. Such “hybrid” approaches remain faster than conventional experiments and address the main limitations of the UF approach. For example, the sensitivity limit of UF experiments can be pushed forward by the use of signal averaging. For a similar experiment duration, this approach is more repeatable than conventional
2D NMR.22 In a complementary approach, the spectral widths
–for a given resolution– can be increased by the use of “interleaving”.17, 25
The question of resolution is particularly acute in UF-COSY – one of the most widely used UF experiments. Indeed, the presence of intense auto-correlation (“diagonal”) peaks can impede the analysis of such spectra, particularly when signals of interest are close to the diagonal, or for samples with large dynamic ranges. This limitation affects the trueness and precision of quantitative analysis, as recently highlighted in the case of plant extracts where signals from sugars are heavily
overlapped.26 The recently introduced UF-DISSECT pulse
sequence leads to the acquisition of a homonuclear correlation
2D spectra, with diagonal peak suppression.27
Multiple-quantum spectroscopy28-32 is another valuable method to
circumvent this overlap issue, as the lower density of peaks in multiple-quantum spectra leads to a better peak separation and removes the strong diagonal peaks, thus lowering the dynamic range.33, 34 Double-quantum spectroscopy (DQS) is
particularly interesting for the quantitative analysis of complex mixtures, since it provides the same information as COSY while considerably reducing peak overlap.35 Recently, the possibility
to record double-quantum NMR spectra in an ultrafast fashion has been demonstrated.36 An added benefit of UF
multiple-quantum experiments is that the artifacts arising from the interleaving procedure, which can affect the quantification in cases where they overlap the peaks of interest, are fewer and weaker, with no need for specific post-processing.25 In order to
turn this UF-DQS experiment into an analytical tool, an in-depth understanding of the experiment is essential to maximize the resulting sensitivity.
In this paper, we show how the recent concept of UF-DQS can be turned into an accurate analytical approach for the quantitative analysis of mixtures. First, we exploit a combined experiment, theory and simulation approach37 to provide a full
mechanistic description of the UF-DQS pulse sequence and assess the parameters that govern its sensitivity. We then compare experimentally the sensitivity of UF-DQS to that of conventional and ultrafast methods that are currently used for quantitative 2D NMR. Finally, we assess its quantitative performance, with the quantification of taurine in a homemade and a commercial energy drink. The UF-DQS
experiment emerges as a promising analytical tool for the quantitative analysis of complex mixtures.
Methods
Numerical simulations
In all simulations, a B0 field of 9.40 T∙m-1 was considered and
ideal pulses were assumed. Spatial encoding was performed by using a CT spatial encoding scheme, that is, double spin echo with smoothed chirp encoding pulses. Those pulses were defined with 1000 points, with a WURST envelope, sweeping a bandwidth of 11 kHz in 15 ms. Excitation gradients of 0.013 T∙m-1 and 0.016 T∙m-1 were applied for the alanine sample and
the AMX spin system respectively. The CTP was completed as shown in Figure 1. Acquisition gradients were fixed at 0.654 T∙m-1 for the alanine sample and 0.484 T∙m-1 for the AMX spin
system. 512 points separated by a dwell time of 0.55 µs were used to compute the indirect dimension, whereas the direct one was obtained with 128 loops in the detection block. The sample length was fixed at 1.6 cm and the simulation was performed with 500 grid points in the z direction. The simulated 2D FID was processed in the same way as the experimental data: a sinusoidal apodization was applied in the direct dimension and a spatial Gaussian apodization was applied in the indirect dimension.38 Zero filling was applied in
both dimensions.
Sample preparation
The experimental UF-DQS spectra of alanine (Ala, Figure 3) were recorded on a 100 mmol∙L-1 alanine sample in D2O. The
metabolite mixture related to Figure 1 was prepared with five metabolites: Ala, threonine (Thr), lactate (Lac), histidine (His) and choline (Cho), dissolved in a mixture of phosphate buffer
(pH 7) and D2O (2.4 mL; 37.5/62.5 v/v) leading to a
concentration of 50 mmol∙L-1 for each metabolite. A stock
solution of homemade energy drink (spectra shown in Figure 4) was prepared, consisting of 41.63 mg of taurine (Tau), 434.04 mg of glucose and 644.2 mg of sucrose dissolved in 10 mL of water. Each sample used in the standard addition procedure contains 650 µL of this stock solution, 150 µL of D2O
and graded amounts of Tau (0 mg, 3.03 mg, 6.20 mg, 9.82 mg and 12.15 mg). For the standard addition procedure performed on commercial energy drink, each sample contained 650 µL of this drink, 150 µL of D2O and graded
amounts of Tau (0 mg, 3.31 mg, 6.31 mg, 9.49 mg and 12.05 mg).
NMR spectrometry
Experimental NMR spectra of the alanine sample, of the homemade and of the commercial energy drinks were recorded at 298 K on a Bruker 400 Avance I spectrometer, at a frequency of 400.13 MHz with a 5 mm dual+ 1H/13C probe
equipped with z-axis gradients. NMR spectra recorded on the metabolite mixture were performed at 298 K on a Bruker Avance III spectrometer equipped with a cryogenic probe
UF experiments
For all UF experiments, spatial encoding was performed by using a CT spatial encoding scheme, that is, double spin echo with 15 ms smoothed chirp encoding pulses. The sweep range for the encoding pulses was set to 10 kHz for the Ala sample, 7 kHz for the homemade and commercial energy drinks, and 20 kHz for the metabolic mixture. The amplitude of the encoding gradients was adapted to obtain a frequency dispersion equivalent to the frequency range of the pulses: Ge = 0.012 T∙m-1; 0.009 T∙m-1; 0.022 T∙m-1 respectively.
Coherence-selection gradients were added, flanking the reading pulse (amplitude ratios: -1:2 for UF-DQS and -1:1 for UF-COSY). The acquisition gradient parameters were set as follows: 0.646 T∙m-1 for the sample of Ala, 0.404 T∙m-1 for the
homemade and commercial energy drinks and 0.325 T∙m-1 for
the metabolite mixture. For all the experiments, the detecting block used 128 detection gradient pairs. The duration of acquisition gradients was Ta = 274.4 µs for the Ala sample as
for homemade and commercial energy drinks, and
Ta = 266.6 µs for the metabolite mixture. For UF-DQS
experiments, the double-quantum buildup delay was set to Δ = 1 4⁄ ∙ 𝐽𝐻−𝐻 (34.5 ms for Ala and an average value of
35.7 ms for the metabolite mixture and both homemade and commercial energy drinks). UF-DQS spectra of Ala were recorded in 1 minute with 16 scans. Both UF-COSY and UF-DQS spectra of energy drinks were recorded in 4 minutes with 45 scans. All spectra of the metabolite mixture were recorded in four interleaved scans to increase the observable spectral width, with 28 and 46 scans for UF-COSY and UF-DQS respectively, resulting in acquisition times of 10 and 16 minutes equivalent to those of conventional 2D experiments (see below). The specific processing of the UF spectra was performed with Matlab by using the same method as the one described for the simulated spectra.
Conventional experiments
Conventional experiments performed on the metabolite mixture used a CT scheme, the time spent in the transverse plane being set to 34.8 ms as for UF experiments. In order to reach the desired spectral widths, COSY spectra were acquired
with 93 t1 increments, and DQS spectra with 150 t1
increments. Other experimental parameters (CTP, spectral widths) are similar to those used in ultrafast experiments. A sinusoidal apodization was performed in both dimensions on COSY spectra, whereas a Gaussian apodization was used in both dimensions for DQS spectra.
Results and discussion
The UF-DQS pulse sequenceThe pulse sequence for ultrafast double-quantum NMR is shown in Fig. 1. During the preparation period, multiple
Figure 1. (a) UF-DQS pulse sequence, (Δ = 1 4⁄ ∙ 𝐽𝐻−𝐻). (b) COSY and (c)
UF-DQS spectra of a metabolite mixture recorded on a 700 MHz spectrometer equipped with a cryoprobe. The two spectra were recorded in four interleaved scans to increase the observable spectral width, 28 and 46 scans for UF-COSY and UF-DQS respectively, resulting in acquisition times of 10 min and 16 min, using a double-quantum buildup delay Δ = 35.7 ms.
quantum coherences are generated thanks to a spin-echo block flanked by 90° pulses. The evolution consists of a “constant-time” (CT) phase-modulated spatial encoding, implemented with a pair of 180° chirp pulses applied during alternating gradients. The CT nature of this scheme is due to the identical time spent in the DQ state by all spins regardless of their position along the z-axis. The final “mixing” pulse converts the multiple-quantum coherence back into observable magnetization, prior to acquisition with an Echo Planar Spectroscopic Imaging (EPSI) scheme.
Double-quantum 2D spectra display pairs of correlation peaks for J-coupled spins. Figure 1 (b and c) shows examples of UF-COSY and UF-DQS spectra recorded on a model metabolite mixture. The direct dimension is displayed vertically, and the indirect one is horizontal. In the UF-COSY spectrum, single-quantum frequency offsets are measured in each dimension. In contrast, in the UD-DQS spectrum, single-quantum frequency offsets are measured in the direct dimension only, and in the indirect dimension double-quantum frequency offsets are measured, i.e. the sum of two offsets.
Analysis and optimization
The UF-DQS pulse sequence involves several parameters that have a subtle effect on the resulting spectra and govern in part its analytical potential. In particular, because of the “constant-time” nature of the spatial encoding block, the duration of the evolution period, T has a strong impact on peak amplitudes and in turn sensitivity, as commonly found in UF NMR.37, 39
Here we, extend the framework developed for UF-COSY to assess this influence using theory and simulation.
b c π π Ge Ge ACQ Ga Ga 1H Gz tmix TE T 90° β Gp 90° 180° Δ Δ L3 a his ala lac cho thr his thr lac ala cho
ARTICLE Journal Name
Figure 2. Theoretical (solid line) and simulated (circles) J-modulation for an AMX spin
system where spin M is coupled to spins A and X. J-modulation is studied for the peak located at [Ω𝐴; Ω𝐴+ Ω𝑋]. The curves are normalized to their maximum.
The case of an AMX system (i.e., a system of 3 weakly coupled spins I = ½), where X coupled to spins A and M, is of particular interest, as it is the minimal set of spins that displays a modulation of correlation-peak intensities by the J coupling interaction during the encoding period. Analytical expressions can be obtained, using a product-operator calculation, for the intensity of the correlation peaks in the double-quantum spectrum of such AMX system (details of the calculation are available in Supplementary Information). For the peak located at [Ω𝐴; Ω𝐴+ Ω𝑋], the peak intensity can be written:
𝑆𝐴;𝐴𝑋∝ cos(𝛽 2⁄ )2sin 𝛽 cos(𝜋𝐽𝑀𝑋𝑇) (1)
Where 𝐽𝑀𝑋 is the coupling constant between spins M and X.
The J-dependence of DQS peaks is illustrated in Fig. 2. Using this knowledge, the duration of the evolution period, 𝑇, can be adjusted by the addition of a delay, 𝑡𝑚𝑖𝑥, prior to the spatial
encoding scheme, in order to maximize the intensity of the correlation peaks, as demonstrated in the case of UF-COSY.37
In addition to J-modulation, Eq. 1 shows the usual dependence of DQS peaks with respect to the flip angle of the final mixing pulse, β, resulting in optimal sensitivity with a 60° (resp. 120°) angle for the anti-echo (resp. echo) coherence transfer pathway. This dependence is reproduced in numerical simulations, as shown in Fig. S1.
Analytical product-operator calculations become cumbersome when dealing with larger spin systems, and inadequate in the case of strong coupling. Numerical simulations are then an efficient approach to J-modulation. The Spinach simulation package40 has been adapted to include the simulation of
spatial encoding schemes.37 This framework can first be
assessed by comparing simulated results to analytical calculations for the AMX spin system. Figure 2 shows an example of simulated DQS spectrum; J-modulation can be obtained by integration of the peak volumes in simulated spectra obtained for a series of values of 𝑡𝑚𝑖𝑥. As illustrated in
figure 2, the effect of J-modulation matches very well with the
analytical expressions obtained from theoretical calculations – simulations of beta-modulation are shown in Fig. S1.
The results from simulations can be further validated by comparison to experimental data for a larger spin system. The example of alanine was selected here as it provides an A3X spin
system commonly encountered in small molecules. The J-modulations of the A3X spin system from alanine (Figures 3a
and 3b) show a good match between experimental and simulated curves.
These results demonstrate that the numerical simulations performed with the Spinach package can be used to optimize the sensitivity of UF-DQS spectra of small molecules. As recently shown in the case of UF-COSY, predicting the effects of J-modulation can indeed prevent unnecessary sensitivity
losses.37 Here, from the simulated and experimental
J-modulation curves of the A3X spin system from alanine, an
optimum 𝑡𝑚𝑖𝑥 of 100 ms can be chosen as the best
compromise between the J-modulations of the two peaks, leading to a sensitivity enhancement of about 50 % for the peak located at [Ω𝐴; Ω𝐴+ Ω𝑋] and 20 % for the one at
[Ω𝑋; Ω𝐴+ Ω𝑋] (Figure 3c and 3d). This significant sensitivity
enhancement for both peaks allows a reduction of the limit of
Figure 3. Integrals of the simulated versus experimental signals as a function of
𝑡𝑚𝑖𝑥 for both peaks on the UF-DQS spectrum of alanine (a and b). 2D spectra and
relative projections (c, d) show a significant increase in sensitivity when 𝑡𝑚𝑖𝑥 is
set to the optimal value determined thanks to these J-modulation curves, i.e.100 ms (d), compared to 𝑡𝑚𝑖𝑥= 0 ms (c). All the spectra are recorded on a
400 MHz spectrometer equipped with a 5 mm dual+ 1H/13C probe; within 16
scans, resulting in an acquisition time of 1 min.
[Ω𝐴; Ω𝐴+Ω𝑋] [Ω𝑋; Ω𝐴+Ω𝑋] Ω𝐴 Ω𝑋 a b c d Ω𝐴 Ω𝑋 𝑡𝑚𝑖𝑥= 0 𝑡𝑚𝑖𝑥= 100
detection, non-negligible in the case of UF experiments for which sensitivity remains one of the major limitations.
The optimization of sensitivity for complex samples containing different spin systems will obviously require compromising between different coupling constants. An appropriate approach consists in avoiding situations in which some peaks are missing, whereas others have a maximum intensity under the influence of J-modulation effects. This strategy was recently described for UF-COSY,37 as well as a multi-scan
approach which consists in adding several spectra recorded with different tmix values. These methods should be easily
transposed to the case of UF-DQS.
Sensitivity considerations
The sensitivity of the UF-DQS approach should be compared to the one of related methods for quantitative 2D NMR, i.e. conventional DQS on the one hand, and UF-COSY on the other hand. In order to perform such comparison, COSY and UF-DQS experiments and their conventional counterparts are performed on a metabolite mixture. Both UF and conventional experiments use a CT scheme. The time spent in the transverse plane is the same for all experiments, making the impact of J-modulation comparable in conventional and UF spectra. The spectral widths are identical between conventional and UF-COSY, as between conventional and UF-DQS. As the indirect spectral width is larger for DQS vs COSY experiments, the two conventional approaches are compared with identical numbers of points per Hertz in the indirect dimension. For conventional experiments, it results in a longer experiment time for DQS vs COSY (16 min vs 10 min). UF spectra are recorded with a number of scans yielding the same overall duration as their conventional equivalent. Apodization functions are optimized to yield the best compromise between signal-to-noise ratio (SNR) and resolution, as previously described.41 SNR measurements are performed in both direct
and indirect dimensions and normalized by the root mean square of the experiment duration. The peaks considered for each metabolite in the UF spectra are indicated on figures 1c and 1d. The corresponding peaks are used in the conventional spectra (shown in supplementary figure S1). The DQS/COSY and UF/conventional relative sensitivity is calculated from the ratios of their respective SNR values, i.e. SNRDQS/SNRCOSY and
SNRUF/SNRConv (Tables 1 and 2 respectively).
Considering SNRDQS/SNRCOSY ratios, the nature of the more
sensitive experiment between DQS and COSY appears to be peak dependent, both in conventional and in ultrafast experiments. This is explained in part by the different J-modulation effects in the two experiments, which were not optimized for a specific case. Still, on average no significant losses are observed using DQS, both in the conventional or UF cases. Regarding the SNRUF/SNRConv ratios, the sensitivity
effects are dimension-dependent. In the indirect dimension which is the limiting dimension in terms of sensitivity, SNRUF/SNRConv ratios for COSY experiments show that the
nature of the more sensitive experiment is peak-dependent. This is coherent with previous observations. 42
Table 1. SNRDQS/SNRCOSY along the two dimensions of conventional (Conv.) and
UF experiments, for the different metabolites observed in the spectra shown in Fig. 1
Direct dimension Indirect dimension
Conv. UF Conv. UF Thr 1.25 ± 0.13 1.05 ± 0.26 1.38 ± 0.54 2.58 ± 0.27 Lac 0.38 ± 0.09 1.67 ± 0.25 1.67 ± 0.41 3.28 ± 0.28 Ala 1.88 ± 0.11 1.06 ± 0.34 1.97 ± 0.41 2.36 ± 0.27 His 1.01 ± 0.16 0.79 ± 0.14 0.65 ± 0.22 1.08 ± 0.38 Cho 1.17 ± 0.13 0.53 ± 0.35 0.80 ± 0.22 0.78 ± 0.44
Table 2. SNRUF/SNRconv along the two dimensions of COSY and DQS experiments, for the
different metabolites observed in the spectra shown in Fig. 1
Direct dimension Indirect dimension
COSY DQS COSY DQS Thr 0.18 ± 0.24 0.15 ± 0.16 0,78 ± 0.58 1,45 ± 0.17 Lac 0.15 ± 0.24 0.66 ± 0.13 1,38 ± 0.45 2,71 ± 0.21 Ala 0.27 ± 0.33 0.15 ± 0.13 1,72 ± 0.46 2,07 ± 0.18 His 0.25 ± 0.14 0.19 ± 0.16 0,63 ± 0.35 1,05 ± 0.27 Cho 0.62 ± 0.15 0.28 ± 0.35 5,36 ± 0.39 5,24 ± 0.30 On the contrary, for all metabolites, UF-DQS experiments appear to be more sensitive than their conventional counterparts in the indirect dimension. This feature may be explained by the large t1-noise ridges observed on the
conventional DQS spectra. In the direct dimension, conventional experiments are more sensitive, which is a well-known characteristic of UF 2D NMR. 21 Nevertheless, the
sensitivity issues are mainly governed by the indirect dimension, as described recently. 42
Overall, Tables 1 and 2 show that the sensitivity is similar for UF-COSY and UF-DQS, but that the sensitivity of UF-DQS experiments is noticeably higher than its conventional counterpart in the limiting dimension. UF-DQS appears as a powerful alternative to existing methods for the analysis of complex mixtures, especially when peak overlaps in COSY spectra prevent the accurate quantification of some analytes.
Evaluation of the quantitative performance
In order to assess the quantitative performance of the UF-DQS approach, we consider here the quantification of taurine, a small-molecule analyte, in an energy drink. We consider both a homemade and a commercial sample; the homemade sample of known true concentration (29.56 mM) is needed to evaluate the trueness of the quantitative method. Energy drinks usually contain highly concentrated sugars, which result in strong overlap and a high dynamic range in COSY spectra. This is illustrated in Fig. 4b for the homemade sample. The DQS approach is expected to overcome these two limitations. The UF-DQS spectrum of the homemade sample drink, shown in Fig. 4c, indeed has a lower density of peaks than the COSY
ARTICLE Journal Name spectrum and thus less overlap. In addition, the absence of
auto-correlation peaks leads to a significant reduction of the dynamic range. An additional benefit is the absence, in these interleaved experiments, of artefactual “ghost” peaks.36
Quantification is performed here with a standard addition procedure, an approach commonly used to obtain accurate quantitative results from 2D NMR spectra.22, 35, 43 The standard
addition approach ensures that the trueness of the result does not depend on peak-specific parameters such as J-modulation. Here, to ensure accurate results, all spectra are recorded in 4 minutes using 45 scans. Such signal averaging yields sufficient SNR even for the sample containing the lowest amount of taurine. The resulting standard addition curves are shown in figures 4c and 4d.
The analytical properties –linearity, precision and trueness– of the UF-DQS pulse sequence are compared to those obtained from UF-COSY in table 3.
Even though a good linearity and precision are obtained for both sequences, the trueness of the method is far better using the UF-DQS pulse sequence than UF-COSY. The high error on the determination of concentration in UF-COSY is a clear sign of bias, which is most likely explained by the strong overlap between the signals of interest and the neighbouring peaks from glucose (Fig. 4 b). On the contrary, these peaks do not overlap with the taurine signals on the UF-DQS spectrum (Fig. 4 d) thanks to the spectral simplification obtained through
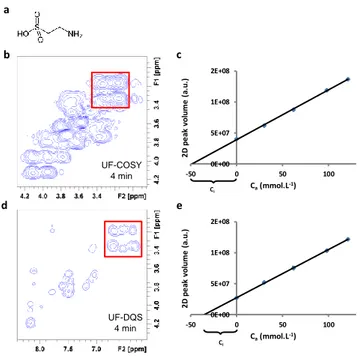
Figure 4. Quantification of taurine (a) in a homemade energy drink by a standard
addition procedure. The latter is performed using both UF-COSY –spectrum shown in (b) and corresponding standard curve in (c) – and UF-DQS experiments –spectrum shown in (d) and corresponding standard curve in (e). The 2D peak volume is plotted as a function of the added concentration Ca. Ci represents the initial taurine concentration. The signals arising from taurine are indicated in both spectra (red square). All the spectra are recorded on a 400 MHz spectrometer equipped with a 5 mm dual+ 1H/13C probe; within 45 scans, resulting in an acquisition time of 4 min, thus allowing a sufficient SNR for quantification even for the sample containing the lowest amount of taurine.
Table 3. Analytical properties of UF-COSY and UF-DQS pulse sequences in the
quantification of taurine in a homemade energy drink by a standard addition procedure. True concentration in taurine: 29.56 mM.
UF-COSY UF-DQS Linearity (R²) 0.9991 0.9998 Precision (RSD) 0.82 % 2.09 % Trueness ([tau]calc)
Error
47.52 mM 60.8 %
29.96 mM 1.4 %
double-quantum spectroscopy, leading to a strong reduction of the error on concentration (1.4 %).
The same procedure is performed on the commercial energy drink RedBull. The indicative value of concentration in taurine given by the supplier is 32.2 mM. By the use of UF-DQS, the calculated concentration (27.88 mM) is close to this indicative value, whereas by the use of UF-COSY the calculated concentration reaches 52.17 mM. These results are in agreement with the discrepancies in terms of trueness between UF-COSY and UF-DQS determined by the study of our homemade energy drink.
These results highlight the usefulness of the UF-DQS pulse sequence for cases where UF-COSY spectra are characterized by high dynamic ranges and strong overlaps.
Conclusions
The detailed characterization of the recently introduced UF-DQS NMR methods provides an in-depth understanding of its properties and a clear illustration of its analytical potential. Theory and simulation studies make it possible to fine-tune experimental parameters: 𝑡𝑚𝑖𝑥, the delay placed prior to the
spatial encoding step, and β, the angle achieved by the mixing pulse. As we demonstrate in the case of an example small-molecule, these optimizations can lead to a significant enhancement of the sensitivity of UF-DQS experiments, thus lowering the limit of detection.
Sensitivity considerations and evaluation of the analytical performance show comparable results between UF-COSY and UF-DQS, however the latter appear to be far more sensitive than its conventional counterpart in the indirect dimension which governs the sensitivity limitations.
As illustrated by the quantification of taurine in energy drinks by a standard addition procedure, the UF-DQS experiment yields more accurate results than UF-COSY (one of the most widely used ultrafast pulse sequences) in cases of high dynamic ranges and overlaps in the UF-COSY spectrum, thanks to the absence of auto-correlation peaks and lower density of peaks in this type of spectra. UF-DQS is thus expected to become a useful component of the NMR toolbox for the analysis of complex mixtures.
UF-COSY 4 min UF-DQS 4 min a b d c e 0E+00 5E+07 1E+08 2E+08 -50 0 50 100 2 D p e ak v o lu me ( a. u .) Ca(mmol.L-1) 0E+00 5E+07 1E+08 2E+08 -50 0 50 100 2 D p e ak v o lu me ( a. u .) Ca(mmol.L-1) Ci Ci
Acknowledgements
We warmly thank Prof. Malcolm H. Levitt and Dr. Ilya Kuprov (University of Southampton) for fruitful discussions. We also acknowledge Michel Giraudeau for linguistic assistance.
Notes and references
1. J. Jeener, Lecture presented at Ampere International Summer School II, Basko Polje, Yugoslavia, 1971.
2. W. P. Aue, E. Bartholdi and R. R. Ernst, J. Chem. Phys., 1976,
64, 2229-2246.
3. I. A. Lewis, S. C. Schommer, B. Hodis, K. A. Robb, M. Tonelli, W. Westler, M. Sussman and J. L. Markley, Anal. Chem., 2007, 79, 9385-9390.
4. K. Hu, T. P. Wyche, T. S. Bugni and J. L. Markley, J. Nat. Prod., 2011, 74, 2295-2298.
5. P. Giraudeau, Magn. Reson. Chem., 2014, 52, 259-272. 6. P. Giraudeau and S. Akoka, Adv. Bot. Res., 2013, 67, 99-158. 7. K. Bingol and R. Brüschweiler, Anal. Chem., 2014, 86, 47-57. 8. G. A. Morris, J. Magn. Reson., 1992, 100, 316-328.
9. L. Rouger, B. Gouilleux and P. Giraudeau, in Encyclopedia of Spectroscopy and Spectrometry, eds. J. C. Lindon, G. E. Tranter and D. Koppenaal, Elsevier, 3rd edn., 2016, p. in press.
10. P. Schanda and B. Brutscher, J. Am. Chem. Soc., 2005, 127, 8014-8015.
11. A. S. Stern, K.-B. Li and J. C. Hoch, J. Am. Chem. Soc., 2002,
124, 1982-1993.
12. H. Barkhuijsen, R. De Beer, W. M. M. J. Bovée and D. Van Ormondt, J. Magn. Reson, 1985, 61, 465-481.
13. J. C. Hoch, J. Magn. Reson, 1985, 64, 436-440.
14. E. Kupce and R. Freeman, J. Magn. Reson, 2003, 162, 158-165.
15. E. Kupce and R. Freeman, J. Magn. Reson, 2003, 162, 300-310.
16. L. Frydman, T. Scherf and A. Lupulescu, Prod. Natl. Acad. Sci. USA, 2002, 99, 15858-15862.
17. L. Frydman, A. Lupulescu and T. Scherf, J. Am. Chem. Soc., 2003, 125, 9204-9217.
18. Y. Shrot and L. Frydman, J. Chem. Phys., 2008, 128, 052209. 19. P. Mansfield, J. Phys. C: Solid State Phys., 1977, 10, 55-58. 20. A. Tal and L. Frydman, Prog. Nucl. Magn. Reson. Spectrosc.,
2010, 57, 241-292.
21. P. Giraudeau and L. Frydman, Annu. Rev. Anal. Chem., 2014,
7, 129-161.
22. A. Le Guennec, I. Tea, I. Antheaume, E. Martineau, B. Charrier, M. Pathan, S. Akoka and P. Giraudeau, Anal. Chem., 2012, 84, 10831-10837.
23. Y. Shrot and L. Frydman, J. Chem. Phys., 2009, 131, 224516. 24. P. Pelupessy, L. Duma and G. Bodenhausen, J. Magn. Reson.,
2008, 194, 169-174.
25. L. Rouger, B. Charrier, M. Pathan, S. Akoka and P. Giraudeau, J. Magn. Reson., 2014, 238, 87-93.
26. T. Jézéquel, C. Deborde, M. Maucourt, V. Zhendre, A. Moing and P. Giraudeau, Metabolomics, 2015, 11, 1231-1242.
27. A. Banerjee and N. Chandrakumar, J. Chem. Phys., 2014, 140, 231103.
28. A. Wokaun and R. R. Ernst, Mol. Phys., 1979, 38, 1579-1601. 29. A. Wokaun and R. R. Ernst, Chem. Phys. Lett., 1977, 52,
407-412.
30. G. Bodenhausen, Prog. Nucl. Magn. Reson. Spectrosc., 1980,
14, 137-173.
31. T. J. Norwood, Prog. Nucl. Magn. Reson. Spectrosc., 1992, 24, 295-375.
32. L. Braunschweiler, G. Bodenhausen and R. R. Ernst, Mol. Phys., 1983, 48, 535-560.
33. G. N. Manjunatha Reddy and S. Caldarelli, Anal.Chem., 2010,
82, 3266-3269.
34. Bikash and N. Suryaprakash, J. Phys. Chem. A, 2007, 111, 5211-5217.
35. E. Martineau, I. Tea, S. Akoka and P. Giraudeau, NMR Biomed., 2012, 25, 985-992.
36. A. Le Guennec, P. Giraudeau, S. Caldarelli and J.-N. Dumez, Chem. Commun., 2015, 51, 354-357.
37. B. Gouilleux, L. Rouger, B. Charrier, I. Kuprov, S. Akoka, J.-N. Dumez and P. Giraudeau, ChemPhysChem, 2015, 16, 3093-3100.
38. P. Giraudeau and S. Akoka, Magn. Reson. Chem., 2011, 49, 307-313.
39. C. Wu, M. Zhao, S. Cai, Y. Lin and Z. Chen, J. Magn. Reson., 2010, 204, 82-90.
40. H. J. Hogben, M. Krzystyniak, G. T. P. Charnock, P. J. Hore and I. Kuprov, J. Magn. Reson., 2011, 208, 179-194.
41. E. Martineau, P. Giraudeau, I. Tea and S. Akoka, J. Pharm. Biomed. Anal., 2011, 54, 252-257.
42. M. Pathan, S. Akoka, I. Tea, B. Charrier and P. Giraudeau, Analyst, 2011, 136, 3157-3163.