HAL Id: hal-01266007
https://hal.archives-ouvertes.fr/hal-01266007
Submitted on 1 Feb 2016
HAL is a multi-disciplinary open access archive for the deposit and dissemination of sci-entific research documents, whether they are pub-lished or not. The documents may come from teaching and research institutions in France or abroad, or from public or private research centers.
L’archive ouverte pluridisciplinaire HAL, est destinée au dépôt et à la diffusion de documents scientifiques de niveau recherche, publiés ou non, émanant des établissements d’enseignement et de recherche français ou étrangers, des laboratoires publics ou privés.
A novel method for estimating the flicker level generated
by a wave energy farm composed of devices operated in
variable speed mode
Anne Blavette, Dara O ’Sullivan, Ray Alcorn, Mohamed Machmoum, Michael
Egan, Tony Lewis
To cite this version:
Anne Blavette, Dara O ’Sullivan, Ray Alcorn, Mohamed Machmoum, Michael Egan, et al.. A novel method for estimating the flicker level generated by a wave energy farm composed of devices operated in variable speed mode. EVER’14, Mar 2014, Monaco, Monaco. �10.1109/EVER.2014.6844041�. �hal-01266007�
2014 Ninth International Conference on Ecological Vehicles and Renewable Energies (EVER)
A novel method for estimating the flicker level
generated by a wave energy farm composed of
devices operated in variable speed mode
Anne Blavette
IREENA
Universit´e de Nantes, France Email: anne.blavette@gmail.com
Ray Alcorn
Beaufort Research-HMRC University College Cork, Ireland
Email: r.alcorn@ucc.ie
Michael Egan
Department of Electrical Engineering University College Cork, Ireland
Email: m.egan@ucc.ie Dara O’Sullivan Analog Devices Cork, Ireland Email: dara.osullivan@analog.com Mohamed Machmoum IREENA
Universit´e de Nantes, France
Email: mohamed.machmoum@univ-nantes.fr
Tony Lewis
Beaufort Research-HMRC University College Cork, Ireland
Email: t.lewis@ucc.ie
Abstract—The output power of wave energy farms may be very fluctuating, which may give rise to power quality issues such as flicker. However, although there existed a method for estimating the flicker level generated by a wave energy farm in relation to its short-circuit ratio (as described in IEC standard 61400-21), until recently, no method had been defined yet regarding the two other major parameters on which flicker level is highly de-pendent: the impedance angle at the point of connection and the rated power of the farm. In a previous work, the authors had presented a method for estimating the level of wave farm-induced flicker as a function of these latter parameters. They had identified two relationships regarding the impedance angle and the rated power in the case where the wave energy devices composing the farm are operated in fixed speed mode. This article presents the results of a follow-on work regarding the generalization of this method in the case of wave energy devices operated in variable speed mode.
Index Terms—flicker, wave energy, impedance angle, rated power, variable speed
I. INTRODUCTION
The inherently fluctuating nature of wave power may be reflected to a significant extent in the profile output of wave energy farms. These power fluctuations may in turn give rise to power quality issues such as flicker. However, although there exists a method for estimating the flicker level generated by a wave energy farm in relation to its short-circuit ratio, as described in IEC standard 61400-21 [1], no method had been defined regarding the two other major parameters on which flicker level is highly dependent: the impedance angle at the farm’s point of connection (Ψk = arctan(Xk/Rk)) and the number of
devices it is composed of (proportional to its rated power Pr).
This absence of method prevented the objective comparison between different wave device technologies in terms of impact on power quality. In addition, flicker analyses were particularly time-consuming as they required performing individual dynamic power system simulations corresponding to each impedance angle and rated power, as well as processing each voltage profile obtained by means of a flickermeter. Furthermore, performing these simulations required using the output power profile of a wave energy farm which is considered as very commercially-sensitive by wave device developers and is thus usually unavailable to third parties.
It is in this context that a method which does not require wave device developers to reveal such commercially-sensitive data has been developed in order to facilitate the estimation of the flicker level in relation to the impedance angle of the farm’s point of connection and in relation to the farm rated power. It has proved to be very accurate in the case of a wave energy farm composed of devices operated in fixed speed mode [2]. However, most devices are expected to be operated in variable speed mode due to constraints in terms of power quality, in similar fashion to wind turbines [3]. In this mode, unlike in fixed speed mode, a significant quantity of inertial storage is available to smooth the devices’ output power, thus reducing the level of flicker they induce. Hence, it was necessary to develop a method for estimating the flicker level which a wave energy farm
TABLE I: Sea-state and speed control mode character-istics of production periods A, B, C and D
Production period Hs (m) Te (s) Speed control mode
A 5.0 10.9 fixed
B 2.1 7.3 fixed
C 4.5 8.8 variable
D 4.5 10.1 variable
would generate in this specific case. This article presents a follow-on work on this topic.
II. EXPERIMENTALDATA ANDMODELLING A. Power system simulations
Power system simulations were performed using DIgSILENT numerical tool “PowerFactory”. The numer-ical model of the wave energy farm is based on the Irish test site called AMETS. An in-house flickermeter compliant with IEC standard 61000-4-5 [4] was then used to obtain the flicker level corresponding to each voltage profile.
B. Experimental data
Experimental data in the form of electrical output power profiles were provided as an outcome of the Eu-ropean FP7 project CORES, standing for “Components for Ocean Renewable Energy Systems” [5]. The project itself was based on a quarter-scale floating oscillating water column (OWC) which was deployed at sea dur-ing three months between March and May 2011. The device was connected to a small on-board island grid independent of the national electrical network. It was equipped with a very comprehensive on-board mon-itoring system (including approximately 200 sensors). The on-board grid was maintained by fully-rated power electronic converters and the generated power was used to charge an on-board battery system, or dissipated in resistive load banks. A variable-frequency converter and a diesel generator were also included. It is important to note that the project has generated, among others, a considerable number of electrical output power profiles at a high temporal resolution of 0.1 s for a number of sea conditions traditionally characterized in ocean engineering by their significant wave height Hs and
their energy period Te. Contrary to most available data
which is averaged over a sea-state, a season or even a year, the CORES electrical output power profiles can be scaled and used directly for grid impact studies. Four different production periods referred to as A, B, C, and D, whose corresponding sea-state characteristics are shown in Table I, were used for the power system simulations.
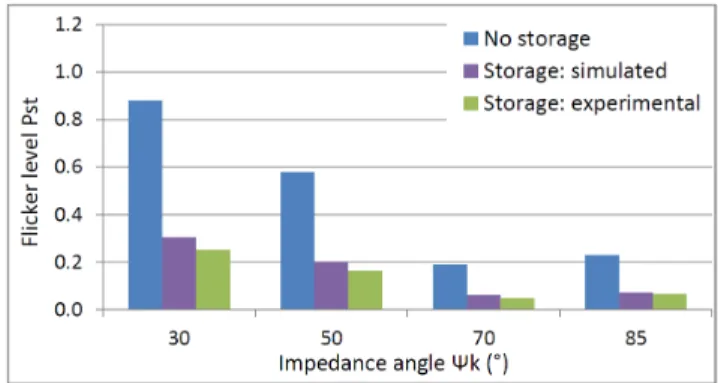
Fig. 1: Flicker level induced by a wave energy farm whose devices are operated in fixed speed mode (“No storage”), and in variable speed mode, as obtained through the simulated approach using a first-order low-pass filter (“Storage: simulated”) and through the exper-imental approach (“Storage: experexper-imental”)
C. Modeling of variable speed mode
As mentioned earlier, in variable speed mode, unlike in fixed speed mode, a significant amount of inertial storage is available to smooth the output power of the wave energy devices, thus reducing the level of flicker induced by the farm. It has been suggested that this influence on the output power can be modeled by means of a first-order low-pass filter, whose time constant τ is approximately equal to the inertia time constant of the system [6]. Simulations were performed as part of the research work presented in this article to verify the validity of this approach. First, two production periods with similar sea-state characteristics were selected: the wave energy devices were operated in fixed speed mode in the former (labeled as “No storage” in Fig. 1), while they were operated in variable speed mode in the latter (labeled as “Storage: experimental”). A fictive produc-tion period (labeled as “Storage: simulated”) was also created by filtering the output power profile obtained in the fixed speed mode case by means of a first-order low-pass filter. Its time constant τ was chosen equal to 1.7 s which corresponds to the inertia time constant of the air turbine (representing most of the system’s inertia). The flicker levels corresponding to each of these three production periods were computed.
Fig. 1 shows the results obtained as a function of the impedance angle Ψk. It appears clearly the flicker levels
obtained through the simulations are very close to the flicker levels obtained based on the experimental data. Hence, the approach consisting in using a first-order low pass-filter for modeling the influence of variable speed on the flicker level induced by a wave energy farm can be considered as valid. This approach was then used to generate additional fictive production periods corresponding to a variable amount of inertial storage,
i.e. to different values of the time constant τ ranging between 0 s (fixed speed mode) and 5 s based on a single production period for which the devices are operated in fixed speed mode. The flicker levels corresponding to these production periods were then used as benchmarks for the results obtained through the method presented in this article.
III. RESULTS
A. Estimation of flicker level in fixed speed mode The objective of this section is to recall briefly the results obtained in a previous study which focussed on the case where the wave energy devices were operated in fixed speed mode [2]. First, it had been shown that the ratio of the flicker level P st(Ψk, Pr) to the maximum
voltage difference ∆V (Ψk, Pr)=Vmax-Vmin of a voltage
profile is equal to a variable which is:
• independent of the impedance angle Ψk and of the
rated power Pr
• dependent only on the wave device technology and
on the characteristics of the sea-state considered, in particular on the energy period Te.
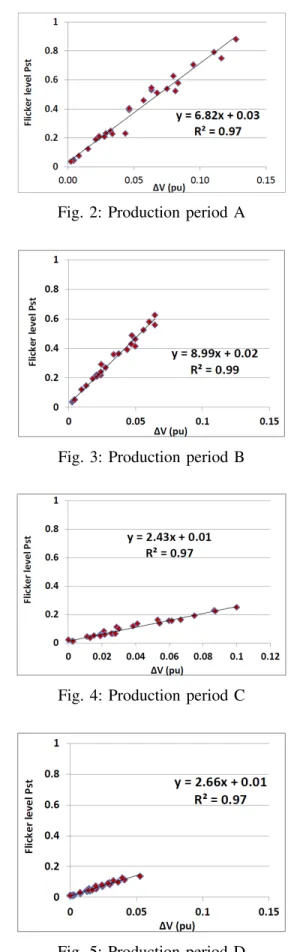
This hypothesis has been validated against 112 flicker levels corresponding to 4 different impedance angles of the point of connection (30◦, 50◦, 70◦ and 85◦), 7 different wave energy farm rated powers (5 MW, 10 MW, 15 MW, 20 MW, 30 MW, 40 MW and 50 MW) and 4 production periods (A, B, C and D) with different sea-state energy levels and speed control mode. Fig. 2 to 5 show the flicker levels as a function of the maximum voltage difference ∆V as well as the linear approximation linking these two variables.
Two relationships linking any flicker level P st(Ψk, Pr) to known flicker levels P st(Ψk0, Pr)
and P st(Ψk, Pr0) have been identified as:
P st(Ψk, Pr) = ∆ V (Ψk, Pr) ∆ V (Ψk0, Pr) P st(Ψk0, Pr) (1) P st(Ψk, Pr) = s ∆ V (Ψk, Pr) ∆ V (Ψk, Pr0) P st(Ψk, Pr0) (2)
In addition, the existence of an ideal, sinusoidal voltage profile which induces the same flicker level as a voltage profile obtained from dynamic power system simulations based on a real wave farm output power was identified. In other words, it was shown that there exists a sinusoidal voltage profile which is equivalent, in terms of induced flicker level, to the voltage profile generated by the output power a wave energy farm. In the case where the devices are operated in fixed
Fig. 2: Production period A
Fig. 3: Production period B
Fig. 4: Production period C
Fig. 5: Production period D
speed mode, it was found that the period T of the sinusoidal voltage profile is approximately equal to the energy period Te of the sea-state corresponding to each
production period, as shown in Table II. The amplitude ∆V of this sinusoidal voltage profile can be determined by means of load flow analyses based on the maximum and minimum active and reactive powers generated by the farm. Hence, in this case, it can be envisaged that tables indicating the flicker level generated as a function of the energy period Te are developed. This is expected
to facilitate dramatically flicker assessment studies by avoiding the need for power system simulations and for developing a flickermeter.
However, it appeared clearly that the relationship between the period T and the energy period Te was
not as trivial in the case where the devices are operated in variable speed mode. This is logical as the level of coupling between the input wave power and the electrical output power is dramatically reduced in this case. Hence, further investigations were necessary to generalize the proposed method to the variable speed case. This paper details the additional research work which has been carried out on this topic.
B. Estimation of flicker level in variable speed mode It was shown earlier that the flicker level correspond-ing to wave energy devices operated in variable speed mode could be obtained by filtering the voltage profile they induce in fixed speed mode by means of a first-order low-pass filter of time constant τ . The ratio of the flicker level P st (corresponding to the variable speed mode) to the flicker level P st0 (corresponding
to the fixed speed mode) follows a decreasing trend as a function of time constant τ , almost independently of the rated power Pr and of the impedance angle Ψk.
This curve shows a high level of correlation with a 4thorder polynomial law (R2=0.99) as shown in Figure 6 as well as with an exponential law (R2=0.93) as shown in Figure 7. These figures show 200 flicker levels simulated for rated powers ranging between 10 MW and 50 MW, for impedance angles equal to 30◦, 50◦, 70◦ and 85◦. Further research will be undertaken to determine the origin of the numerical values of these laws’ coefficients. The existence of a simple relationship between P st and time constant τ implies that the flicker level induced by a wave energy farm composed of devices operated in variable speed mode (P st) can be easily calculated from the flicker level corresponding to the fictive case where the devices are operated in fixed speed mode (P st0). It
must also be emphasized that P st0 can be calculated
from an equivalent sinusoidal voltage whose period T is equal to the sea-state energy period Te. Hence, only the
sea-state energy period Te, the maximum and minimum
active and reactive powers output by the farm and the
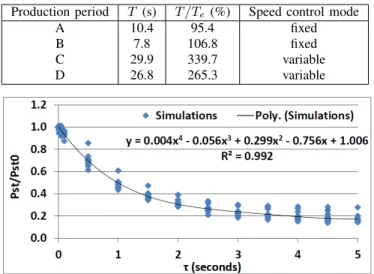
TABLE II: Period T and sea-state energy period Te for
the four production periods considered
Production period T (s) T /Te (%) Speed control mode
A 10.4 95.4 fixed
B 7.8 106.8 fixed
C 29.9 339.7 variable
D 26.8 265.3 variable
Fig. 6: Flicker level as a function of the time constant τ (s) of the storage means employed, and 4th order
polynomial approximation
Fig. 7: Flicker level as a function of the time constant τ (s) of the storage means employed, and exponential approximation
time constant τ are necessary to evaluate the flicker level generated by a wave energy farm composed of devices operated in variable speed mode. As far as flicker analyses are concerned, this method removes the need for sophisticated dynamic models whose development and implementation proved to represent a tremendous task in the case of wind turbines [7].
IV. CONCLUSION
This article has presented a method for evaluating the flicker level induced by a wave energy farm composed of devices operated in variable speed mode, thus benefiting from a substantial amount of inertial storage which smooths its output power. It was shown that the flicker level could be relatively simply calculated based on: 1) a sinusoidal voltage profile whose period T is equal to the energy period Te of the sea-state
through load flow simulations based on the maximum and minimum active and reactive powers output by the farm, 2) the time constant τ equal to the system’s inertia time constant.
This method constitutes a very efficient tool, both in terms of rapidity of execution and of precision. It will facilitate dramatically grid operators’ pre-connection flicker analyses which are rarely performed due to time constraints at the preliminary selection stages of a suitable deployment site. In addition, its simplicity will be a major asset to enable wave device developers, who are generally not sufficiently skilled in power system engineering, to include constraints in terms of flicker generation in their design process without any need for them to reveal commercially sensitive data.
ACKNOWLEDGMENT
The work of Anne Blavette and Dara O’Sullivan, during their time with Beaufort Research-HMRC, was funded by Science Foundation Ireland - Charles Parsons Initiative which is gratefully acknowledged. The authors wish to thank also the members of the FP7 project CORES.
REFERENCES
[1] IEC standard 61400-21, Measurement and assessment of power quality characteristics of grid connected wind turbines, ed. 2.0, 2008.
[2] A. Blavette, Chapter 7 in Grid integration of wave energy & Generic modelling of ocean energy devices for power system studies, PhD thesis, University College Cork, Ireland, 2013. [3] T. Ackermann, Wind power in power systems, John Wiley &
Sons, 2012.
[4] IEC standard 61000-4-15, Flickermeter - Functional and design specifications, ed. 2.0, 2010.
[5] F. Thiebaut et al., Testing of a floating OWC device with movable guide vane impulse turbine power take-off, in Proc. 9th European Wave and Tidal Energy Conference, Southampton, UK, 2011.
[6] D. O’Sullivan, D. Mollaghan, A. Blavette and R. Alcorn (2010). Dynamic characteristics of wave and tidal energy converters & a recommended structure for development of a generic model for grid connection, a report prepared by HMRC-UCC for the OES-IA Annex III. [Online], Available: www.iea-oceans.org. [7] Y. Coughlan, et al., Wind Turbine Modelling for Power System