HAL Id: hal-02888926
https://hal.archives-ouvertes.fr/hal-02888926
Submitted on 3 Jul 2020
HAL is a multi-disciplinary open access
archive for the deposit and dissemination of
sci-entific research documents, whether they are
pub-lished or not. The documents may come from
teaching and research institutions in France or
abroad, or from public or private research centers.
L’archive ouverte pluridisciplinaire HAL, est
destinée au dépôt et à la diffusion de documents
scientifiques de niveau recherche, publiés ou non,
émanant des établissements d’enseignement et de
recherche français ou étrangers, des laboratoires
publics ou privés.
Characterization of 3D Bifurcations in Micro-scan and
MRA-TOF Images of Cerebral Vasculature for
Prediction of Intra-Cranial Aneurysms
Anass Nouri, Florent Autrusseau, Romain Bourcier, Alban Gaignard, Vincent
L'allinec, Céline Menguy, Joëlle Véziers, Hubert Desal, Gervaise
Loirand, Richard Redon
To cite this version:
Anass Nouri, Florent Autrusseau, Romain Bourcier, Alban Gaignard, Vincent L'allinec, et al..
Characterization of 3D Bifurcations in Micro-scan and MRA-TOF Images of Cerebral Vasculature for
Prediction of Intra-Cranial Aneurysms. Computerized Medical Imaging and Graphics, Elsevier, 2020,
84C, �10.1016/j.compmedimag.2020.101751�. �hal-02888926�
Characterization of 3D Bifurcations in Micro-scan and MRA-TOF Images of Cerebral
Vasculature for Prediction of Intra-Cranial Aneurysms
A.Nouria, F. Autrusseaub,∗, R. Bourcierc, A. Gaignardc, V. L’allinecd, C. Menguyc, J. V´ezierse, H. Desalc, G. Loirandc, R. Redonc
aENSC, Ecole Nationale Sup´erieure de Chimie, LASTID laboratory, Department of Physics, Faculty of Science, Ibn Tofail University, BP 133, 14000 K´enitra, Morocco
bInserm, UMR 1229, RMeS, Regenerative Medicine and Skeleton,& Laboratoire de Thermique et Energie de Nantes, LTeN, U6607, University of Nantes, F-44042, France
cDepartment of Diagnostic and Interventional Neuroradiology, Hospital Guillaume et Ren´e Laennec; INSERM, UMR1087, l’institut du thorax, CHU de Nantes, France
dDepartment of Diagnostic and Interventional Neuroradiology, Hospital Guillaume et Ren´e Laennec; INSERM, UMR1087, l’institut du thorax, CHU de Nantes& Angers University Hospital, Radiology Department, Angers, France
eInserm, UMR 1229, RMeS, Regenerative Medicine and Skeleton, University of Nantes, ONIRIS, F-44042, France
Abstract
An aneurysm is a vascular disorder where ballooning may form in a weakened section of the wall in the blood vessel. The swelling of the aneurysm may lead to its rupture. Intra-cranial aneurysms are the ones presenting the higher risks. If ruptured, the aneurysm may induce a subarachnoid haemorrhage which could lead to premature death or permanent disability. In this study, we are interested in locating and characterizing the bifurcations of the cerebral vascular tree. We use a 3D skeletonization combined with a graph-based approach to detect the bifurcations. In this work, we thus propose a full geometric characterisation of the bifurcations and related arteries. Aside from any genetic predisposition and environmental risk factors, the geometry of the brain vasculature may influence the chance of aneurysm formation. Among the main achievements, in this paper, we propose accurate, predictive 3D measurements of the bifurcations and we furthermore estimate the risk of occurrence of an aneurysm on a given bifurcation.
Keywords: 3D Graph, Geometry, 3D skeleton, Aneurysm, Bifurcation characterization, Micro-CT, MRA-TOF
1. Introduction 1.1. Context
The cardiovascular system (also called circulatory system) is composed of all blood vessels that carry the blood through the entire human body. On certain organs, the vascular system becomes denser, the arteries, capillaries or veins split into sev-eral branches, forming a vascular tree. Sevsev-eral environmental factors or a genetic anomaly (Bourcier et al., 2018) can lead to a weakened vascular system. In this work, we particularly focus on the formation of Intra Cranial Aneurysms (ICA). A weakened wall of the blood vessel may lead to the formation of an aneurysm. In the brain, aneurysms may take several forms, but ninety percent of the ICA are saccular aneurysms. Here, we will particularly pay attention to the ones occurring at the bifurcations and more specifically between the two “children” branches forming the bifurcation.
Often an aneurysm may remain benign and never evolve into a dangerous state. The main complication induced by an aneurysm is when it does rupture, and thus provoke a subarach-noid haemorrhage that may lead to the death or a permanent
∗
Corresponding author
Email address: Florent.Autrusseau@univ-nantes.fr (F. Autrusseau)
disability (Ajiboye et al., 2015). ICAs must be closely moni-tored, as the risk of rupture is prevalent: the risk of rupture is higher along a sub set of arteries called the “Circle of Willis” (Bogunovic et al., 2013). Eighty-five percent of the saccular ICAs occur along the Circle of Willis (Keedy, 2006).
This work is part of a wide national research project (Bourcier et al., 2017) (the ICAN project) focusing on the un-derstanding of the multiple factors that may encourage the for-mation of saccular intra-cranial aneurysms along the Circle of Willis. The ICAN project aims at determining the reasons why an aneurysm would appear for a given patient at a particular bifurcation depending of many different factors (such as pa-tient habits, family history, genetic predisposition, bifurcation geometry). The ICAN Project has several active components; a study of the genetics of aneurysm formation, automatic de-tection of aneurysms and here the automated measurement of arterial properties. Medical image processing tools are thus re-quired. During the first part of the project, a study was con-ducted on mice. Micro Computed Tomography scanner (Micro-CT) acquisition of injected mouse brains was then done post-mortem. In the second part of this project, the imaging tools developed for aneurysm detection were applied to existing MRI (TOF) acquisitions from human subjects.
In this study, we make use of classical MRI acquisitions (ac-quired on human patients) and we also test our model on mice
vasculature. We thus test the accuracy of our various mea-surements using two distinct modalities with significantly dif-ferent resolutions. The resolution of the MRI-TOF volumes used in this work were ranging from (290 × 520 × 168) to (696 × 768 × 168) voxels. The resolution of images acquired with the Micro-CT were (1008 × 1141 × 1008). We have at our disposal the Micro-CT acquisition of 22 mice brains. Once the mice were euthanized and injected with contrast media, the Micro-CT renders visible fine details of the vascularization in the brain. We also have collected 39 MRI acquisitions on hu-mans, among which 28 present an unruptured aneurysm (25 saccular aneurysms located onto a bifurcation and 3 fusiform aneurysms). Our main ambition in the framework of this study is to estimate the risk of de novo aneurysm formation on a given bifurcation, given its geometrical configuration.
1.2. State of the art
Although blood vessel detection has been widely studied in the literature, fewer works have focused precisely on the cere-bral bifurcation characterization. As pointed out in (Zhao and Hamarneh, 2014), the detection of bifurcations in a vascular tree is very important. In their work, those authors proposed a parametric geometric deformable model to match the actual 3D medical images of bifurcations. Among the various stud-ies on vascular tree segmentation, some work has focused on specific organs of the human body, for instance, liver vascu-larization was targeted in (Friman et al., 2010), whilst (Orkisz et al., 2014) focused on the pulmonary vascular tree (lungs), and (Calvo et al., 2011) specifically addressed segmentation of the blood vessels in retinal images. Interested readers may re-fer to two interesting reviews (Kirbas and Quek, 2004; Lesage et al., 2009) for details on methods for vessel segmentation.
A common method for detecting blood vessel direction, and hence to possibly detect bifurcations within CT or MRA im-ages, is to use the eigenvalues of the Hessian matrix (Frangi et al., 1998; Krissian et al., 2000). In (Krissian et al., 2000), the authors use multi-scale analysis to extract blood vessels of various diameters. Using the eigenvectors and eigenvalues of the Hessian matrix, the authors then estimate vessel center-lines and were further able to detect the junctions formed by the mod-elled vessels. Some authors opt for the use of variational region growing methods, such as in (Orkisz et al., 2014), where the authors had to confront the delineation of lung tissue within CT images, in order to properly extract the pulmonary vascular tree.
Such methods may suffer from weaker performance for vessels
below a given size.
For cerebral vasculature, (Robben et al., 2016) proposed a machine learning method to automatically segment and label the cerebral vasculature along the Circle of Willis. When cere-bral vasculature is considered, it is actually rather difficult to use learning-based methods, as there is a significant structural variability in the vasculature of individuals (Bogunovic et al., 2013; Robben et al., 2016). In (Bogunovic et al., 2013) a skele-tonization method is used to extract the vessel center-lines, but there the seed points were determined manually.
(Bor et al., 2008) showed that the geometry of the bifurcation correlates quite well with various diseases, as it influences the
fluid mechanics of the blood flow. Multiple factors affect the
fluid dynamics of blood flow. The angles of vessels at bifurca-tions, the distance separating two consecutive bifurcabifurca-tions, the tortuosity of the artery branch and the diameters of the arteries at the bifurcation are all the parameters that have an impact on the blood speed, and thus modulate the risk of formation of an aneurysm.
For most of the previously cited work on blood vessel seg-mentation, the acquisition was performed using either Com-puted Tomography Angiography (CTA) scans (Lidayov´a et al., 2016; Cetin et al., 2013), or Computerized Tomography (CT) Scans (Orkisz et al., 2014; Zhao and Hamarneh, 2014). In a part of our study, we use Micro-CT acquisitions, where we have the added benefit of a reasonably high image definition. This per-mits us to explore the accuracy of our methods at various scales. Unlike the majority of the previously cited studies, where the goal was to study the shape or the position of the aneurysm, in this work, we intend to propose a full characterization of the vascular tree (within the vicinity of the bifurcations), so that we can further predict the chances that a saccular ICA may occur on a specific bifurcation.
We have identified some properties of the vascular tree that can infer a risk of aneurysm formation. We propose methods to automatically collect the following information: 1) bifurcation angles, 2) bifurcation thickness (cross-section area, minimum and maximum diameters), 3) the length of the arteries between two consecutive bifurcations and 4) a measure of the arteries’ tortuosity between two consecutive bifurcations.
This current study intends to tackle the problem of aneurysm prediction from a different perspective than similar works (Bacigaluppi et al., 2014), as here, we compare mirror bifurca-tions within the same patients’ vasculature, i.e. we can control the other factors (genetic predisposition and environmental risk factors), and study only the geometric properties. One can ob-serve an example of mirror bifurcations on an MRA-TOF slice in Figure 2.
This paper is organized as follows: in section 2, we pro-pose a bifurcation detection method based on a skeletonization combined with a graph-based approach. We also present vari-ous methods to fully characterize these detected bifurcations. Section 3 is dedicated to the presentation of our
experimen-tal results. We compare the efficiency of our bifurcation
de-tection with two prior methods in the literature. When possi-ble, we compare our estimations with some ground truth mea-surements. In section 3, the correlations between the risk of aneurysm occurrence and bifurcation geometry are examined through some experimental results. We discuss the main advan-tages, and some limitations of our work in section 4. Finally, section 5 concludes this work.
2. Material and Methods
In this work, we propose a method for bifurcation character-isation and aneurysm occurrence prediction. It follows a two steps process. At first, we need to accurately detect the vascular tree, and reliably locate the bifurcations. Once the bifurcations
can be isolated, each one goes through a full characterisation process. This section will thus be composed of these two steps, we will first present the proposed method for bifurcation detec-tion, and will then present the geometric characterisation step. 2.1. Automatic detection of 3D bifurcations
The first stage of the image-processing pipeline proposed in this paper is the detection of the 3D bifurcations in cerebral vasculatures. We present in this section a new approach to auto-matically localize the bifurcation centers in the 3D image space. Given the 3D cerebral vasculature U of a mouse or a human brain (acquired respectively using a Micro-CT and an MRA-TOF scan), we begin by computing its 3D skeleton S using the
method described in (Lee et al., 1994). To each voxel si of
S are associated its 3D coordinates −→si = (xi, yi, zi).
Exploit-ing the full 3D skeleton instead of 2D image slices reduces the total processing time. More importantly, the better connectiv-ity between 3D voxels simplifies the construction of the corre-sponding graph structure. In order to skeletonize the volume U, an octree structure is used to analyze the 26−connectivity (3 × 3 × 3 neighborhood of each voxel). The algorithm pro-ceeds by iteratively sweeping over the image, and removing voxels at each iteration until the image stops changing. After each iteration, a list of removable candidate voxels is formed. Each voxel of this list is checked sequentially to ensure its re-moval preserves the connectivity of the image. Based on this
3D skeleton, a non-oriented graph G = (V, E) is constructed,
where V represents the set of nodes and E ∈ V × V the set of edges. Each edge e(vi, vj) ∈ E connects the nodes viand vj. As
for S , each node vi ∈ V of the graph is associated its 3D
coor-dinates −→vi = (x, y, z). The significant benefits of using a graph
structure can be summarized in three main points:
• The graph allows scanning of the skeleton (and hence the volume) in 3D thus avoiding the 2D slice-by-slice analy-sis. This preserves the 3D information that may be lost when projecting from 3D to 2D.
• The graph provides an accurate localization of the bifurca-tion center in the 3D space.
• The graph can be restricted to locate bifurcations in any re-gion of interest. Here we restrict our attention to the Circle of Willis, since this is where most intra-cranial aneurysms occur (Robben et al., 2016). For this we use the cross-section area characteristic described in cross-section 2.2.1. Figure 1 presents the 3D skeleton along with its associated graph for a Micro-CT cerebral vasculature of a mouse brain. Unlike Micro-CT acquisitions where the mice required a bar-ium sulfate injection in the vascular tree prior to any cerebral image acquisition, the MRA-TOF images associated to human brains have to be segmented in order to extract the cerebral vasculature from the subcutaneous tissue. For this, we use a “Skull Stripping” method, the Brain Extraction Tool (Smith, 2002) coupled with an entropy-based approach (Kapur et al., 1985) selected for its low complexity and reliability. The pre-processing step needed to segment MRA-TOF images performs
well, it exhibits comparable results to recent state-of-the-art ap-proaches such as (Merveille et al., 2014). After the Skull Strip-ping and segmentation, we obtain a clean volume with its skele-ton as presented in Figure 2. To achieve this, short edges of the graph (and their associated parts of the 3D skeleton) are sup-pressed, as are graph nodes with one unique neighbor. Figure 2 also depicts one 2D slice from an original MRA-TOF volume (prior to the skull stripping).
(a) (b) (c)
Figure 1: Micro-CT cerebral vasculature of a mouse brain. a) Micro-CT vol-ume, b) 3D skeleton of (a) and c) Graph constructed on (b). The red dots represent the graph nodes and the white segments are the graph edges.
(a) (b) (c)
Figure 2: Clean segmentation of MRA-TOF 3D stacks. a) One slice of the MRA-TOF, b) 3D segmented stack and c) 3D skeleton of (b).
A 3D bifurcation has a Y-junction shape (for either two merg-ing or splittmerg-ing arteries) and its graph contains four nodes (see Figure 3), one node at the center of the 3D skeleton bifurcation and the remaining three located at the end points of the three branches. Hence, if any of the graph nodes has three neighbors, this node is considered as the center of the bifurcation.
It sometimes happens that the vasculature splits into more than two “daughters” arteries, we did encounter such scenarii, and our method can reliably detect such configurations. Never-theless, although in our experiments we did find some “trifur-cations” among all the tested TOF stacks, no trifurcations were found to be harbouring an aneurysm on the Circle of Willis. 2.2. Geometric characterization of 3D arterial bifurcations
When blood flow is subjected to a sudden speed decrease at a bifurcation, the impact on the artery inner layer gener-ates repeated mechanical stresses that may weaken the artery 3
(a) (b) (c)
Figure 3: Images (a), (b) and (c) respectively represent a bifurcation from a Micro-CT acquisition, its 3D skeleton and the associated graph with red nodes and white edges.
wall. The more the artery structure deviates from linear, par-allel walls, the greater the stress impact. Decreased tortuosity of the artery reduces the friction of the blood flow on the artery walls, and thus increases the blood speed, which is expected to correlate highly with these larger stress impacts when the blood flow reaches the bifurcation. Wider bifurcation angles and a strong reduction in arterial diameter between the mother and daughter branches would exacerbate this effect. In this section, we propose to measure various geometrical properties of the intracranial arterial tree which may play a role in the develop-ment of saccular aneurysms. The analysis of the intrinsic at-tributes of vasculature geometry as listed above may help iden-tify patients with an increased risk of developing aneurysms (Bor et al., 2008). To develop these concepts toward achieving an eventual Computer Aided Diagnosis, here we model various relevant characteristics such as cross-section area, cross-section diameter, bifurcation angles, branch tortuosity and the geodesic distance between consecutive bifurcation centers. We compute these structural biomarkers in a fully automatic manner. 2.2.1. Measurement of arterial thickness
Arteries are composed of various cellular layers, the inner-most layer, called the tunica intima is in direct contact with the blood flow. Among other anatomical factors, the size of the artery may influence the speed of the blood flow, it is thus crucial to estimate the thickness of the artery. Two ap-proaches were considered, we have computed both the arterial branch cross-sectional area, as well as the diameter of the arte-rial branch.
The area of a branch in a 3D bifurcation represents an im-portant parameter to quantify the thickness of a branch. This thickness value helps to identify the mother branch of a bifur-cation where blood flows before dispersing into the two daugh-ter branches. It is mandatory to correctly identify the mother branch before computing the angle between the down-stream two daughter branches (see section 2.2.2). Neuro-radiologist researchers suspect that an important cross-sectional area of the mother branch may lead to the formation of aneurysms because the high blood pressure from strong flow pushes on the arterial wall that forms the junction of the daughter branches. Given images of a set of 3D cerebral vasculature, we detect all possi-ble bifurcation centers using the graphical approach presented
earlier. Each bifurcation B of a center c is extracted from the
volume within a 60 × 60 × 60 block. Then, the 3D skeleton SB
and its associated graph GB are computed. The bifurcations’
branches are delimited by the graph nodes (b1, b2, b3) ∈ GB.
For a target branch cb1, its cross-sectional area is computed
by considering a voxel n belonging to the branch cb1 located
at a distance of 10 voxels from the bifurcation center c. The vector −→cn is then considered as the directional vector of the
branch cb1. The volume B is subsequently rotated in order to
align −→cn co-linear with the unit vector→−Z. To obtain the area of the perpendicular section of the branch cb1, we extract a 2D
slice of the 3D volume rotated parallel to the (XY) plane that passes through the voxel n which necessarily lies perpendicular
to cb1. Performing a contour detection inside the resulting 2D
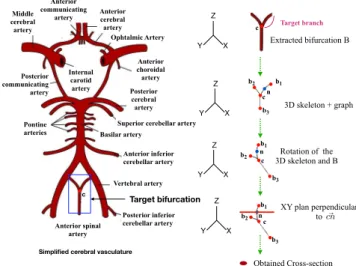
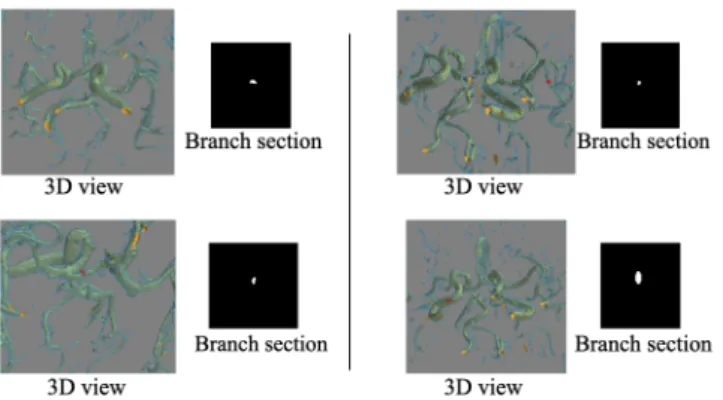
slice eliminates sections to which the voxel n does not belong. Finally, the cross-sectional area is defined as the number of de-tected pixels on the 2D slice. Figure 4 and Figure 5 respectively represent an illustration of the branch cross-section extraction and some results on various 3D MRA bifurcations. We identify high-risk target bifurcations as those where the mother branch cross-sectional area is large compared to that for both of the two daughter branches that constitute a bifurcation (see section 3.2.1). c Y X Z Y X Z Y X Z XY plan perpendicular to Obtained Cross-section Rotation of the 3D skeleton and B Extracted bifurcation B ~ cn
Simplified cerebral vasculature
Target bifurcation n 3D skeleton + graph c b1 b2 b3 c n c n b1 b1 b2 b2 b3 b3 c Y X Z Target branch Anterior cerebral artery Ophtalmic Artery Anterior choroidal artery Posterior cerebral artery Superior cerebellar artery Basilar artery Anterior inferior cerebellar artery Vertebral artery Anterior spinal artery Pontine arteries Internal carotid artery Posterior communicating artery Middle cerebral artery Anterior communicating artery Posterior inferior cerebellar artery
Figure 4: Illustration of the cross-section computation of an arbitrary branch bifurcation.
We have also proposed an approach for the computation of maximal and minimal arterial diameters as recommended in (Bourcier et al., 2017). Once the artery has been aligned along the z-axis, and a 2D slice of the TOF volume has been extracted (the extracted slice is thus perpendicular to the artery orienta-tion), our model next computes a set of oriented projections of this 2D slice image onto 1D projection bins. A discrete Radon transform is applied (Gu´edon, 2013). The projections span a
180◦ range of view angles with a 1◦ step. For each view, the
width of the projected vessel is computed. This permits an angle-sensitive determination of both the minimum and max-imum thickness of the blood vessel. Figure 6 illustrates this
Figure 5: Different branch sections results. Red dots in the 3D views represent the section points.
leads to the measure of the smallest artery diameter (D153 = 9
bins), whereas angle θ = 44◦produces the largest diameter
es-timate (21 projection bins).
Figure 6: Projections at various angles of a 2D image cross-section into 1D bins for the computation of the minimum and maximum diameters. Here, the minimum and maximum diameters of the artery are respectively 9 and 21 bins (at angles θ= 153◦and θ= 44◦).
2.2.2. Computation of arterial branch angles
The angle between the central axes of two daughter branches of a bifurcation and in particular the two angles between each daughter branch and the mother branch are important geometri-cal parameters which may help to predict the risk of aneurysm formation. Indeed, neuro-radiologist researchers have noticed that saccular aneurysms often arise at bifurcations where sig-nificant angles occur between daughter branches (Bor et al., 2008). Accurate automatic computation of these angles then becomes relevant for aneurysm prediction. We aim to automat-ically compute the opposite angles bA1 and bA2as illustrated in
Figure 7(b). Using the 3D skeleton and its associated graph, the angle bA1can be defined as:
b A1= atan2(|| − −−→ CN •CL||−−→ 2, − −−→ CN ·−CL)−→ (1)
where C is a graph node representing the bifurcation cen-ter and L, M, N are the remaining graph nodes delimiting the branches of the bifurcation.CN−−→and−CL−→are defined respectively
asCN−−→=→−N −→−CandCL−−→=→−L −→−C. The function atan2(y, x) com-putes the arc tangent of all four quadrants, providing a result in the interval [−π, π]. The symbols • and · respectively represent the cross and dot products. The notation ||.||2 refers to the
sec-ond norm. The same method is applied for the estimation of both bA1and bA2.
(a) (b)
Figure 7: Target angles to compute: a) 3D bifurcation and b) 3D skeleton with estimated daughter angles.
2.2.3. Geodesic distance between arterial branches
A large geodesic distance between two adjacent bifurcations, coupled with a significant mother branch cross-section area and large daughter angles enhances the risk of saccular aneurysm forming. A large geodesic gap between bifurcations may result in an increased speed of the blood flow into the mother branch of a bifurcation, hence weakening and distorting the junction vessel wall and leading to the formation of a bulge (Figure 8). In our graphical representation of arterial structure as a 3D skele-ton, the centers of bifurcations and their end points are associ-ated with graph nodes. Lists of voxels (each with their corre-sponding 3D coordinates) link each node to its neighbors and are stored within the graph structure. Hence, the geodesic dis-tance between any two detected bifurcation centers is defined as the cardinality of the voxel list between them. This estima-tion of the geodesic distance between two consecutive bifurca-tions is then quite straightforward. There is no need here to validate our model with any ground truth measurements, if the bifurcations centers have been accurately located, the geodesic distance must be correctly estimated.
2.2.4. Arterial tortuosity
The arteries’ tortuosity also influences the fluid mechanics of the blood flow and hence correlates significantly with the for-mation of intracranial aneurysms (Labeyrie et al., 2017). Tor-tuosity can be defined by the degree of curvature of an arterial segment. In this section, we propose a new method to compute the tortuosity of any artery in the cerebral vasculature based on the curvature of its voxels. To the best of our knowledge, there are currently no existing methods to measure the global curva-ture of a cerebral blood vessel. We are thus unable to com-pare our tortuosity measurements with observations in the liter-ature. However, in order to validate our curvature estimations, we have collected ground truth measurements from human ob-5
- Important geodesic distance between two adjacent bifurcations
- Low tortuosity of the mother branch
- Important area section of the mother branch
Large daughter angle
Bifurcation center
Saccular aneurysm
Figure 8: Influence of geometrical characteristics in the occurrence of aneurysms in a cerebral vasculature.
servers. Twenty observers have been asked to rate the degree of tortuosity of 27 3D arterial images1.
Given an artery A and its 3D skeleton SA, 3D normal
vec-tors of the skeleton binary voxels are first calculated. Tangent vectors for each voxel in the artery are computed and used to derive the normal vectors. These are oriented perpendicular to the 3D tangent vectors. Figure 9 illustrates the 3D normal vec-tors obtained for an example artery.
To compute the curvature of a target voxel vi, we assess
vari-ations between its normal vector −→nvi and the normal vectors of
its neighbors. For this, we consider four voxels at each side (left and right) of the target voxel. Both the mean of these normal vectors and their vector positions on each side are computed to derive two normal vectors and two vector positions at the left and right of the target voxel. Figure 10 illustrates this process. The curvature C(vi) of a target voxel viis defined as:
C(vi)= Cle f t+ Cright 2 (2) where Ck le f tis given by: Cle f t = (−→nvi− mean(− →n vle f t)) · (− →v i− mean(−→vle f t) ||−→vi− mean(−→vle f t)||22 (3) where mean(−→nle f t)= P|Nle f t| i=0 →−ni |Nle f t| and mean(− →v le f t)= P|Nle f t| i=0 →−vi |Nle f t| .
|Nle f t| refers to the cardinality of the neighborhood. Ckright is
defined similarly.
Once the curvature of each voxel artery has been computed, the aim now is to compute a scalar value representing the global tortuosity (T ) over the full extent of the artery. To do this, we average the resulting voxel curvatures using a weighted Minkowski sum: T = P|v| i=0C(vi)p |v| 1/r (4) 1http://websubjexp.polytech.univ- nantes.fr/Tortuosity/index_IsolatedArteries.php
Figure 9: Illustration of normal vectors of a 3D artery.
Figure 10: Curvature computation of a target voxel vi.
where the weight factors p and r have been empirically set to 49.9 and 23.6 respectively, as these values provided the most robust estimation of the overall tortuosity.
3. Experimental Results
The previous section gave some details on the two steps pro-cess. We went through the vascular tree detection, and the bi-furcations location. We have seen an in-depth description of the bifurcation characterization. We were thus able to collect the bifurcation geometrical properties. Here, we will present the results in terms of both bifurcation detection, and charac-terization. When possible, we will collect the ground truth data and provide an in-depth comparison with our models.
3.1. 3D bifurcations detection
Intra-cranial aneurysms arise most frequently in the arteries located along the Circle of Willis (Robben et al., 2016). We
have tested our approach on different 3D cerebral vasculatures
to ensure that all 3D bifurcations located on the Circle of
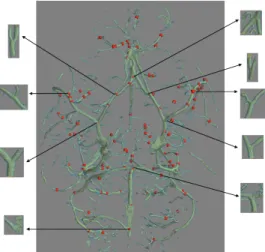
Willis are detected correctly. Figure 11 presents the
bifur-cations centers that have been detected (small red spheres) on a mouse Micro-CT acquisition and shows a closer view of the bifurcation arteries associated to the Circle of Willis. Our proposed approach correctly detected all bifurcations of interest (9 bifurcations located on the Circle of Willis). This method was also able to successfully detect all bifurcations within any different region of the full target volume.
Figure 12 presents the results for our bifurcation detection
method in two different examples of human cerebral
vascula-ture (MRA-TOF images). After the Skull Stripping process (mandatory for separating the cerebral vasculature from the
Figure 11: Centers of 3D bifurcations detected in a Micro-CT volume. 3D bifurcations associated to the Circle of Willis are enlarged.
subcutaneous tissue as explained above), the proposed graph-based approach is applied as for the Micro-CT volumes. Our approach succeeds in detecting all bifurcations (on or beyond the Circle of Willis) for this method of data acquisition. Figure 12, shows that there is significant variability amongst different vasculatures, as explained in (Bogunovic et al., 2013; Robben et al., 2016).
(a) (b)
Figure 12: Images (a) and (b) present the bifurcations detected on two different MRA-TOF human cerebral vasculatures.
Now, let us provide a comparison of the proposed method with two reference approaches of the literature (Macedo et al., 2013; Zhao and Hamarneh, 2014). For this, we consider a ground truth data-set, “Vascusynth” (Hamarneh and Jassi, 2010; Jassi and Hamarneh, 2011), which consists of 10 groups of data. In this database, each group contains 12 randomly gen-erated volumes with the number of bifurcations incrementing from 1 to 56 in steps of 5. 3D coordinates (x, y, z) of the bi-furcation centers are provided. These locations represent the ground truth coordinates for each bifurcation center. We ap-plied our proposed model to this test data with the aim of re-producing these known coordinates with the highest accuracy. To compare the three approaches, we considered a subset of the
Vascusynthdatabase comprised of 10 volumes with 16
bifurca-tions in each volume. Cumulative histograms of the measured distances between the location of the predicted bifurcation cen-ters (DB) and the ground truth cencen-ters (GT) are used. Figure 13
presents the resulting cumulative histograms. We observe that our proposed approach detects all possible bifurcations, with a maximum 19 pixel error from the ground truth centers (Figure 13(a)) whereas the two competing approaches (Macedo et al., 2013; Zhao and Hamarneh, 2014) required more than 50 pixel distance errors to achieve complete bifurcation detection. Fur-thermore, the distribution of distance errors from our approach (Figure 13(a)) diminishes faster than those for the comparison methods (Figure 13(b)). This result confirms the high precision of our approach to detect and localize 3D bifurcations. An ac-curate localization of the bifurcations is important, as any mea-surement inaccuracy might induce erroneous geodesic distance computation during the bifurcation characterisation (described later). 0 50 100 Distance (pixels): DB to GT 0 0.5 1 P roba bi li ty VascuSynth 19 (a) 0 50 100 Distance (pixels) : DB to GT 0 0.5 1 P roba bi li ty Zhao et al. Macedo et al. VascuSynth (b)
Figure 13: Cumulative histograms of distances between the predicted bifurca-tions’ localizations and the ground truth localizations of 10 volumes with 16 bifurcations each belonging to the Vascusynth database (Hamarneh and Jassi, 2010; Jassi and Hamarneh, 2011): (a) The proposed approach and (b) ap-proaches of (Macedo et al., 2013; Zhao and Hamarneh, 2014) (from (Zhao and Hamarneh, 2014)).
3.2. Characterization of the bifurcations and arteries
In this section, we present our experimental results regard-ing the bifurcation characterization. The performances of our method are given with regard to three distinct geometrical pa-rameters: the arterial thickness, the bifurcation angles, and the tortuosity.
3.2.1. Arterial thickness
In order to ensure that our model properly estimates arte-rial diameters, we have collected subjective thickness measure-ments. Ten people were asked to manually measure the smaller and larger diameters of ten cerebral arteries. The measurements were performed using the ImageJ software.
Figure 14 shows both the average user-defined measurements (gray boxes), and the model outputs (black boxes). Solid lines stand for the minimum artery diameters, whereas dotted lines represent their maximum diameters. Our model accurately pre-dicted both diameters (as evident by alignment of the solid,
resp.dotted boxes). The Pearson correlation between the model
prediction and the ground truth (user-defined measurements) was 0.93 for the minimum diameters and 0.92 for the maximum diameters.
Max dia m. Min dia m. Max dia m. Min dia m. Mea sure d Mea sure d Mod el Mod el Pearson Corr. on Max Diameters = 0.92 Pearson Corr. on Min Diameters = 0.93 A rt er ie s' d ia m et er s (i n m m ) 0 1 2 3 4 5 6
Figure 14: Distribution of the min and max diameters according to the model (in black) and measures from humans (in gray).
3.2.2. Bifurcation angles
To attest the relevance of our graphical approach for the au-tomated measurement for pairs of daughter branch angles, we have compared our computed angle values with those obtained with the ImageJ software. Two subjects among the authors (AN and FA) manually measured these angles, we used the average of these two independent observer measures. Figure 15 presents the results for the two angles bA1and bA2. We note that the angle
values estimated by our model are highly correlated with the manual measurements. Moreover, using our model, the angles are automatically computed, without requiring any user inter-vention. The insets below the bar plots (in Figure 15) show the
differences between the model and the human measures. The
differences, being mostly positive, mean that our model slightly overestimates the bifurcation angles. However, the errors are acceptably low over all twenty measurements.
1 2 3 4 5 6 7 8 9 10 Bifurcation ID# 20 30 40 50 60 70 80 L eft A ngl es (i n de gre es ) Model Subjective 2 4 6 8 10 -2 2 4 6 Differences
(a) Left Angle (cA1)
1 2 3 4 5 6 7 8 9 10 Bifurcation ID# 20 30 40 50 60 70 80 Ri ght A ngl es (i n de gre es ) Model Subjective 2 4 6 8 10 -2 2 4 6 Differences (b) Right Angle (cA2) Figure 15: Comparison between the angle values measured using the ImageJ software and those obtained by our approach.
3.2.3. Tortuosity
In this section, we compare the results of the proposed tortu-osity measure against the subjective scores provided by human observers. To verify this, we have constructed a ground truth which consists of 27 human cerebral arteries. The tortuosity in-dexes of these branches were evaluated by 20 human observers. The observers were able to interact with the 3D arteries (3D
ro-tation, zoom in/out) and were asked to assign a representative
tortuosity score between 0 and 100 (where 0 refers to a low tor-tuosity degree and 100 represents extreme tortor-tuosity). Figure 16 presents four example arteries belonging to the constructed
ground truth with their associated Mean Opinion Score (MOS) of tortuosity.
(a) MOS=36.4 (b) MOS=69.9
(c) MOS=11.7 (d) MOS=76.7
Figure 16: Example of 3D arteries belonging to the constructed ground truth with their associated Mean Opinion Score (MOS) of tortuosity.
The objective tortuosity results provided by our measure and the subjective results collected from human observers showed strong agreement, with a Pearson correlation coefficient of 90.03% and a normalized RMSE (Root Mean Square Error) be-tween the objective and subjective results of 0.13. These indi-cators attest the precision of the proposed measure of tortuosity. 3.3. Linking arterial bifurcation geometry and the risk of
aneurysms
The risk of aneurysm formation depends on several factors. A genetic predisposition may account for a significant portion of the probability of aneurysm formation. Environmental in-teractions, such as smoking habits or hypertension may also increase the risk of developing an aneurysm. We wish to avoid the complications and interference from these external factors on our study of the influence of the bifurcation geometry on
aneurysm formation. To do this, we analyzed the effects of
ar-terial geometry when those external factors remain constant by analyzing intra-patient examples. We thus compared the geom-etry of matching bifurcations located on the same arteries on the left and right side of the patient’s brain (mirror bifurcations) to evaluate the risk of aneurysms. We gathered the MRA-TOF volumes from 25 patients. Among the 25 patients, some pre-sented an aneurysm on the left Middle Cerebral Artery (MCA) whereas the others exhibited an aneurysm on the right MCA. The proposed model of bifurcation characterization was tested on this data base of 50 bifurcations (including the 25 aneurysm-free mirror bifurcations).
Figure 17 shows the geometrical parameters derived using our automated graphical method. We compare those bifurca-tions that did exhibit an aneurysm (black boxes), and those without aneurysms (red boxes). As expected, the bifurcations that actually exhibited an aneurysm presented larger angles, lower tortuosity, and longer distance of the mother artery. How-ever, as can be seen on Figure 17(c), it appears that the cross-section of the mother artery may not be a strong feature to help estimate the risk of occurrence of an aneurysm. For each
bi-furcation, we also subsequently computed the difference
Neuro-radiologists have suspected that this may have some impact of the risk of aneurysm formation (Can et al., 2015). Unfortu-nately, our results couldn’t confirm this hypothesis, as can be
observed on Figure 17(d). A significant difference between
daughters’ arterial cross-section did not seem to be related with the occurrence of an aneurysm. Nevertheless, as pointed out in (Can et al., 2015): “In univariate analysis, Basilar Tip Aneurysms were associated with smaller basilar artery diameter (...) and larger difference in the diameters of P1 segments of the PCAs (...), but these relationships were not statistically signifi-cant.”. In that study the authors focused specifically on the
basi-Without ICA With ICA A ng le s (i n de gr ee s) 25 50 75 100 125 150
(a) All angles combined (cA1& cA2) Without ICA With ICA S um m ed a ng le s (d eg re es ) 75 100 125 150 175 200 225 (b) Angles sum (cA1+cA2) Without ICA With ICA C ro ss s ec ti on s (p ix el s) 0 20 40 60 80
(c) Mother artery’s cross-section Without ICA With ICA D au gh te rs d ia m et er s di ff . ( pi xe ls ) 0 2 4 6 8 (d) Difference between daughters’s diameters Without ICA With ICA G eo de si c di st . ( # vo xe ls ) 0 10 20 30 40 50 60 70
(e) Geodesic length of the mother artery Without ICA With ICA To rt uo si ty 0,825 0,85 0,875 0,9 0,925 0,95 0,975 (f) Tortuosity of the mother artery
Figure 17: Distribution of various geometrical properties (angles, cross-sections, geodesic distance, and tortuosity).
lar artery, whereas here our results (Figure 17) pertained to the MCA. Overall, except for the diameter feature which, at best, is weakly linked to the risk of aneurysm formation, a strong rela-tionship was found for all three other features. Importantly, the results from our proposed model closely mimic the chances of occurrence of an aneurysm based on three geometric considera-tions: the angle formed by the daughter branches, the tortuosity and length of the mother branch.
4. Discussion
With regard to the weak link we have found between the risk of aneurysm formation and the diameter of the arteries, we have investigated this issue further. A closer examination was specifically conducted on the diameter feature, as this particu-lar marker appeared to be unrelated to the aneurysm formation. We show in Figure 18 how two bifurcations having unbalanced daughter diameters may either develop or not an aneurysm. We suspect that a weighted combination of both diameters and
an-gles or maybe diameters and tortuosity might more efficiently
predict the risk of aneurysm formation.
(a) Bifurcation with aneurysm (b) Bifurcation without
aneurysm
Figure 18: Two distinct (mirror) bifurcations of the same patient. Despite a sim-ilar configuration (equivalent unbalanced diameters of the daughter arteries), an aneurysm developed only onto one bifurcation.
Overall, our model proved to efficiently characterize the bi-furcations, and we were thus able to link the various geomet-rical properties of the bifurcations to the risk of aneurysm for-mation. We were able to show that three geometric properties of the bifurcations may have an impact on the aneurysm forma-tion. However, the whole process we have presented is strongly dependent on the vascular tree segmentation. A better and more suited segmentation of the vascular tree might ensure a more
generalizable characterisation method. Effectively, our
charac-terization process is dependent on its very first step, the image binarization. Similarly, another limitation of our work is the lack of an explicit link between a detected bifurcation and its anatomical correspondence, i.e. once a bifurcation is detected, we cannot ensure it belongs to the circle of Willis. In our ex-periments, we hypothesized that the larger arteries belong to the circle of Willis, nevertheless, we have no means to ensure from an anatomical point of view that this assumption holds. Combining our bifurcation detection and characterization to a brain vascular atlas might be very useful in clinical application scenarios.
5. Conclusions and perspectives
This research explored the structure of cerebral vasculature (in particular at vessel bifurcations in the Circle of Willis) and its relationship to the onset of saccular aneurysms in the brain. We proposed several methods to fully characterize these bifur-cations by testing novel algorithms that automatically measure the angles formed by the two daughter branches, the normal ar-terial cross-sections and the distance between two consecutive bifurcations. We provided a new estimate for the mother arte-rial tortuosity. We collated subjective manual measurements to confirm the accuracy for some of these proposed methods, us-ing a database of 3D scanner images of both human and mice brains. The measured vessel angles, diameters and tortuosity estimations were well correlated to the measurements made by human observers. Full characterization of these bifurcations enabled us to associate these features with the possible occur-rence of a saccular aneurysm. Our results show, given control of other contributing factors (for genetic differences and envi-ronmental factors), that bifurcation geometry can be stated to 9
play an important role in the risk of developing an aneurysm. Amongst the geometric features we quantified, the bifurcation angles, the tortuosity and the distance to the previous bifurca-tion appeared to be the three most important determinants.
Among the improvements we can bring to the 3D bifurca-tion characterizabifurca-tion, future investigabifurca-tions might be devoted to the improvement of the segmentation and bifurcation detection step. One might also try to combine this characterization pro-cess to an anatomical Atlas, which would allow us to benefit from a precise localization of the aneurysms and ensure that we only process the ones located onto the circle of Willis.
Acknowledgments
The authors wish to thank Pr. Imants Svalbe who assisted in the proof-reading of the manuscript. This work received fund-ing from grant ANR-15-CE17-0008.
References
Ajiboye, N., Chalouhi, N., Starke, R.M., Zanaty, M., Bell, R., 2015. Unruptured Cerebral Aneurysms: Evaluation and Management. The Scientific World Journal 2015, 1–10.
Bacigaluppi, S., Piccinelli, M., Antiga, L., Veneziani, A., Passerini, T., Rampini, P., Zavanone, M., Severi, P., Tredici, G., Zona, G., Krings, T., Boccardi, E., Penco, S., Fontanella, M., 2014. Factors affecting formation and rupture of intracranial saccular aneurysms. Neurosurgery Review 37, 1–14. doi:10.1007/s10143-013-0501-y.
Bogunovic, H., Pozo, J.M., Cardenes, R., Roman, L.S., Frangi, A.F., 2013. Anatomical labeling of the circle of willis using maximum a posteriori prob-ability estimation. IEEE Transactions on Medical Imaging 32, 1587–1599. Bor, A.S.E., Velthuis, B.K., Majoie, C.B., Rinkel, G.J., 2008. Configuration
of intracranial arteries and development of aneurysms. Neurology 70, 700– 705.
Bourcier, R., Chatel, S., Bourcereau, E., Jouan, S., Marec, H., Daumas-Duport, B., Sevin-Allouet, M., Guillon, B., Roualdes, V., Riem, T., Isidor, B., Le-branchu, P., Connault, J., Tourneau, T., Gaignard, A., Loirand, G., Redon, R., Desal, H., 2017. Understanding the Pathophysiology of Intracranial Aneurysm: The ICAN Project. Neurosurgery 80, 621–626.
Bourcier, R., Scouarnec, S.L., Bonnaud, S., et al., 2018. Rare coding vari-ants in angptl6 are associated with familial forms of intracranial aneurysm. American Journal of Human Genetics 102, 133–141.
Calvo, D., Ortega, M., Penedo, M.G., Rouco, J., 2011. Automatic detection and characterisation of retinal vessel tree bifurcations and crossovers in eye fundus images. Computer Methods and Programs in Biomedicine 103, 28– 38.
Can, A., Mouminah, A., Ho, A.L., Du, R., 2015. Effect of Vascular Anatomy on the Formation of Basilar Tip Aneurysms. Neurosurgery 76, 62–66. Cetin, S., Demir, A., Yezzi, A., Degertekin, M., Unal, G., 2013. Vessel
Trac-tography Using an Intensity Based Tensor Model With Branch Detection. IEEE Trans Med Imaging 32, 348–363.
Frangi, A.F., Niessen, W.J., Vincken, K.L., Viergever, M., 1998. Multiscale vessel enhancement filtering. Medial Image Computing and Computer-Assisted Invervention - MICCAI’98. LNCS, vol 1496 1496, 130–137. Friman, O., Hindennach, M., K¨uhnel, C., Peitgen, H.O., 2010. Multiple
hy-pothesis template tracking of small 3D vessel structures. Medical Image Analysis 14, 160–171.
Gu´edon, J., 2013. The Mojette Transform: Theory and Applications. ISTE, Wiley.
Hamarneh, G., Jassi, P., 2010. Vascusynth: Simulating vascular trees for gen-erating volumetric image data with ground truth segmentation and tree anal-ysis. Computerized Medical Imaging and Graphics 34, 605–616.
Jassi, P., Hamarneh, G., 2011. Vascusynth: Vascular tree synthesis software. Insight Journal January-June, 1–12.
Kapur, J., Sahoo, P., Wong, A., 1985. A new method for gray-level picture thresholding using the entropy of the histogram. Computer Vision, Graphics, and Image Processing 29, 273 – 285.
Keedy, A., 2006. An overview of intracranial aneurysms. McGill Journal of Medicine 9, 141–146.
Kirbas, C., Quek, F., 2004. A review of vessel extraction techniques and algo-rithms. Computing Surveys 36, 81–121.
Krissian, K., Malandain, G., Ayache, N., Vaillant, R., Trousset, Y., 2000. Model-Based Detection of Tubular Structures in 3D Images. Computer Vi-sion and Image Understanding 80, 130–171.
Labeyrie, P., Braud, F., Gakuba, C., Gaberel, T., Orset, C., Goulay, R., Emery, E., Courth´eoux, P., Touz´e, E., 2017. Cervical artery tortuosity is associated with intracranial aneurysm. International Journal of Stroke 12, 549–552. Lee, T.C., Kashyap, R., Chu, C.N., 1994. Building Skeleton Models via 3-D
Medial Surface/Axis Thinning Algorithms, in: CVGIP: Graphical Models and Image Processing, pp. 462–478.
Lesage, D., Angelini, E.D., Bloch, I., Funka-Lea, G., 2009. A review of 3D vessel lumen segmentation techniques: Models, features and extraction schemes. Medical Image Analysis 13, 819–845.
Lidayov´a, K., Frimmel, H., Wang, C., Bengtsson, E., Smedby, O., 2016. Fast vascular skeleton extraction algorithm. Pattern Recognit. Lett. 76, 67–75. Macedo, M.M.G., Galarreta-Valverde, M.A., Mekkaoui, C., Jackowski, M.P.,
2013. A centerline-based estimator of vessel bifurcations in angiography images, in: SPIE, Medical Imaging : Computer-Aided Diagnosis, pp. 8670– 8670.
Merveille, O., Talbot, H., Najman, L., Passat, N., 2014. Tubular structure filter-ing by rankfilter-ing orientation responses of path operators, in: Computer Vision – ECCV 2014, Springer International Publishing, Cham. pp. 203–218. Orkisz, M., Hern´andez Hoyos, M., P´erez Romanello, V., P´erez Romanello,
C., Prieto, J.C., Revol-Muller, C., 2014. Segmentation of the pulmonary vascular trees in 3D CT images using variational region-growing. Irbm 35, 11–19.
Robben, D., T¨uretken, E., Sunaert, S., Thijs, V., Wilms, G., Fua, P., Maes, F., Suetens, P., 2016. Simultaneous segmentation and anatomical labeling of the cerebral vasculature. Medical Image Analysis 32, 201–215.
Smith, S.M., 2002. Fast robust automated brain extraction. Human Brain Map-ping 17, 143–155.
Zhao, M., Hamarneh, G., 2014. Bifurcation Detection in 3D Vascular Images Using Novel Features and Random Forest, in: IEEE International Sympo-sium on Biomedical Imaging (IEEE ISBI), pp. 421–424.