HAL Id: hal-01794742
https://hal.archives-ouvertes.fr/hal-01794742
Submitted on 17 May 2018HAL is a multi-disciplinary open access
archive for the deposit and dissemination of sci-entific research documents, whether they are pub-lished or not. The documents may come from teaching and research institutions in France or abroad, or from public or private research centers.
L’archive ouverte pluridisciplinaire HAL, est destinée au dépôt et à la diffusion de documents scientifiques de niveau recherche, publiés ou non, émanant des établissements d’enseignement et de recherche français ou étrangers, des laboratoires publics ou privés.
Krupenia, Marta Perteira Cochron, et al.
To cite this version:
K. Touliou, M. Maglavera, Christophe Ecabert, Annie Pauzie, Tania Willstrand, et al.. SoA and Benchmarking, delivrable 1.1. [Research Report] IFSTTAR - Institut Français des Sciences et Tech-nologies des Transports, de l’Aménagement et des Réseaux. 2017, 187 p. �hal-01794742�
This project has received funding from the European Union’s Horizon 2020 research Adaptive ADAS to support incapacitated drivers Mitigate Effectively risks through tailor made
HMI under automation
D1.1- SoA and
Benchmarking
Version number 0.2
Main author
K.Touliou, M. Maglavera, C. Britsas
(CERTH/HIT), Christophe.Ecabert (EPFL), Anie Pauzie (IFSTTAR), Tania Willstrand, Christer Ahlström (VTI), Luca Zanovello (DUCATI), Michelle Brasca (DAINESE), Stas Krupenia (SCANIA), Marta Perteira Cochron (TUC), George Georgoulas (UoP), Andreas Wendemuth (OVGU), Alex Valejo (IDIADA).
Dissemination level Public
Lead contractor CERTH/HIT
Due date 28/02/2017
Delivery date 28/02/2017
Version history
Version Date Main author(s) Summary of changes
v0.2 28/02/2017 Katerina Touliou
Name Date
Prepared Katerina Touliou, M. Maglavera, C. Britsas (CERTH/HIT) and WP1.1 partners
28.02.2017
Reviewed Name of reviewer DD.MM.YYYY
Approved Name of authorizer DD.MM.YYYY
Circulation
Recipient Date of submission
European Commission DD.MM.YYYY
Consortium DD.MM.YYYY
Authors (full list)
K.Touliou, M. Maglavera, C. Britsas (CERTH/HIT) Christophe.Ecabert (EPFL)
Anie Pauzie (IFSTTAR)
Tania Willstrand, Christer Ahlström (VTI), Luca Zanovello (DUCATI)
Michelle Brasca (DAINESE)
Stas Krupenia, Sonja Troberg (SCANIA) Marta Perteira Cochron (TUC)
George Georgoulas (UoP) Andreas Wendemuth (OVGU) Alex Valejo (IDIADA).
Project Coordinator
Dr. Anna Anund
Research Director / Associate Professor
VTI - Olaus Magnus väg 35 / S-581 95 Linköping / Sweden
Tel: +46-13-20 40 00 / Direct: +46-13-204327 / Mobile: +46-709 218287 E-mail: [email protected]
The information in this document is provided “as is”, and no guarantee or warranty is given that the information is fit for any particular purpose. The above referenced authors shall have no liability for damages of any kind including without limitation direct, special, indirect, or consequential damages that may result from the use of these materials subject to any liability which is mandatory due to applicable law.
The present document is a draft. The sole responsibility for the content of this publication lies with the authors. It does not necessarily reflect the opinion of the European Union. Neither the INEA nor the European Commission is responsible for any use that may be made of the information contained therein.
Table of Contents EXECUTIVE SUMMARY ... 10 1. INTRODUCTION ... 12 1.1 OBJECTIVES ... 13 1.2 METHODOLOGY ... 13 1.3 CONNECTION TO USE CASES ... 14
2 OVERVIEW OF AFFECTIVE STATE RECOGNITION TECHNIQUES ... 16
2.1 AFFECTIVE STATES’ DEFINITIONS ... 16
2.2 DRIVER MONITORING ... 18
3 LITERATURE REVIEW ON DRIVER IMPAIRMENT AND MONITORING ... 19
3.1 DRIVER IMPAIRMENT ... 19
3.1.1 FATIGUE, DROWSINESS AND SLEEPINESS ... 19
3.1.2 STRESS ... 28
3.1.3 EMOTIONS ... 33
3.1.4 INATTENTION/ DISTRACTION/WORKLOAD ... 43
3.1.5 PHYSIOLOGICAL STATES ... 54
4 APPLICATIONS (DRIVER’S/ RIDER’S MONITORING SYSTEMS) ... 58
4.1 PASSENGER CAR & TRUCKS ... 58
4.1.1 FATIGUE/DROWSINESS/SLEEPINESS ... 58
4.1.2 INATTENTION/DISTRACTION/COGNITIVE LOAD ... 73
4.1.3 STRESS/ ANXIETY ... 84
4.1.4 EMOTIONS ... 87
4.2 RIDER MONITORING SYSTEMS ... 98
4.2.1 RIDER MONITORING SYSTEMS AND ACCESSORIES ... 98
4.3 TRANSFER OF KNOWLEDGE FROM AVIATION, RAIL AND MARITIME ... 115
5 ALIGNMENT OF RESULTS ... ERREUR ! SIGNET NON DEFINI. 5.1 ALIGNMENT WITH ACEM PRIORITIES ... ERREUR !SIGNET NON DEFINI. 5.1.1 OBJECTIVE... ERREUR !SIGNET NON DEFINI. 5.1.2 ACEM PRIORITIES... ERREUR !SIGNET NON DEFINI. 5.1.3 ALIGNMENT METHODOLOGY ... ERREUR !SIGNET NON DEFINI. 5.1.4 RESULTS ... ERREUR !SIGNET NON DEFINI. 5.1.5 CONCLUSION ... ERREUR !SIGNET NON DEFINI. 5.2 ALIGNMENT WITH ERTRAC PRORITIES ... ERREUR !SIGNET NON DEFINI. 5.2.1 OBJECTIVE... ERREUR !SIGNET NON DEFINI. 5.2.2 ERTRAC’S PRIORITIES ... ERREUR !SIGNET NON DEFINI. 5.2.3 ALIGNMENT... ERREUR !SIGNET NON DEFINI. 5.2.4 RESULTS ... ERREUR !SIGNET NON DEFINI. 5.2.5 CONCLUSION ... ERREUR !SIGNET NON DEFINI. 5.3 ALIGNMENT WITH TRILATERAL WORKING GROUP ON AUTOMATION (EU-US-JAPAN)– CARTRE PROJECT ... ERREUR !SIGNET NON DEFINI. 5.3.1 CARTRE’S PRIORITIES ... ERREUR !SIGNET NON DEFINI. 5.3.2 METHODOLOGY ... ERREUR !SIGNET NON DEFINI. 5.4 ALIGNMENT WITH EURO NCAP PRIORITIES ... ERREUR !SIGNET NON DEFINI. 6 CONCLUSION ... 127
REFERENCES ... 130
ANNEX. 1 COMPEDIUM OF LITERATURE REVIEW ... 136
ANNEX 2. AUTOMATION STRATEGIES FOR MOTORCYCLES ... 165 ANNEX 3. TRANSFER OF KNOWLEDGE FROM OTHER TRANSPORTATION AREAS 174
Index of Figures
FIGURE 1:SAEINTERNATIONAL’S NEW STANDARD J3016:TAXONOMY AND DEFINITIONS FOR TERMS
RELATED TO ON-ROAD MOTOR VEHICLE AUTOMATED DRIVING SYSTEMS ... 12
FIGURE 2:HISTORY AND STEPS TAKEN TOWARDS AUTOMATED FUNCTIONS AND DRIVER AUTOMATION (ROSS,2014) ... 13
FIGURE 3:ADAS&ME BENCHMARKING GENERIC METHODOLOGY ... 14
FIGURE 4:RGB-D PLACEMENT FOR DRIVER ACTIVITY IDENTIFICATION ... 19
FIGURE 5:EYE BLINK SHAPE ... 21
FIGURE 6:KEY CATEGORISATION FOR LITERATURE REVIEW ... 22
FIGURE 7:GALVANIC SKIN RESPONSE (GSR) NORMALISED RESPONSES AS A FUNCTION OF TIME (SEC) .... 28
FIGURE 8:LIST AND COMPARISON OF PUBLICLY AVAILABLE DATABASES OF FACIAL EXPRESSIONS AND AUS.. ... 38
FIGURE 9:DELPHI’S DRIVER STATE MONITORING SYSTEM ... 59
FIGURE 10:SEEING MACHINES DRIVER SAFETY SYSTEM ON BOARD ... 59
FIGURE 11:DRIVER INFORMATION AND CAMERA DETECTING FATIGUE ... 59
FIGURE 12:THE ANTI SLEEP PILOT DEVICE (RIGHT) LOCKED ON DASHBOARD (LEFT) ... 60
FIGURE 13:AN ANTI-SLEEP DEVICE ... 61
FIGURE 14:THE STOPSLEEP DEVICE (LEFT) AND WORN WHILE DRIVING (RIGHT) ... 62
FIGURE 15:THE VIGO DEVICE ... 63
FIGURE 16:REAL TIME PERFORMANCE MONITORING (FOR FLEETS) ... 63
FIGURE 17:VOLVO’S DRIVER ALERT LINKED SYMBOL (LEFT) AND CAMERA CONTINUOUSLY RECOGNISES LANE MARKINGS (RIGHT) ... 64
FIGURE 18:FORD’S DRIVER ALERT WARNING ... 65
FIGURE 19:FORD DRIVER ALERT TECHNOLOGIES ... 65
FIGURE 20:AUDI’S REST RECOMMENDATION SYSTEM ... 66
FIGURE 21:ACTIVE DRIVING ASSISTANT MENU (BMW) ... 67
FIGURE 22:VISUAL AND ACOUSTIC WARNING WHEN THE SYSTEM FINDS THE DRIVER IS WANING ... 68
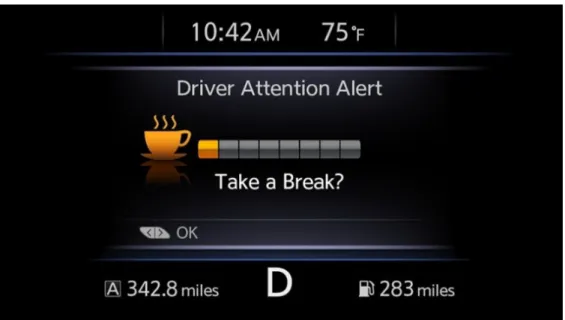
FIGURE 23:NISSAN’S DAA INFORMS THE DRIVER WHEN IT IS TIME TO TAKE A BREAK ... 69
FIGURE 24:THE TI BIOMETRIC STEERING WHEEL ... 70
FIGURE 25:THE BIORICS ALGORITHM USED TO DETECT SLEEPINESS IN TRUCK DRIVERS ... 71
FIGURE 26:HMI FEATURE FOR IN-VEHICLE CENTRAL MIRROR (LEFT) AND HMI SHOWING INCREASE IN COGNITIVE WORKLOAD (RIGHT) ... 73
FIGURE 26:A CLASS:ATTENTION ASSIST ... 74
FIGURE 27:THE I-ACTIVSENSE IN ACTION ... 75
FIGURE 29:EYE SIGHT CAMERA ... 76
FIGURE 30:EYE SIGHT CAMERA DETECTS A PROBABLY CRITICAL FRONTAL EVENT ... 76
FIGURE 31:SUBARU WITH EYESIGHT DASHBOARD: A)PRE-COLLISION BRAKING ALERT, B)ADAPTIVE CRUISE CONTROL, C)LANE DEPARTURE WARNING, D)DRIFTING BACK AND FORTH WARNING ... 77
FIGURE 32:NEONODE ZFORCE STEERING WHEEL SENSOR ... 77
FIGURE 33:IN CAR RANGE CALCULATOR ... 86
FIGURE 34:PHONE ACTIVATION OF SMALL CHARGE ... 84
FIGURE 35:TESLA RANGE ASSISTANCE ... 85
FIGURE 36:RANGE ASSISTANCE (BMW) ... 86
FIGURE 37:DRIVER AUTHENTICATION VIA FACIAL RECOGNITION (PROJECT MOBII) ... 88
FIGURE 38:FACIAL RECOGNITION CAMERA (LEFT) AND MOBII SYSTEM INFORMS OWNER THAT DOES NOT RECOGNISE DRIVER (RIGHT) ... 88
FIGURE 39:THE FY2 WILL CONNECT WITH OTHER VEHICLES AND THE INFRASTRUCTURE (LEFT) AND EMOTIONALLY BOND WITH THE DRIVER (RIGHT) ... 89
FIGURE 40:EMOTION RECOGNITION SYSTEM SPECIFICATION AND PARAMETERS ... 90
FIGURE 41:EQ-RADIO SYSTEM (SOURCE: HTTP://EQRADIO.CSAIL.MIT.EDU/) ... 91
FIGURE 42:EMBRACE FOR USER – SENSORS ... 91
FIGURE 46:NORDIC APIS FOUNDERS TRAVIS SPENCER AND ANDREAS KROHN –99% HAPPY ... 94
FIGURE 47:FACE EXPRESSION SOFTWARE INTERFACE AND EXPRESSION IMAGES PROCESSING ... 95
FIGURE 48:SIGHCORP DEMONSTRATION IF FACE RECOGNITION BASED ON CLOUD ANALYSIS OF FACIAL EXPRESSIONS ... 95
FIGURE 49:SMILE RECOGNITION WITH FACE++ ... 96
FIGURE 50:IMOTIONS DETECTS DIFFERENT TYPES OF BODILY CUES BASED ON LAYERS ... 96
FIGURE 51:ANALYSIS OF FACE POINTS IN REAL-TIME VIDEO (CROWDEMOTION) ... 97
FIGURE 52:FACIOMETRICS EXPRESSION ANALYSIS ... 97
FIGURE 53:RIDER (LEFT) AND BIKE (RIGHT) VARIABLES COLLECTED ... 98
FIGURE 54:WIKO APPLICATION AREAS ... 99
FIGURE 55:WISE PRODUCT ... 99
FIGURE 56:RIDER HEART RATE MEASURES DURING THE RACE ... 100
FIGURE 57:BRAIN TELEMETRY DEVICE FOR MOTORSPORTS ... 101
FIGURE 58:INDICATORS AND SENSORS USED TO COLLECT THESE DATA (BRAIN) ... 101
FIGURE 59:DAIR RACING SUIT ... 102
FIGURE 60:DAINESE D-AIR RACING SUIT PARTS AND SENSORS ... 102
FIGURE 61:LVL WRISTBAND ... 103
FIGURE 62:WRISTBAND FEATURES TO COMMUNICATE MOOD, HYDRATION LEVELS, HEART RATE ... 103
FIGURE 63:LVL MEASURES ... 103
FIGURE 64:HOW THE PERSPIRATION DETECTIVE WILL WORK ... 104
FIGURE 65:THE FROSTBITE DETECTOR AND ALARM PROTOTYPE ... 105
FIGURE 66:HEALTH CHECK UP THROUGH THE STEERING WHEEL (DETECTS FAINTING SPELLS) ... 106
FIGURE 67:BEMBU HYPOTHERMIA ALERT WRISTBAND ... 107
FIGURE 68:SKULLY AR-1 HELMET ... 109
FIGURE 69:FORCITE ALPINE HELMET ... 110
FIGURE 70:LIVEMAP HELMET ... 110
FIGURE 71:NANDLOGIC ENCEPHALON HELMET ... 110
FIGURE 72:THE MOHAWK SYSTEM MOUNTED ON A HELMET ... 111
FIGURE 73:ERTRACSTRATEGIC RESEARCH AGENDA,SYSTEM APPROACH TO ROAD TRANSPORT SOCIETAL CHALLENGES ... ERREUR !SIGNET NON DEFINI. FIGURE 74:MYON 320 SURFACE ELECTROMYOGRAPHY (SEMG) SYSTEM ... 154
Index of Tables
TABLE 1:OVERVIEW OF REVIEWED PUBLICATIONS AND SYSTEMS ... 10
TABLE 2:BENCHMARKING SELECTION INDICATOR – CONNECTION TO UCS ... 15
TABLE 3:AFFECTIVE STATES’ DEFINITIONS ... 16
TABLE 4:LIST OF MOST VALUABLE SLEEPINESS PHYSIOLOGICAL INDICATORS AND TECHNIQUES ... 19
TABLE 5:VEHICLE PARAMETERS TO DETECT SLEEPINESS ... 22
TABLE 6:SUMMARY OF LITERATURE REVIEW-SLEEPINESS AFFECTIVE CLUSTER ... 23
TABLE 7:SUMMARY OF LITERATURE REVIEW-STRESS AFFECTIVE CLUSTER ... 29
TABLE 8:SUMMARY OF LITERATURE REVIEW-EMOTIONS AFFECTIVE CLUSTER ... 41
TABLE 9:SUMMARY OF LITERATURE REVIEW-INATTENTION/ DISTRACTION AFFECTIVE CLUSTER ... 44
TABLE 10:SUMMARY OF LITERATURE REVIEW-PHYSIOLOGICAL STATES’ AFFECTIVE CLUSTER ... 55
TABLE 11:KAROLINSKA SLEEPINESS SCALE (KSS) ... 72
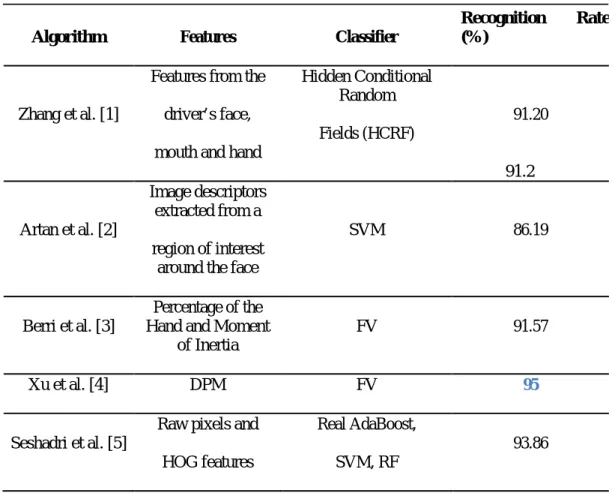
TABLE 12:COMPUTER VISION ALGORITHMS TO DETECT CELL PHONE USAGE.HIGH RECOGNITION RATES ARE USUALLY OBTAINED USING VERY DIFFERENT APPROACHES ... 79
TABLE 13:HANDS RECOGNITION IN DIFFERENT REGIONS INSIDE THE CAR USING CVRR-HANDS3D DATASET [1] ... 80
TABLE 14:SUPERVISED ALGORITHMS FOR COGNITIVE DISTRACTION DETECTION ... 80
TABLE 15: MIXING TYPES OF DISTRACTION DETECTION ALGORITHMS ... 82
TABLE 16:SUMMARY OF LITERATURE REVIEW-AUTOMATION STRATEGIES FOR MOTORCYCLES ... 112
TABLE 17:KNOWLEDGE TRANSFER FROM OTHER TRANSPORT AREAS ... 115
TABLE 18:OVERVIEW OF ALIGNMENT RESULTS TO ACEM PRIORITIES ... ERREUR !SIGNET NON DEFINI. TABLE 19:OVERVIEW OF ALIGNMENT RESULTS TO ERTRAC’S PRIORITIES ... ERREUR !SIGNET NON DEFINI. TABLE 20:OVERVIEW OF ALIGNMENT RESULTS TO ACEM PRIORITIES ... ERREUR !SIGNET NON DEFINI. TABLE 21:BENCHMARKING OVERVIEW ... 127
AAM Active Appearance Model EI Eye Index
ABS Antilock Braking System EIC External/Internal Convertible
ACC Advanced Cruise Control EMG electromyography
ACEM European Association of Motorcycles Manufacturers
EMS Electro Mechanical Systems
AEB Autonomous emergency braking EOG ElectroOculoGram
AFE Analog Front-Ends EOF Eyes-Off-Road
AFEA Automatic Facial Expression Analysis ERP Event-Related Potential
AIDE Adaptive Integrated Driver vehicle Interface
ERTRAC European Road Transport Research Advisory Council
AIC Akaike's Information Criterion ERS Everyday Range Stress
ANFIS Adaptive Neuro-Fuzzy Inference System ES Erector Spinae
ANOVA Analysis of Variance ESS Epsworth Sleepiness Scale
ANS Autonomic Nervous System EV Electric Vehicle
AOI Areas of Interest FACS Facial Action Coding System
API Application Programming Interface FDR Flight Data Recorder
ASM Active Shape Model FER Facial Emotion Recognition
ASP Average Sleep Propensity FERET Facial Recognition Technology
ASM Active Shape Models FFT Fast Fourier Transform
AU Action Unit FLC Fuzzy Logic Controllers
AUC Area Under Curve fMRI functional Magnetic Resonance Imaging
AVI Audio Video Interleave FRM Fatigue Risk Management
AVRB Amplitude-Velocity Ratio of Blinks FPGA Field-Programmable Gate Array
BB Biceps Brachii FOV Field of View
BAL Balance FS Flexor Superficialis
BBS Bulletin Board System GA Genetic Algorithms
BT Bluetooth GPS Global Positioning System
BEV Battery Electric Vehicles GS Gerchberg–Saxton
BF Biceps Formaris GSR Galvanic Skin Response
BLE Bluetooth Low Energy HMI Human Machine Interface
BVP Blood Volume Pressure HR Heart Rate
CLM Constrained Local Model HRV Heart Rate variability
CMG Control Moment Gyroscope HA Highly Automated
CNN Convolutional Neural Network HF High Frequency
CVPR Computer Vision and Pattern Recognition
HDRT Head-mounted Detection Response Task
CR Carpi Radialis IMU Inertial Measurement Unit
CRF Centro Ricerche Fiat ICA Independent Component Analysis
CTREE Classification Trees ICEVS Internal Combustion Engine Vehicles
CV cross-validation IVIS In-vehicle Information System
DAA Driver Attention Alert IAF Individual Alpha Frequency
DAQ Data Acquisition KSS Karolinska Sleepiness Scale
DCT Discrete Cosine Transform kNN K Nearest Neighbour
DIMS Driver Inattention Monitoring System LDF Linear Discriminant Function
DMVD Dead-man’s Vigilance Devices LF Low Frequency
DOA Domain of Attraction LRNN Layer-Recurrent Neural Networks
DRN Dynamic Relational Network LDA Linear Discriminate Analysis
DRT Detection Response Task LBP Local Binary Patterns
DSB Double Strand Break LDW Lane Departure Warning
DSM Driver Status Monitor LD Latissimus Dorsi
DSMS DataBase Management System LCD Liquid Crystal Display
DSP Digital Signal Processing LKS Lane Keeping System
DSSQ Dundee Stress State Questionnaire LED Light Emitting Diode
DVTCS Vigilance Telemetric Control System LDC Linear Discriminant Classifier
ECR Extensor Carpi Radialis LMPC Linear Model Predictive Control
EDA electrodermal activity MRF Markov Random Fields
MAEB Motorcycle Autonomous Emergency Braking
ROI Region of Interest
MPC Model Predictive Control RPM Revolutions per Minute
MPEG Moving Picture Experts Group RSME Rating Scale Mental Effort
MVC Model View Controller RTLX Raw Task Load Index
MySQL Structured Query Language SHRP Strategic Highway Research Program
NCAP New Car Assessment Programme SDK Software Development Kit
NFC Near Field Communication SDLP Standard Deviation of Lateral Position
NMPC Nonlinear Model Predictive Control SDM Supervised Descent Method
NN Normal-to-Normal SDNN Standard Deviation of NN intervals
NIR Near Infrared SIFT Scale-Invariant Feature Transform
PCA Principal Component Analysis SMC Symbolic Model Checking
PERCLOS PERcentage of eyelid CLOSure over time
SMI Senso Motoric Instruments
PD Pupil Diameter SNS Sympathetic Nervous System
PHP Hypertext Pre Processor SPS Samn Perelli Fatigue Scale
PID Proportional–Integral–Derivative ST Skin Temperature
PIS Powered Two wheeler Integrated Safety SVM Support Vector Machine
PPE Personal Protective Equipment SWM Statistical Wave Model
PRC Percentage Road Centre SURT Surrogate Visual Research Task
PSAP Public Safety Answering Points SWAT Subjective Workload Assessment Technique
PVT Psychomotor Vigilance Test TETTC Time Exposed Time to Collision
PTW Powered Two Wheelers TDRT Tactile Detection Response Task
QFT Quantitative Feedback Theory TM Trapezius Medial
QT Quiz Task TB Triceps Brachii
RBF Radial Basis Function TLC Time-to-Line Crossing
RDRT Remote Detection Response Task TTC time to collision
RFID Radio-frequency identification TOR Take-over Request
RGB-D Are a specific type of depth sensing devices that work in association with a RGB camera, that are able to augment the conventional image with depth information
VAS Visual analogue scales
RMSSD Root of the Mean Squared Successive Differences
VLP Variation of Lane Position
RR Respiration Rate VOG VideoOculoGraphy
automated functions in existing vehicles.
Therefore this document reports the results from the benchmarking search carried out within A1.1 for systems that are relevant to the project’s preliminary Use Cases of ADAS&ME project. This report reflects the work carried out in order to reach MS2 (M3) of ADAS&ME and the literature review carried out for each affective state. However, it acted as a living document until the submission of D1.1 (M6) to be incorporated in the main body of D1.1. In general, benchmarking is considered a continuous and systematic approach to measure the processes and outputs against the most relevant (and occasionally) toughest competitors in the business, or at least the most prominent/ profitable ones. This is a so called competitive benchmarking approach. Three different types of results are included in this document: a) benchmarking of driver and rider monitoring systems, b) literature search and reviews of literature on drive/rider affective states as defined within DoA and UCs, and, lastly, c) alignment of the SoA collected, systems benchmarked; with key selected organization’s priorities and roadmaps about automated vehicle systems and functions.
The deliverable opens with the introduction to automation, the objectives of the document, the working group that was involved in A1.1 and worked towards this compilation and the contribution of this document to the selection and refinement of the ADAS&ME Use Case (Chapter 1).
An overview of addressed affective states per Use Cases, as they are currently agreed upon, are presented in Chapter 2, along with their general definitions and driver monitoring techniques and systems.
Chapter 3 presents an introduction to main research findings per affective state, followed by a
literature review overview table, including connection to the project and respective Use Cases. The complete compilation per affective state is included in sub-sections of Annex 1. The table at the end of the Executive Summary includes the number of journals reviewed. In addition, a short literature review was carried out to investigate the automation strategies for stabilisation mechanisms for motorcycles. The work and relevant findings are included in main the document and the rest are also in an Annex.
The literatures review is followed by the benchmarking of existing technologies (SoA) for drivers and riders per addressed affective state (Chapter 4). Similarly, an overview of findings is presented in the table at the end of the summary. In addition, studies from other transport modes were reviewed, for their potential of transferring knowledge, methods and techniques. The results are summarised in a Table in Section 4.3, but the whole compilation of the studies was annexed.
Chapter 5 presents the alignment of A1.1 results with the efforts of several established organizations,
such as ACEM, ERTRAC, NCAP and the international collaborations within CARTRE project. The Deliverable concludes with Chapter 6, where an overview of the results, in terms of numbers and relevance (key categorization) to the project, are presented.
Table 1: Overview of reviewed publications and systems Affective state Literature Review publications (No.) Studies reviewed of high relevance per UC (no.) Systems/ algorithms/ etc. reviewed of high relevance per UC (no.)
Number of systems/algorithms/
etc. reviewed (No.)
Sleepiness 16 3 highly relevant for A, E, F, G 6 systems and 1 subjective (KSS) relevant for A, E, F, G 14 systems, 4 subjective, measures Range anxiety 9 1 highly relevant for A, C, D, E, F & 1 highly relevant for B
2 systems for UC B 3 systems
Inattention 21 7 highly relevant for A, C, D, E, F, G 3 systems, 7 sensors, 4 algorithms, 1 subjective scale for A, C, d, E, F, 6 systems, 7 sensors, 12 algorithms, 5 subjective scales
publications (No.)
per UC (no.) relevance per UC (no.) etc. reviewed (No.)
G Emotions 4 1 highly relevant
for C, D, F,G
2 systems relevant, 6 face and speech apps for UCs A, C, D and one for rider UCs (i.e.
wristband)
5 systems, 15 apps and APIs Physiological states 7 (more in compilation) 1 highly relevant for E 2 systems, 5 wearable and accessories and 1 subjective measure highly related to UC E
and F
4 systems, 9 wearable and accessories, and 1 subjective measures
Sources per column
57 14 40 85
disruptive and with anticipated exponential impacts to other areas of research, like driving style, travelling patterns and even including autonomous mobility be cars of people that could not normally be “behind the wheel”, like very old people, children, people with specific disabilities (i.e. blind), etc. ADAS&ME is an intermediate step towards full automation and addresses certain automated functions with clearly set Use Cases for different types of vehicles (passenger cars, trucks, buses and motorcycles). Vehicles with (varying levels of) automated functions already exist in the market and they include one of more technologies that aim to increase driver’s comfort and safety, and operate by controlling the vehicles applying breaking, steering and throttle control. The driver may (or may not) be actively involved (e.g. switch on/off and take over control). Vehicles that have on-board systems that inform or warn the drivers (e.g. a lane departure warning systems) are not automated because they do not take control or request to take control at any point during driving. Vehicles with automated functions contain similar systems with other cars (e.g. cameras and GPS) but the vehicle takes the control in several or specific occasions. Vehicles can have one or more automated functions (e.g. cruise control is a function found in many vehicles nowadays) or be totally autonomous and self-driving.
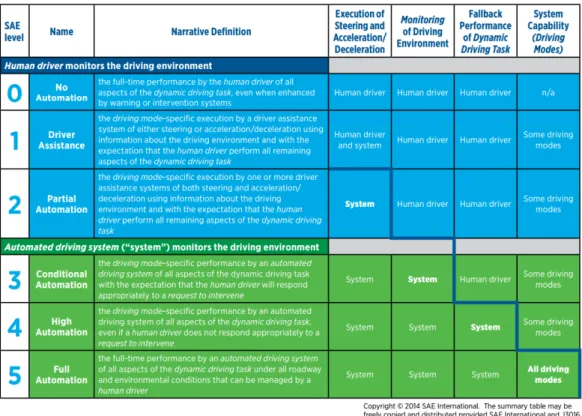
With the goal of providing common terminology for automated driving, SAE International’s new standard J3016: Taxonomy and Definitions for Terms Related to On-Road Motor Vehicle Automated Driving Systems, delivers a harmonized classification system and supporting definitions that is shown in the table below.
Figure 1: SAE International’s new standard J3016: Taxonomy and Definitions for Terms Related to
On-Road Motor Vehicle Automated Driving Systems
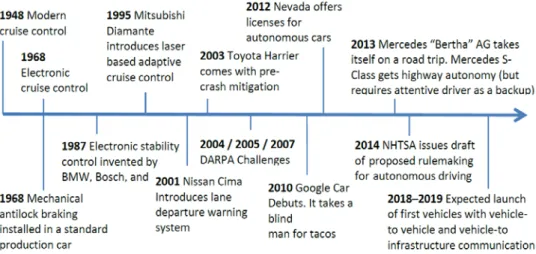
Ross (2014) reported that the efforts to develop autonomous driving functionality started almost thirty years, resulting in many semi-autonomous functions and features with a close look to near future launching of connected vehicles (Figure 1).
Figure 2: History and steps taken towards automated functions and driver automation (Ross, 2014)
This document does not aim to review automated vehicles’ developments and technologies but automated functions in existing vehicles.
This report reflects the work carried out in order to reach MS2 (M3). However, it acted as a living document until the submission of D1.1 (M6) and was incorporated in the main body of this document. In general, benchmarking is considered a continuous and systematic approach to measure the processes and outputs against the most relevant competitors in the business, or at least the most prominent/ profitable ones. This is a so called competitive benchmarking approach. First, it is important to define what benchmarking means for this report. In this report a more generic approach and the method applied are discussed in section 1.2.
Three different types of results will be included in this document: a) benchmarking of driver and rider monitoring systems, b) literature search and reviews of literature on drive/ rider affective states as defined within DoA and UCs, and, lastly, c) alignment of the SoA collected, systems benchmarked, and with key selected organization’s priorities and roadmaps about automated vehicle systems and functions.
1.1 Objectives
1. The SoA aims to identify existing solutions, their performance and the current state of research with regard to sensors, algorithms, driver monitoring, automation, connectivity and HMI strategies, useful for driver state monitoring in automated vehicle scenarios.
2. The SoA utilised a common template, to perform a literature survey of at least 20 driver impairment (of different types) and 10 automation related sources.
3. It also transferred knowledge from the rail, aviation and maritime transport sectors. Results were aligned to relevant priorities, as well to the ERTRAC Automation Roadmaps.
The following steps were taken:
• Identify industrial and/or already in the market systems that have technical characteristics and specifications that could fulfil the requirements for the work carried out in the project. In particular, the following are of interest: Driver/Rider monitoring systems for various affective states ; Fatigue/ sleepiness/ drowsiness ; Stress and other emotional states.
• Consider the context (UC scenarios) and vehicle of use (i.e. passenger car, PTW, truck, bus) • Relevance to project’s systems (i.e. benchmarking makes sense only if systems are relevant;
otherwise no reason to carry out the procedure). 1.2 Methodology
reqirements to meet or surpass the standards set by other products/ systems.
The following diagram (Figure 3) shows the benchmarking process within the project with four main indicator clusters: a) the feedback categories as defined by the columns of the column template (i.e. ‘gathered indicators’ spreadsheet), b) the connection to the UCs (i.e. selection indicator), c) The ‘agreement’ and ‘gap’ indicators (part of the ‘gathered indicators’). They are addressed separately, as they represent the benchmarking outcome. By agreement we mean the extent to which this system covers the requirements of the project and its systems (incl. the ones to be developed) and by gap we mean the aspects/ characteristics missing by the systems that will be/ or have to be part of the ADAS&ME systems, in order to fulfil the project aims.
Figure 3:ADAS&ME benchmarking generic methodology
1.3 Connection to Use Cases
Our ‘vehicle’ for the whole process is one of the major selection indicators, their relation to the UCs. It is evident that this is not always so straightforward and at this early stage of the project many assumptions are necessary, in order to accept and include any possible connections to ADAS&ME UCs. First, the project’s UCs are not final and their descriptions are not yet of the same depth and concreteness.
The following table presents the requirements for each UC with regards to affective state, vehicle, and systems considered. In conclusion, this table is enriched with suggested systems (or functionalities) to include, in order to improve the outcome for the systems and reach the anticipated outcomes. The following table (Table 2) is an overview and at some point it will probably be revised in order to reflect the updated UCs and respective sensors/ systems. The table can be used for quick reference of systems to UCs. For example, if a system is under the driver distraction section, it means that it relates to UC A, UC C, UC D and UC E. ` Identify Benchmarking areas/ product categories Identify companies and products that fall
into these categories
Gather information/ descriptions and communicate with partners responsible per action based on a
common template (Gathered indicators)
Focus search based on UC requirements-Connection between benchmarking action and ADAS&ME UCs
(selection/ performance indicator) Outcome is characterised based on the following indicators: Agreement and Gap
Benchmarking indicators
UC (partner) Affective state Vehicle / user Considered/ included system UC A (SCANIA/ DENSO) - Drowsiness/ sleepiness - Inattention/ distraction - Workload/stress - State of rest (resting
yes/no)
- Emotion state/valence
Truck –
professional drivers
- Smart Eye: Eye tracking and emotion tracking
- Autoliv Steering Wheel: GSR, HR - “Fitwatch”: HR, accelerometer - Cognitive Model (DLR)
- Stockholm University: Sleep/rest detection
- 1 channel EEG (potentially)
UC B (VEDECOM/ VALEO) - Range Anxiety - Driving style Electric car / passenger car drivers Anxiety monitoring Driving style monitoring
UC C (DLR, DENSO, TomTom, FORD) - Drowsiness/ sleepiness - Inattention/ Distraction - Workload/stress - Impairment/ fainting - Rest Passenger car/ passenger car driver
Apart from affective states’ related monitoring, additionally:
- Environmental sensing - Maps and guidance
UC D (DLR, DENSO, TomTom, FORD) - Workload/ stress - Impairment/ fainting - Rest Passenger car/ passenger car driver
Apart from affective states’ related monitoring, additionally:
- Environmental sensing - Maps and guidance
(navigation)
- V2X communication (for emergency manœuvres) - HMI designs for automation
(taking over, control, emergency) UC E (DUCATI/ DAINESE) - Drowsiness/sleepiness - Fatigue - Inattention - Stress - Physiological impairments (dehydration, heat exhaustion, hypothermia) Touring motorcycle/ rider
The PTW will be equipped with the following sensors: • Satellite navigator • IMU • ABS • BBS • BT
The PTW will be equipped with the following HMI:
• visual feedback
• haptic feedback (if necessary) The wearable system will be equipped with the following sensors:
• body temperature • ECG sensor
• Galvanic Skin Response • GPS
UC (partner) Affective state Vehicle / user Considered/ included system
• D|AIR platform
(accelerometer, gyrometer and magnetometer)
The wearable system will be equipped with the following HMI:
• visual feedback • haptic feedback DAINESE Intelligent Helmet
The helmet will be equipped with the following sensors:
• head tracking system • eye tracking system
The helmet will be equipped with the following HMI: • visual feedback UC F (DUCATI/ DAINESE) - Faint Touring motorcycle/ rider Same as above UC G
(SCANIA/VTI) - Stress - Fatigue states
Bus/ bus driver
Driver monitoring systems Map/ stop monitoring and control Wristband reminder
2
Overview of affective state recognition techniques
The following sections in this chapter demonstrate the major areas of interest across affective states, UCs and vehicles in the deliverable.
2.1 Affective states’ definitions
Affective states addressed in the project need to be defined in terms of project and Use Cases context and demands. The following definitions are not the ones adopted for the project but they will be further refined (or made specific), in order to accommodate for each UC’s requirements. Responsible partners were asked to complete also any definitions they have found of affective states during the literature searches. The initial templates circulated to responsible partners, included two extra columns, aiming to assist the work carried out within A1.3 (affective state definition and ground truth, respectively). The following table presents the definitions of affective states, as currently being defined in the project, the clustering of affective states - depending on their definition and relation to other, as well as the currently undertaken ones within A1.3.
Table 3: Affective states’ definitions
Cluster Affective state Definition UC
Fa
tig
ue
Fatigue Fatigue refers to tiredness that can be physical and/or mental.
A,E,F,G Drowsiness/
Sleepiness
Sleepiness refers to the inability to stay awake even in situations in which wakefulness is required.
E,F,G Rest (state of rest) Rest is a state characterized by relaxation, and in most
cases, mental and physical inactivity. Thus, the definition of rest means that no work is undertaken.
A tte n ti o n
Attention/Attention of activities, whereat a resource denotes any sensory, actuator, perceptual, motor or cognitive mechanism that is utilized in performing activities. it is characterized by two dimensions: activation and selectivity
Inattention Described as “a mismatch between the current allocation of resources and those resources demanded by activities critical for safe driving.
E,F,G
Visual distraction Three types exist: a) occurs when the driver’s visual field is
blocked by objects, that prevent them from detecting or
recognizing objects or hazards in the road environment, b) occurs when the driver neglects to look at the road and instead focuses on another visual target for an extended period of time and c) involves a loss of visual “attentiveness”, often referred to as “looked, but did not
see”, and interferes with the driver’s ability to recognize
hazards in the road environment.
C,D
Cognitive Distraction
Includes any thoughts that absorb the driver’s attention to the point where they are unable to navigate through the road network safely and their reaction time is reduced.
C,D Em o ti o n s Emotion state/valence
Valence, as used in psychology, especially in discussing emotions, means the intrinsic attractiveness (positive valence) or averseness (negative valence) of an event, object, or situation.
A
Emotions An affective state of consciousness in which one or more of the below-mentioned states are experienced, as distinguished from cognitive and volitional states of consciousness. Universality of a facial expression indicates that it is presented in a particular fashion, in the same way among everyone regardless of the age, gender, ethnicity or cultural background. According to Ekman there are six of those emotions: Happiness, Surprise, Anger, Sadness, Fear, and Disgust. C,D S tress/ W o rk lo a d
Anxiety “Anticipation of a situation that cannot be mastered using available resources” which is characterized by a feeling of strain and pressure.
B
Stress “Anticipation of a situation that cannot be mastered using available resources” which is characterized by a feeling of strain and pressure.
C,D,E,F
Mental effort/ workload
“As perceived distance from a task goal increases and the effective time for action decreases”.
A Confusion A disruption of awareness marked by amazement, a lack of
cognitive or behavioural clarity, and confusion for place, individual, and time. Commonly referred to as mental confusion. E,F Phy sio lo g i ca l st a tes
Dehydration Refers to a deficit of total body water, with an accompanying disruption of metabolic processes. Dehydration is also a cause for hypernatremia. The term dehydration is distinct from hypovolemia (loss of blood volume, particularly plasma).
thermoregulation that occurs when a body produces or absorbs more heat than it dissipates. For humans hyperthermia is defined as a temperature greater than 37.5 °C or 38.3 °C, on the reference used, that occurs without a change in the body's temperature set point.
Hypothermia Is defined as a body core temperature below 35.0 °C. Hypothermia usually occurs from exposure to low temperatures, and is frequently complicated by alcohol consumption.
E,F
Frostbite The medical condition in which localized damage is caused to skin and other tissues due to freezing. Frostbite is most likely to happen in body parts farthest from the heart and those with large exposed areas. The initial stages of frostbite are sometimes called frostnip.
E,F
Faint Syncope, also known as fainting, is defined as a short loss of consciousness and muscle strength, characterized by a fast onset, short duration, and spontaneous recovery.
F
2.2 Driver monitoring
Emergence of sensors within the 90’s as well as of increased capacity computers paved the way for new research in vehicle telematics and innovative research in monitoring driver’s behaviour and states. Work in European projects, such as DETER-EU (Brookhuis, 1995) and PROCHIP/ PROMETHEYS (Esteve et al., 1995) introduce driver monitoring, the SAVE-project (Bekiaris, 1999) sensor fusion was introduced to monitor driver impairment.As research progressed, more sensors and more indicators were included, like eyelid sensors, steering wheel sensors, vehicle parameters related sensors.
The SENSATION project (SENSATION, 2004) aimed at promoting novel micro and nano sensors for physiological state monitoring. The focus of the work was the detection, the prediction and the management of the sleep and wakefulness states and their boundaries, stress, inattention and hyper-vigilance. The indirect supervision systems are generally based on the analysis of the vehicle’s behaviour, that can be correlated to driver actions (steering wheel movement for example) and other information available on the vehicle. It should be noticed that the first Driver Drowsiness Monitoring systems, being already commercialized belong to this category.
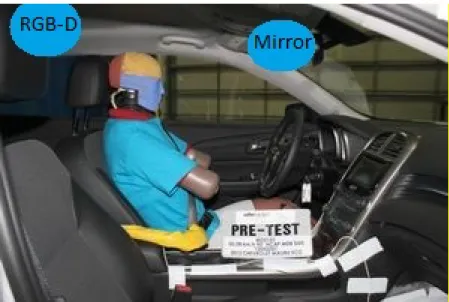
Driver activity recognition is the process of determining what the driver is doing, while he/she is in the vehicle. With the introduction of in-vehicle information systems, as well as smartphones drivers often are distracted from their main activity, this situation will become even more common with the introduction of autonomous vehicles that are decreasing the workload of the driver. Systems available currently can detect head pose (Zhu and Fujimura, 2004), (Murphy-Chutorian and Trivedi, 2008), (Baker, 2004), targetng detection of fatigue and sleepiness by measuring the head pitch. For driver activity monitoring, image processing methodologies were proposed in (Veeraraghavan et al., 2007) for driver activity classification in safe and unsafe (Park and Trivedi, 2005) with classifier algorithms used for activity identification as gear shifting, changing the radio channel, swerving or driving forward- backward. More recently RGB-D sensors were used for driver monitoring in (Ikoma, 2014) An RGB-D sensor was used in a driving simulator, while in (Kondyli et al., 2013) the sensor was used in the vehicle with very promising results based on the driver motion capture, proposing the development of a framework in order ADAS to take into account not only the vehicle state but also the driver’s activity. The placement of the RGB-D sensor did not allow a second passenger in the vehicle, however a more appropriate placement of the sensor with the use of mirrors is feasible.
Figure 4: RGB-D placement for driver activity identification
3
Literature review on driver impairment and monitoring
The chapter is divided in to two major sections: a) review of research in driving impairment and driving, and b) driver monitoring systems and driving/ riding.
3.1 Driver impairment
Driver impairment’s literature survey because of induced or existing affective state was conducted by each partner responsible for each affective state and the review results are briefly presented below per reviewed publication. A short summary is added for each study. This section includes a short literature review of primarily relevant aspects for the specific impairment cluster and a detailed literature review. The full compendium of literature follows in Annex 1. The aim of this work is to contribute references to the work carried out in the rest of WP1 activities.
3.1.1 Fatigue, drowsiness and sleepiness
There is no concrete definition of such definitions that are universally accepted. However, early definitions have been taken up and will be further discussed in D1.2. The end result is that regardless of any of these definitions or states, they all reduce driver’s vigilance/ arousal and negatively affect their driving performance. Several parameters have been identified to diagnose sleepiness and is presented in the following diagram (SENSATION EU project, 2004-2008) and monitors the involuntary transition from wakefulness to sleep. Overall, there are different types of indicators, either directly measuring any of these states or indirectly, through other channels. The following table stems from the SENSATION project (Deliverable 1.2.2; Muzet, 2006), where the authors defined the most appropriate measures and indicators to detect sleepiness. These were the best candidates for developing systems or prototypes in order to measure and detect sleepiness in drivers. The last column reports any related weaknesses in the proposed measuring process and/ or indicator. This table serves as a baseline and reference list and the literature review will enhance and further the described systems and indicators.
Table 4: List of most valuable sleepiness physiological indicators and techniques
(SENSATION EU project) Physiologic al system Physiolo gical function Physiologi cal indicator Measurement technique Comment Weakness
function indicator
Sensorial system
Vision Gaze fixity Gaze direction VOG (videooculograp hy) Camera looking to driver's face
2 cameras with quite resolution are necessary to perform a good reconstruction of the eye gaze Eye lid closure and blinks
Eyelid sensor Camera looking to
driver's face
Results obtained are different depending onConditions of the recording. Globally, main
reasons for low detection rate are bright
incident illumination by daytime driving (e.g.
sundown), glasses, fast head movement, driver specific behavior (hand on face, inclination of the head). Motor system Body motility Body posture Sensitive matress Implementation in the seat
Problems with the reliability of the signals.
The measurements are strongly dependent on the subjects Autonomou s nervous system Cardiova scular function
Heart rate Pulse detection Sensor in the steering wheel or in the seat Implementation of the sensor is critical Respirati on Respiration movement
Strain gauges Sensor in the seat or linked to the safety belt
Sensitivity Electrod ermal activity Skin conductanc e
Electrodes Sensor in the steering
wheel
Movement of the hands create artifacts Skin
resistance
Electrodes Sensor in the steering
wheel Skin
potentials
Electrodes Sensor in the steering
wheel
Behaviour Videometry Camera looking
at the driver
Complex image processing
For a complete list of indicators and techniques, please read respective SENSATION deliverable D1.2.2).
In addition, the Support Vector Machine (SVM) method has been applied, in order to monitor driver’s fatigue in real time based on physiological measures, such as EEG and ECG. The results of the SVM model are used to recognize the levels of fatigue in drivers (Shiwu et al, 2008).
a) Eye closure and thoracic effort characteristics
These characteristics have traditionally been used across studies with potential for several parameters to be extracted. The spontaneous eye blink comprises of 3 phases: i) the closing phase (the eyelid goes down to close), ii) the close phase (the eyelid is down and eye is closed), and iii) the opening phase (the eyelid is going up and the eye is opening). It is obvious from the following shape (Figure 5) that the eyes close faster than they open, with a difference of 200 mm/sec (Speedclosing = 350 mm/ sec and Speedopening 150 mm/sec). Therefore, the speed of closing and opening of the eyelid are measures very sensitive to change because of sleepiness and, more specifically, the peak velocities are measured. The velocities decrease considerably when the driver is sleepy but the variability across participants is high, therefore considerable and repeated measures per person are required, in order to ensure correct detection.
Figure 5: Eye blink shape
Blinks are affected by the driver’s vigilance state (Blinksleepiness =1.5Blinknormal) with blinks referring to sleepiness when they are above 600 ms whereas the ones that are between 120 and 250 ms are considered as normal (“tired” corresponds to 300 and 600 ms). As the driver becomes sleepier, blinks become longer and their duration also increases. The increase is not linear and depends on personal characteristics. Blink amplitude, rate and interval are characteristics that are affected by sleepiness but are sensitive to other factors as well. The most common surrogate variable encountered in studies is the so-called PERCLOS (PERcentage of eyelid CLOSure over time), proposed by Wierwille back in 1999. Another commonly used estimate was proposed by Johns and colleagues (2005) and is called AVRBs and measures the blinks’ amplitude/ peak closure velocity ratio that changes with drowsiness levels, including parameters such as duration of eyelid closure and amplitude velocity ratio.
Hargutt (2003) proposed another estimate, the drowsiness index, where coils are placed on both eyelids (i.e. upper and lower), the movements are measured and analysed and the eye-opening level is calculated based on an drowsiness detection algorithm that identifies four stages (i.e.fatigue, drowsiness and sleepiness can be also viewed as stages of the same affective state for the algorithms calculations). The stages are: from being awake (Stage 0 – eyes open, short blink durations, low blinking frequencies), to hypovigilant (Stage 1 – eyes open, short blink durations, high blinking frequency), to drowsy (Stage 2 – eyes half closed, long blnk durations, high blinking frequency), as to sleepy (Stage 3 – eyes nearly closed, very long blink durations, microsleeps).
Another type of important biomedical signal, widely used in sleep research, is the thoracic effort. The thoracic signals become irregular when moving from awake to drowsy or sleepy state. The increase of yawns shows that the driver has entered a fatigue state. Changes in the amplitude and signal frequency are lower when compared to the first line (i.e. baseline state). The TEDD algorithm / index is used to estimate the respiratory rate variability for each person, based on normalizing the individual’s baseline data (i.e. collected in normal conditions). Moreover, the Gold Standard signal is used to create a reference, in order to categorise drivers to states. The GS algorithm incorporates measurements from PERCLOS, EEG, and video observation of the same instance (i.e. 1 minute window). The GS enables the creation of fatigue and drowsiness thresholds against driver’s baseline signals in fully awake stage (i.e. stage 0 for awake stage; stage 1 is for fatigue and stage 2 for drowsiness) whilst being robust to driver’s movements, head turns, etc.; making it valuable in application in real-life driving scenarios.
(88.7%).
b) Driving performance parameters as indirect measures of sleepiness
Vehicle parameters have been gathered and measured for many decades in road safery research and they are completely unobtrusive to the driver as well as they do not interrupt or disrupt their driving experience. Vehicle parameters are collected for many aspects of driving behaviour through sensors (e.g. braking, steering wheel turing, lane deviation, headway, etc.). Not much focus will be placed on such measures because they have βεεν extensively gathered and reported in literature (e.g. SENSATION, AKTIV, AIDE EU projects). The following table presents the different types of vehicle parameters that can be collected in order to investigate sleepiness whilst driving.
Table 5: Vehicle parameters to detect sleepiness Measure
Control Activity measures Performance measures
Longitudinal
Braking, accelerating,
decelerating, braking reaction time, errors
Headway (distance/time)
Lateral
Magnitude and frequency of steering, slow and fast steering corrections
Standard Deviation of Lateral Position (SDLP), Time-to-Line Crossing (TLC), Lane crossing no., mean yaw rate, mean lateral position.
A summary of the literature review is presented in Table 6. Each publication is categorized with a key with regards to its relevance to the project and relevant UCs. A group of five experts discussed and categorized each publication based on this categorization. The same categorization scheme was applied for all publications reviewed in this Deliverable.
Publication Objective Mesured Results Relevance to ADAS&ME Contribution to UCs Key
Jackson et al. (2016)
The study aims at the comparison of two drowsiness monitors (Copilot and Optalert)
PERCLOS KSS JDS
Since the optalert systems outperform PERCLOS, it may be possible to boost the performance of remote camera systems by using the same sleepiness metric (JDS) as optalert does.
Composite measures, consisting of several (eye)
parameters, should be used in ADAS&ME. PERCLOS alone does not seem to be a good choice.
Consideration for the compilation of indicators to be used in order to measure sleepiness. Related mostly to A, E and less with F, G.
Selvakumar et al. (2016)
A new partial least squares based algorithm
for classifying open/closed eyes is presented
PERCLOS Eye detector has a true positive rate of 96%, out of these; between 90-100% accuracy is acheived. Worst performance in darkness with glasses due to reflections (about 90%).
A closed-eyes detector has been developed. It is not really revealed how well it operates in realistic conditions.
The algorithm is based on PERCLOS which may not be an ideal measure of sleepiness. If it really is a robust closed-eyes detector then it can at least be used as a late-stage sleepiness or actual sleep detector. Related mostly to A, E
Schömig et al. (2015)
Use of secondary tasks can prevent drowsiness in highly automated vehicles Mean Drowsiness Index in test phases and transitions Interesting and motivating tasks can prevent increase of drowsiness.
Interesting for take-over HMI strategies and measurements for both drowsiness but potential also for rest identification.
Persuasive HMI implementation might increase alertness whilst resting in automated function mode A, E Åkerstedt et al. (2014) Review article comparing KSS ratings
with physiological and behavioural measures in KSS Lane departures, slow eye Subjective ratings of sleepiness are put forward as a sensitive and valid indicator of
Subjective ratings of sleepiness are put forward as a sensitive and valid indicator of sleepiness, which is easy to
KSS should be used as a reference measure of sleepiness in the ADAS&ME evaluations.
different settings, including car driving
movements EEG alpha power Subjective ratings on eye symptoms (heavy eye lids, gravel-eyed, difficulties keeping eyes open) sleepiness, which is easy to use and just as valid as other sleepiness measures.
use and just as valid as other sleepiness measures.
Relevant to A, E, F, G
Naeubauer et al. (2014)
Use of games and conversation to energize (when fatigued) driver during
automated driving Reaction time SDLP Dundee Stress State Questionnaire (DSSQ)
The study showed that usage of secondary media devices may improve vehicle control and reduce driver fatigue
HMI design that support secondary task in low-workload driving can reduce driver fatigue and increase task engagement. Though media usage is not associated with faster response time or lasting driver alertness.
Persuasive HMI implementation might increase alertness whilst resting in automated function mode A, E Halvig et al. (2014) Investigate unintentional lane departures with various measures KSS blink duration KDS Lane departures KSS is the best indicator of lane departures. Blink duration can also be used when customized to an individual. KDS (EEG+EOG-based) is not successful in
predicting lane departures
Measures of sleepiness should be individualized.
KSS remains a strong indicator meaning it can be used with any type of vehicle. HMI strategies could consider its usefulness incorporated to driver/rider’s regime. A, E, F, G Jung et al. (2014) Measure sleepiness through steering wheel
ECG (HRV) along with
Only descriptive, not conclusive.
Similar to the steering wheels provided by Autoliv. Other
Textile sensors need validation, therefore not very
textile sensor. subjective measures
studies, using medical ECG equipment, have had trouble providing reproducible results.
useful for A, E-there are other techniques more powerful and already validated- but mostly relevant for F, G (though not for steering wheel but for other type of clothing/wearable)/
McDonald et al. (2014)
Compare algorithms that best predict driver’s involuntary lane departures because of drowsiness in a simulator study PERCLOS Subjective sleepiness Steering wheel angle measures ORD scale Performance is comparable, but random forest is the best in terms of AUC. Accuracy of the algorithm was 79% (PERCLOS 55%) and positive predictive value was 80% (PERCLOS 88%)
The steering wheel angle alone, without taking road geometry into account, provides a decent estimate of driver sleepiness. However, the results also indicate that a lack of steering is the key feature used to predict sleepiness. This appears to be a poor indicator on long monotonous motorways (where little steering is needed and where sleepiness is a large problem).
Vehicle measures should not be ruled out for drowsiness detection, but despite what the authors claim, it is probably wise to take road geometry into account. Mostly relevant to A, E.
Jin et al. (2013)
Classify alert vs. sleep restricted conditions with SVM PERCLOS Gaze direction Blink rate Fixation time features for SVM Individual models were derived with 85% accuracy.
The lesson to be learned from this paper is that we can gain a lot by individualized models. Performance drops when a general (group-level) model is applied to an individual driver.
Indicators /features to be used for individuals models of sleepiness, relevant to A, E, F, G.
Marina etal. (2013)
Forearm muscle fatigue patterns and relating maximal voluntary contraction with EMG
EMG of flexor digitorum superficialis (FS) and carpi Forearm discomfort might affect inattention.
To monitor rider’s inattention, relevant and important to clearly distinguish inattention due to distraction (external
Measure of fatigue and inattention directly affecting riders could be useful for E and F. As there are other
among motorcycle riders.
radialis (CR) were
monitored
cause) and inattention due to fatigue (internal cause).
already established techniques for monitoring
these two states in drivers, then no need to apply to drivers. It could be interested though to investigate if there is any relevant ground truth with regards to state of rest. Craig et al.
(2012)
Investigate regional brain wave activity changes associated with fatigue
EEG Changes in EEG can
be used to detect severe fatigue, but the actual difference is small between alert and fatigued
Even with EEG it is difficult to design a sleepiness detection system.
The paper says nothing about the transition phase from alert to fatigued but the analysis methods could be useful –for the two states- for UC A, E.
Dong et al. (2011)
Review SoA technologies related to
both fatigue and inattention Subjective Biological Physical Perfofmance Hybrid
Hybrid measures give more reliable
Results
Monitoring systems Variation in data sources
Fatigue is better measured with hybrid measures
A,E,F,G Senaratne et al. (2011) Comparison of classification approaches versus optical flow to estimate eye state (open/closed
PERCLOS Classification: Eye pixels or wavelet coefficients are classifed as open/closed using MoCC, kNN, SVM, NBC.
The classification approach is more accurate but requires large amounts of training data. If such data are unavailable, the optical flow approach is preferable.
The algorithm is based on PERCLOS which may not be an ideal measure of sleepiness. If it really is a robust closed-eyes detector then it can at least be used as a late-stage sleepiness or actual sleep detector.
Golz et al. (2010)
Investigate how electrophysiological signals can be used to validate video-based
PERCLOS, KSS, SDLP, EEG, EOG
PERCLOS in itself is practically not very usfeul for fatigue monitoring
The authors recommend complementing PERCLOS with other eye/face measures that can also be extracted from
Selection of combination of data for ground truths of fatigue for A, E, F, G.
fatigue monitoring systems
the camera, such as pupil diameter and eye movements. Off-the-shelf products are not good enough for sleepiness detection.
Liu et al. (2009)
This is a review article aimed to assess whether it is possible to predict driver sleepiness using vehicle measures. KSS EEG SDLP SWM Composite vehicle measure has to be explored further. The time window used for deriving the sleepiness estimate was high.
It is very beneficial to adapt driver monitoring systems to individual drivers.
Simple vehicle functions will not do for any type of vehicle; ground truth should be based on composites. Important for all sleepiness related UCs, i.e. A, E., F, G. (same as above publication) May & Baldwin (2009) Identifying causal factors of fatigue Theoretical paper Several systems available to detect and counter fatigue.
PERCLOS and lane departure/collision avoidance systems are useful to counter multiple driver impairments such as task related fatigue and inattention. Automation at levels 0-3 may counter active task related fatigue.
Head-nodding and deadman switches are only able to detect sleepy drivers after sleep has set in. Automation at levels 0-3 may cause passive task related fatigue.
An effective countermeasure technology has to take the cause and type of fatigue into account.
Mostly relevant to A,E. Indirectly can reveal indicators for F,G.
Stress in drivers can be detected by measuring bio-signals with the Dynamic Bayesian Network method (Rigas et al., 2008). The implemented framework (based on probabilistic reasoning) showed strong correlation between levels of stress in drivers and the model’s outcome. Heart Rate Variability (HRV), easily derivng from the variation in R-R interval of ECG, is used extensively in stress research as a real-time detection of electrocardiogram (ECG), opening the way to new signal processing features and techniques, in order to extract meaningful physiological signals (Jeong et al., 2007), as well as being sensitive in cognitive workload (Kumar et al., 2007). Another method, named Page’s technique (Singh et al., 2012) is used, to categorise data in two separate levels of stress based on a self-organized map. Another method proposed by Deng and colleagues (2012), is based on feature selection, by using the following classification algorithms: a) Linear Discriminant Function (LDF), b) Support Vector Machine (SVM), c) Naïve Bayes, d) K Nearest Neighbour (KNN), and e) induction tree C4.5. Continuous collection in real driving environment of a combination of physiological signals (ECG, EMG), including skin conductance and respiration, was used, in order to measure stress levels, showing that they constitute adequate and appropriate stress metrics for drivers (Healy & Picard, 2005).
Figure 7: Galvanic Skin Response (GSR) normalised responses as a function of time (sec)
As in the previous section, the following table (Table 7) presents an overview of the main findings and a final verdict (key) about the utility of publication to the specific UCs where this affective state will be measured and taken into consideration.
3.1.2.1 Range anxiety
Although, stress results into anxiety and, thus, having a causational relation, range anxiety constitutes a separate category and is related to anxiety produced because of not knowing/ controlling charging frequency and selection. It is anticipated that this state might not exist in a few years, due to increasing construction of charging infrastructure that are appearing already throughout Europe. This state is relevant only to electric vehicles and relevant literature review results are presented in Table 7 and in Annex 1.2.
Table 7: Summary of literature review- Stress affective cluster
Publication Objective Mesured Results Relevance to
ADAS&ME
Contribution to UCs Key
Giannakakris et al. (2017) To develop an automated identification of a set of facial parameters (semi and non-voluntary)
Facial parameters in different conditions (i.e. social exposure, emotion recall, stressful
images/mental task and stressful videos)
The results in terms of classification accuracy varied between 80-90 % taking into account the most effective classifier. This systematic review provides evidence that adverse psychosocial work conditions are negatively
associated with ANS function as indexed by HRV.
The use of different classification across various contents but not contexts. Real driving requires increased sensitivity and accuracy and no evidence exists; only
potential for transferability.
Relevant for C,D,E,F Rodrigues et al. (2015) A mobile sensing approach was designed to detect georeferenced stress responses and facilitate memory recall of the stressful situations
ECG sensors (Vital acket + Physionet), GPS and button for self-reporting stress event and were driving every day a daily route
The findings suggest that the system can be a promising tool to support applied occupational health interventions for public bus drivers
and guide authorities’ interventions to improve these aspects in “future” cities.
The system show promising results combining HRV and GPS information with stress button.
Good for bus drivers understanding. Highlighting the most stressful contributors. Relevant for C,D,E,F but also A (bus driver).
Wickens et al. (2015)
This study replicated the findings of the in situ methodology using a
between-Time urgency, lack of perceived control, and trait susceptibility
Driving style and loci of control are of key importance of how stressed
Driving style and loci of control are of key importance.
The main outcomes (e.g. lack of perceived control, trait susceptibility)
subjects research design in high and low congestion conditions
someone can be. Congestion can be a factor.
can be used to build up the current driving style as part of the driver’s behaviour that can directly or indirectly affect the affective state the driver experiences. Relevant mostly to UC B
Rigas et al. (2011) A methodology for detecting drivers’ stress and fatigue and predicting driving performance is presented
physiological signals (ECG, EDA, and respiration)
Video recordings (face)
Environmental information
Results based only one driver; reliability is not sufficient. Association of fatigue states with driving performance
Classification of states based on extracted features is extremely relevant to the FER that the project has uptake.
The approach is validated and thus within the project we may replicate or replicate parts of it. Relevant to A, E, C, D.
Benoit et al. (2009) This paper presents a driver simulator study and taking into
account the information about the user’s state of mind (level of attention, fatigue state, stress state)
Video data and biological signals
Not clear, not described.
The simulator-based
approach is interesting and the
combination of video and physiological
(especially which data types have been chosen) in relation to feedback output.
Difficult to define the relationship with this project as processes and outcomes are not clearly discussed. However, the choice for measuring stress and its relation to multimodal attention is interesting not only for identifying the driving impairment per se because of stress but also the effect it can have in
respective HMIs within the project (i.e. multimodality in information/ warning and stress). Relevant to C, D, F. it would be highly recommended
because the approach is interesting but there no results supporting the efficiacy of this approach. Range Anxiety Franke et al. (2016) Measure range
anxiety as part of everyday range anxiety Subjective measures in stress-related events Less frequent encounter with critical range situations, higher practical experience, subjective range competence, tolerance of low range, and experienced trustworthiness of the range estimation system were related to lower ERS.
Moreover, range stress was found to be related to range satisfaction and BEV acceptance.
Address variables related to lower range stress in UC B.
Günther et al. (2016) Which eco-driving strategies users know before and after driving a BEV for 3
Driving test The results imply that eco-driving strategies for ICEVs have to be adapted
The strategies are more important for training EV drivers
rather than
Not directly applicable but can
help in selecting the indicators that are