Université de Montréal
STUDY OF THE RELATIONSHIP BETWEEN ACADEMIC PERFORMANCE
AND SOCIOEDUCATIVE CLIMATES
IN GIFTED HIGH SCHOOL STUDENTS
par
Jonathan VALLERAND
Département de Psychopédagogie et d’Andragogie Faculté des Sciences de l’Éducation
Travail à la Faculté des Sciences de l’Éducation en vue de l’obtention du grade de M.A.
en Psychopédagogie
Décembre, 2014 © Jonathan Vallerand, 2014
The Underachievement of Gifted Students: a societal problem
Before we start tackling the issue of gifted underachievement, we must define what a gifted individual actually is. A gifted individual, as defined by Gagné (2000), is a person presenting aptitudes or performing at a level significantly superior to the average. Furthermore, the leading conception of giftedness is that it is related to a domain in particular, and that “gifted” only means something when coupled to a set of aptitudes or performances: for example, athletic, artistic, or intellectual giftedness. In this article, unless explicitly presented otherwise, “giftedness” will be used to mean “intellectual giftedness”, for increased clarity.
If we concentrate on academic aptitudes, gifted individuals seem to be at risk of performing lower than their abilities lead us to expect, a phenomenon we call underachievement. Underachievement is understood to be performance at a level significantly lower than the individual’s aptitudes would lead us to expect (Reis & McCoach, 2000). Like giftedness,
underachievement is also related to a particular domain: one could say that a particularly athletic individual who does not do well in sports is underachieving in that field. Again, as with
giftedness, underachievement will be used in this article to mean “academic underachievement”, so as not to add unnecessary weight to the text.
In a review of literature, Seeley (1993) looked through many studies to calculate, in each of those studies’ samples, the number of gifted students who underachieve academically in a significant manner, and found them to be between 15 and 40 %, depending on the definition of both “gifted student” and “significant manner” used by the researchers. According to Nation at Risk, a government-ordered report on American schools, over half of America’s gifted students’ school performance stands at a subpar level when compared to their ability (National Commission on Excellence in Education, 1983). The only study of this sort led in Quebec identified that 16% of
gifted high school students in the province are underachieving in school (Rivest, 2013).
Furthermore, Richert (1991) estimates that all of these numbers, including Nation at Risk’s 50 %, are not high enough. According to him, the identification of giftedness often discriminates
against academic underachievers by defining it not through aptitude testing, but through achievement or perception, effectively excluding them from the gifted group, leaving us with a sample with fewer underachievers than it actually contains. While these numbers are certainly dated, they stand to prove the existence of this phenomenon. Even if these numbers had drastically decreased since in the last twenty years, the scientific interest in this phenomenon comes not from the amount of students who are part of this group, but from both the gaps in knowledge towards it (which will be discussed later in this document) and the lack of
acknowledgement of its existence amongst the decision-makers, as hinted through their disregard for the gifted situation in the policies that are passed regarding education, as will be presented next.
1.1 An overlooked reality
Despite the amount of research led on this topic, this problem is seldom acknowledged by the general population. Indeed, as Morisano and Shore (2010) mentioned, the idea that a gifted student’s performance could be subpar is rarely addressed. These authors see this lack of awareness as a consequence of an unrealistic perception of what giftedness truly is: many, even among those who work in education, see it as a synonym of academic success on a silver platter, which is a skewed vision of this group. Moon (2009) shares Morisano’s and Shore’s opinion on this topic: According to him, this myth’s persistence is supported because it takes away the educators’ responsibility towards these students: « If the myth [that giftedness automatically leads to effortless school success] is true, teachers, principals, and superintendents have no
responsibility to recognize the existence of this special population of students or to attempt to address their needs » (p. 274).
According to Peterson (2009), this type of myth goes back to the first few researches on gifted youth, where gifted subjects were identified as high-achieving students, and not as high-potential students. As such, these definitions only included successful students, those who were supported by their environment or were able to adapt to an environment which was not made to support them. However, those highly intelligent students whose needs were not met and who could not adapt on their own were excluded from this definition of giftedness. Nowadays, when searching for gifted students, the identification process usually focuses on potential rather than
performance, therefore including this second group. This selection bias led to the idea that
giftedness means automatic success, as it was through success that giftedness used to be defined. Aside from this myth, even when the needs which are specific to the gifted are understood, adapting the curriculum is often perceived as luxury, as even if their needs are not met, these students can often perform beyond the average, while still being far from achieving to their full potential. (Fredricks, Alfeld, & Eccles, 2010; Hertberg-Davis, 2009; Moon, 2009; Morisano & Shore, 2010; VanTassel-Baska, 2009).
1.2 Needs of the gifted and adaptation practices
Just as those with learning disabilities or developmental troubles, gifted students have specific needs which must be met in order to support them in their personal and academic development. We will start by presenting the current situation of gifted education in schools through various practices which are suboptimal to their development. We will then follow with the various
adaptations, both pedagogical and administrative, which are offered and supported by scientific literature.
According to the research, some pedagogical practices currently employed in our schools do not foster the academic success of gifted students. For example, it has been found that, in some cases, gifted students are used by teachers to artificially raise their groups’ averages in order to give the illusion that the class has assimilated the content they have presented, and therefore, that they have done their job correctly (Hertberg-Davis, 2009). In other cases, when a gifted student who already masters the content being presented finishes an assignment or an exercise earlier than their peers, they will be handed larger amounts of the same work in order to keep them busy. Doing so does not make the student progress, as they already have mastered the assignment’s content, and this fastidious busy work will only serve to lower their motivation (Fredricks et al., 2010; Gam, Matthews, & Jolly, 2010; Hébert & Schreiber, 2010; Hertberg-Davis, 2009).
Other researchers prefer to look into practices which would optimize these students’
development. Amongst these specialists, one of the most common conclusions is the need to accelerate, to condensate and to enrich the content being presented in class in order to raise it beyond what they already know and to a difficulty level adapted to their abilities (Adams, 2009; Fredricks et al., 2010; Gagné, 2007; Gam et al., 2010; Hertberg-Davis, 2009; VanTassel-Baska, 2009). Such an adaptation of content greatly raises school motivation while it reduces boredom and risks of leaving school. Furthermore, it allows these students to develop at their own quicker speed, rather than be slowed down by classes targeted at slower and less motivated students (Fredricks et al., 2010). In addition, relating the content to real world application as often as possible helps gifted students understand that the work they complete in class is not only busy
work but knowledge and skills that will help them react to the problems of their society (Fredricks et al., 2010; Gam et al., 2010; Watters, 2010).
Administratively speaking, it is important to differentiate for these gifted students as early as possible. As Gagné said ironically: « believe it or not, precocity can manifest itself...
precociously! » [sic] (2007, p.102). While underachievement usually peaks around adolescence (Baker, Bridger, & Evans, 1998), it is often based, as will later be explained, on negative habits taken in prior years. A second aspect that is seen as primordial is the way in which students are put into groups. Many authors support the idea of grouping students according to their ability level rather than their age. Currently, in our school system, we use age as a predicting factor of a student’s ability level when creating groups: however, this creates heterogenic groups in terms of their pre-existing knowledge, meaning that meeting all of their individual needs is an
unreachable goal: Gagné (2005) analyzed this difference in ability in a first grade cohort and found a five year difference between the most capable (whose knowledge levels were that of an average Grade 4 student) and the least capable (who were seen as unlikely to achieve a Grade 1 level within two years. Actually, according to Gagné and Gagnier (2004), the correlation between age and academic achievement in first graders ranges between .10 and .25. However, these researchers found that the use of other variables to group students, such as school readiness or officially tested intelligence, increased that correlation to over .50, for both high-achieving and low-achieving students. Using such variables would allow gifted students and those with disabilities alike to have teachers who can more easily tailor their teaching to their students’ needs and levels (VanTassel-Baska, 2009) as their classes would be more homogenous. Furthermore, mentoring, field experiences and other applied learning opportunities would be beneficial to gifted students. Some schools even go as far as allowing students to do equivalent
individual projects instead of attending more traditional classes, or even allow them to take classes at a higher educational level, for example to allow a gifted high school student to follow the nearest university’s Introduction to Physics class instead of their regular high school physics course (Heinbokel, 2011).
Regardless of what adaptations are chosen, it is important for this part of teaching not to be added to the regular load, for example for instances where it is given after school hours, but rather integrated to the regular class time (Adams, 2009). Indeed, the goal is not only to offer them learning opportunities adapted to their level, but also to maintain their level of school motivation: adding to the student’s load would not help in that, as it would keep the motivation-lowering busy work in their schedule.
Overall, research offers many ideas for changes to schools’ practices, whether pedagogical or administrative, in order to better support the academic, emotional and social development of gifted youth. The adaptation of activities to their level of understanding, the focus on real life application of class content, the concept of grouping students according to factors other than age, and the use of enriched content to replace (rather than add to) the regular content are many propositions from experts of the field which were reviewed in this section.
To conclude, given the specific needs of gifted students and the popular perception of giftedness, it is clear that research on this topic is necessary in order to better support these students’
development. However, an overview of the existing scientific literature is necessary in order to determine the gaps in knowledge which have to be filled.
1.3 Gaps in knowledge
As previously presented, gifted underachievement is a socially important phenomenon in the field of education. As such, in recent years, many researchers from the field of giftedness have attempted to better understand it, in order to efficiently intervene in such cases.
S. B. Rimm’s research is one of the fundamental pieces in the field (1986), in which she groups the factors associated with gifted underachievement in three classes. The first, individual factors, includes school motivation, use of learning and studying strategies and the student’s reaction to the gifted label. The second, familial factors, includes the student’s family’s structure, situation and climate, in addition to parents’ behaviour. Finally, the third one, school factors, includes the content taught in class, the level of adaptation to the needs of the gifted, and peer pressure. All of these factors will be explored in depth in the following chapters.
This third class, school factors, should, in our opinion, be subdivided into two categories. The first would be more centered on the pedagogical aspect of school: content taught, teaching practices and adaptation to students with special needs are some factors coming to mind which would belong to this category. The second category, which we will name socioeducative, would focus more on the school’s climate, on the more social, affective aspect of an educational
establishment, which can be affected by a slew of factors, whether social, economic, structural, organisational, or even academic. Indeed, while numerous articles have suggested a relationship between these variables and students’ school performance in the general population (Center on Education Policy, 2012; Reiss, 2009; Renaud, 2009; Viau, 2009; Wang & Holcombe, 2010), few factors from this second category have been studied in the case of gifted underachievers.
Recently, Rivest (2013) conducted a research regarding the relationship between
and (2) the amount of pedagogical support they received. In a more well-known review of
literature, Reis and McCoach (2000) only presented a single research on the relationship between gifted underachievement and socioeducative variables (that of Baker, Bridger et Evans (1998)). The fact that only one research article discusses this relationship, and that this article is over fifteen years old, is in and of itself proof that further, more modern research is important. Furthermore, this article raises a few questions regarding its validity and its sample’s representativeness of the gifted underachiever population.
1.4 Relationship between socioeducative environment and gifted underachievement
As seen earlier, only two recent studies have touched upon the relationship between
socioeducative environment and gifted underachievement: those of Rivest (2013) and Baker, Bridger and Evans (1998). In this section, we will analyze what these studies brought to the table, and what has yet to be looked into.
1.4.1. Rivest (2013)
Rivest (2013) studied the impact of many variables on the academic underachievement of gifted students on a sample of over 9,000 subjects, from Grade 7 to Grade 11. While many were individual and psychological in nature, some were defined as environmental: many of these do belong in the socioeducative category we created earlier. These variables are: parental
engagement, educative climate, friends’ disinterest in school, relationship with teachers, parental support, parental supervision, pedagogical support, and parental valorisation of schooling. She concludes that three environmental characteristics have a statistical impact on gifted underachievement: parental support, quality relationships with teachers, and pedagogical support, all of which we declared o be socioeducative. However, Rivest’s analysis of
socioeducative variables, while interesting and important, is not exhaustive: what about the feeling of security, or of belonging? What about inter-student relationships?
1.4.2. Baker, Bridger and Evans (1998)
In their 1998 research, Baker, Bridger and Evans proposed three groups of variables meant to explain gifted underachievement, each of them representing one of Rimm’s three classes of factors (individual, family and school), in order to compare them and to determine how much of a role each one played in predicting underachievement in gifted students.
Each of these groups contained three variables.
The group of variables pertaining to school environment was formed of the school’s academic quality, of the quality of the students’ relationship with their teachers, and of their relationship to their peers. If we divide this third group of variables in two categories (pedagogical and
socioeducative), as we suggested doing with school variables in the previous paragraph, we can include the school’s academic quality in the pedagogical category, and the relationships with peers and teachers in the socioeducative.
It is also important to discuss this research’s sample: participants were 56 students between grade 4 and 8. All were identified as gifted prior to being accepted in a gifted program, and all had “scores above the 90th percentile on standardized tests” (Baker et al., p.8), without specifying the standardized tests which were used. The students put in the underachiever group were those who were “at risk of academic failure or removal from gifted programs because of poor performance” (Baker et al., p.8).
According to their analyses, the individual group of variables would be the best indicator of underachievement in gifted pupils by a very small margin, being correlated at .78. The
being correlated at more than .73. However, in the case of the third group (school environment), not each variable was seen as significantly correlated to underachievement when analyzed individually: only the variable relating to the evaluation of the school’s academic quality was seen as significant, the two variables relating to interpersonal relationships (relationship with peers and relationship with teachers) being seen as non-significant. With our unofficial subdivision, this means that Baker, Bridger and Evans’ findings point towards the conclusion that the impact of the socioeducative subgroup of variables is statistically insignificant to gifted underachievement.
1.5 Limits of Baker, Bridger and Evans (1998)
Even though it is often the single article cited to support the relationship between school environment and gifted underachievement, Baker, Bridger and Evans’ article presents many methodological limits which affect the generalizability of its findings: a problematic sample, invalid variables and reducing groups of variables.
First, the sample studied in this research counts 56 gifted students, only 26 of which are
underachievers. The authors themselves present their insufficient sample size as a limit of their research. Furthermore, the participants are considered as not representative of the entire range of possible problems related to gifted underachievement: one of the main factors for that, we believe, is the participants’ age. While the authors cite many researchers in their introduction who have suggested that gifted underachievement peaks in adolescence, the subjects’ age ranged from 9 to 14 years old. With the speed at which teenagers evolve and change, differences
between a sample consisting of students between 9 and 14 years of age, and another one consisting of students between 13 and 18 years of age will most likely be very important. Therefore, their sample is limited in how representative it is of the actual gifted underachiever
population. According to Seeley (1993), adolescence and its consequences (be they
physiological, psychological or social) are factors which increase a student’s disposition towards academic underachievement: a simple that has not yet reached these consequences will definitely yield different results.
In addition to sampling problems, the study’s methodology leads us to believe that some information they gathered does not truly represent the variables they present in their groups of variables. One of the biggest reason leading us to this belief is the way in which information regarding all three variables from the school groups of variable (relationship with peers and teacher and academic quality) was gathered: the researchers questioned the students’ parents, and used the parents’ perception as being representative of the announced variables, most probably because of the participants’ young age. This limit, while announced in the article’s
methodological section, is not brought into the discussion of the results, which affects the validity of the data collected, affecting the validity of the results, and as such, their generalizability.
Finally, the authors used only three variables per groups of variable, which is an important reduction from the dozens of variables which have been linked to gifted underachievement in other studies: variables which were discarded include school motivation, self-efficacy, familial relationships, parental expectations, or sense of security or of belonging. However, despite the absence of numerous variables, the authors consider their groups of variables as representative of Rimm’s three classes. While the classes themselves might be statistically representative, many important socioeducative variables have not been looked at individually.
We can conclude that, because of its insufficient sample size, its data’s debatable validity, and the reduction of the three classes to only three variables each, the results presented in Baker,
Bridger and Evans (1998) are not easily generalizable. This research is often presented as the only one in the scientific literature to explore the relationships between a gifted student’s socioeducative environment and its school performance, and its methodological flaws beg for more research.
It is as a solution to this lack of knowledge on the relationship between educative environment and underachievement in gifted students that this research was conducted: indeed, the two articles cited above have ignored multiple important socioeducative variables. Through a multi-factorial approach which integrates the students’ perception of their school and family
environments and their academic motivation, we aim to improve our collective understanding of the relationship between educative environment and underachievement in gifted student and finally dig in what we believe is an often overlooked aspect of the problematic.
REFERENCE LIST
Adams, C. M. (2009). Myth 14: Waiting for Santa Claus. Gifted Child Quarterly, 53(4), 272-273.
Baker, J. A., Bridger, R., & Evans, K. (1998). Models of Underachievement Among Gifted Preadolescents: The Role of Personal, Family, and School Factors. Gifted Child Quarterly, 42(1), 5-15. doi: 10.1177/001698629804200102
Center on Education Policy. (2012). What can schools do to motivate students? Washington, DC: George Washington University.
Fredricks, J. A., Alfeld, C. J., & Eccles, J. S. (2010). Developing and fostering passion in academic and non-academic domains. Gifted Child Quarterly, 54(1), 18-30.
Gagné, F. (2000). Is everyone gifted in some way? Understanding our gifted, Winter, 10-13. Gagné, F. (2005). From noncompetence to exceptional talent: Exploring the range of academic
achievement within and between grade levels. Gifted Child Quarterly, 42, 139-153. Gagné, F. (2007). Ten commandments for academic talent development. Gifted Child Quarterly,
51(2), 93-118.
Gagné, F., & Gagnier, N. (2004). The Socio-affective and academic impact of early entrance to school. Roeper Review, 26, 128-138.
Gam, A. C., Matthews, M. S., & Jolly, J. L. (2010). Parental influences on the academic motivation of gifted students: a self-determination theory perspective. Gifted Child Quarterly, 54(4), 263-272.
Hébert, T. P., & Schreiber, C. A. (2010). An Examination of selective achievement in gifted males. Journal for the Education of the Gifted, 33(4), 570-605.
Heinbokel, A. (2011). Gifted programs need the option of acceleration. Talent Development & Excellence, 3(1), 69-70.
Hertberg-Davis, H. (2009). Myth 7: Differentiation in the regular classroom is equivalent to gifted programs and is sufficient: classroom teachers have the time, the skill and the will to differentiate adequately. Gifted Child Quarterly, 53(4), 251-253.
Moon, S. M. (2009). Myth 15: High-Ability Students Don’t Face Problems and Challenges. Gifted Child Quarterly, 53(4), 274-276. doi: 10.1177/0016986209346943
Morisano, D., & Shore, B. M. (2010). Can personal goal setting tap the potential of the gifted underachiever? Roeper Review, 32, 249-258.
National Commission on Excellence in Education. (1983). A Nation at Risk: The Imperative for Education Reform. Washington, DC: United States Department of Education.
Peterson, J. S. (2009). Myth 17: Gifted and talented individuals do not have unique social and emotional needs. Gifted Child Quarterly, 53(4), 280-282.
Reis, S. M., & McCoach, D. B. (2000). The Underachievement of Gifted Students: What Do We Know and Where Do We Go? Gifted Child Quarterly, 44(3), 152-170. doi: 10.1177/001698620004400302
Reiss, S. (2009). Six Motivational Reasons for Low School Achievement. Child and Youth Care Forum, 38(4), 219-225. doi: 10.1007/s10566-009-9075-9
Renaud, R. (2009, 09/15/2009). Une bonne relation enseignante-élève: un tremplin pour la
réussite scolaire. Retrieved 10/01/2013, 2013, from
http://www.usherbrooke.ca/education/accueil/nouvelles/affiche/article/4980/
Richert, E. S. (1991). Patterns of underachievement among gifted students. In M. Bireley & J. Genshaft (Eds.), Understanding the gifted adolescent: Educational, developmental and multicultural issues (pp. 139-162). New York, NY: Teachers College Press.
Rimm, S. (1986). Underachievement syndrome: causes and cures. Watertown, WI: Apple Publishing.
Rivest, M. (2013). La prévalence de la sous-performance scolaire et l'étude de ses déterminants chez les élèves québécois doués et non doués du secondaire. (M.A.), UQAM, Montréal. Seeley, K. R. (1993). Gifted students at risk. In L. K. Silverman (Ed.), Counseling the gifted and
talented (pp. 263-276). Denver, CO: Love.
VanTassel-Baska, J. (2009). Myth 12: Gifted Programs Should Stick Out Like a Sore Thumb. Gifted Child Quarterly, 53(4), 266-268.
Viau, R. (2009). La motivation à apprendre en milieu scolaire. Québec: Les éditions du renouveau pédagogique.
Wang, M.-T., & Holcombe, R. (2010). Adolescents' Perceptions of School Environment, Engagement, and Academic Achievement in Middle School. American Educational Research Journal, 47(3), 633-662.
Watters, J. J. (2010). Career decision making among gifted students: The Mediation of teachers. Gifted Child Quarterly, 54(3), 222-238.
STUDY OF THE RELATIONSHIP BETWEEN ACADEMIC
PERFORMANCE AND SOCIOEDUCATIVE CLIMATES
IN GIFTED HIGH SCHOOL STUDENTS
JONATHAN VALLERAND, FRANÇOIS BOWEN AND MICHEL JANOSZ Université de Montréal
It is said that 15 to 40% of gifted students perform at levels below their potential (Seeley, 1994). In recent years, many researchers have looked into this phenomenon in an attempt to explain it. However, only one research team has looked into school climates for a part of the answer, while many researchers have found such a relationship amongst the non-gifted population. This study aims to look for a relationship between socioeducative climates, family environment and performance amongst gifted kids to fill this gap. In order to do this, a sample of 1,885 Grade 10 participants was taken from the previously created database of the
evaluation of Quebec’s SIAA program, and a path analysis was conducted to create a model of the effect of environments on the performance of gifted youth, through the mediation of motivation. The findings suggest that the impact of socioeducative and family environment on the performance of gifted students is minimal.
Keywords: gifted, underachievement, underachiever, socioeducative environment, socioeducative climate, family environment, performance
The idea that intellectually gifted students could academically underachieve is seen by many as a contradictory phenomenon. Nevertheless, gifted individuals seem to be more at risk of this gap between aptitude and performance than other students. In a review of literature, Seeley (1993) found that between 15 and 40 % of gifted students underachieve academically. According to Nation at Risk, a government-ordered report on American schools, over half of America’s gifted students’ school performance stands at a subpar level
when compared to their ability (National Commission on Excellence in Education, 1983). The only study of this sort led in Quebec identified that 16% of gifted high school students in the province are underachieving (Rivest, 2013). Furthermore, Richert (1991) estimates that all of these numbers, including Nation at Risk’s 50 %, are not high enough to truly represent the extent of this reality, due to problems in the process of identification that excludes gifted underachievers from the gifted label.
With these numbers in mind, it is not surprising that in recent years, many researchers from the field of giftedness have attempted to better understand it, in order to efficiently
intervene in such cases.
One of the fundamental pieces of the field was written by S. B. Rimm (1986), in which she groups the factors associated with gifted underachievement in three classes. The first, individual factors, includes school motivation, use of learning and studying strategies and the student’s reaction to the gifted label. The second, familial factors, includes the student’s family’s structure, situation and climate, in addition to parents’ behaviour. Finally, the third one, school factors, includes the content taught in class, the level of adaptation to the needs of the gifted, and peer pressure.
This third class, school factors, should, in our opinion, be subdivided into two
subcategories. The first would include the pedagogical aspect of school: content taught, teaching practices, and adaptation to students with special needs are some factors which would belong to this category. The second category, which we would name
“socioeducative factors”, would focus instead on the school’s climate, on the more social aspect of an educational establishment. Indeed, while numerous articles have suggested a relationship between these variables and students’ school performance in the general
population (Wang, 2010; Reiss, 2009; Renaud, 2009), few factors from this second category have been studied in the case of gifted underachievers.
In a comprehensive review of literature, Reis and McCoach (2000) presented only a single article which touched the subject of the relationship between gifted underachievement and socioeducative variables, that of Baker, Bridger et Evans (1998). The fact that only one article exists to document this relationship is in and of itself proof that further research is absolutely necessary. Furthermore, this article raises a few questions regarding its validity and its sample’s representativeness of the gifted underachiever population.
In their 1998 research, Baker, Bridger and Evans proposed three groups of variables meant to explain gifted underachievement, each of them representing one of Rimm’s three classes of factors (individual, family and school), in order to compare them and to determine how much of a role each one played in predicting underachievement in gifted students.
Each of these groups contained three variables. The variables related to school environment were the school’s academic quality, of the quality of the students’ relationship with their teachers, and of their relationship to their peers. If we divide this third group of variables in two categories (pedagogical and socioeducative), as we suggested doing with school variables in the previous paragraph, we can include the school’s academic quality in the pedagogical category, and the relationships with peers and teachers in the socioeducative. It is also important to discuss this research’s sample: participants were 56 students between grade 4 and 8. All were identified as gifted prior to being accepted in a gifted program, and all had “scores above the 90th percentile on standardized tests” (Baker et al., p.8), without specifying the standardized tests which were used. The students put in the underachiever group were those who were “at risk of academic failure or removal from gifted programs because of poor performance” (Baker et al., p.8).
According to their analyses, all 3 groups of variables were statistically significant indicators of gifted underachievement, with the individual factors being a slightly stronger indicator. However, in the case of the third group (school environment), not each variable was seen as significantly correlated to underachievement when analyzed individually: only the variable relating to the evaluation of the school’s academic quality was seen as significant, the two variables relating to interpersonal relationships (relationship with peers and relationship with teachers) being seen as non-significant. With our unofficial subdivision, this means that Baker, Bridger and Evans’ findings point towards the conclusion that the
socioeducative subgroup is statistically insignificant.
Even though it is often the single article cited to support the relationship between school environment and gifted underachievement, Baker, Bridger and Evans’ article presents many methodological limits which affect the generalizability of its findings: a problematic
sample, invalid variables and reducing groups of variables.
First, the sample studied in this research counts 56 gifted students, only 26 of which are underachievers. The authors themselves present their insufficient sample size as a limit of their research. Furthermore, the participants are considered as not representative of the entire range of possible problems related to gifted underachievement: one of the main factors for that, we believe, is the participants’ age. While the authors cite many researchers in their introduction who have suggested that gifted underachievement peaks in
adolescence, the subjects’ age ranged from 9 to 14 years old. With the speed at which teenagers evolve and change, differences between a sample consisting of students between 9 and 14 years of age, and another one consisting of students between 13 and 18 years of age will most likely be very important. Therefore, their sample is limited in how
(1993), adolescence and its consequences (be they physiological, psychological or social) are factors which increase a student’s disposition towards academic underachievement: a simple that has not yet reached these consequences will definitely yield different results. In addition to sampling problems, the study’s methodology leads us to believe that some information they gathered does not truly represent the variables they present in their groups of variables. One of the biggest reason leading us to this belief is the way in which
information regarding all three variables from the school groups of variable (relationship with peers and teacher and academic quality) was gathered: the researchers questioned the students’ parents, and used the parents’ perception as being representative of the announced variables. This limit, while announced in the article’s methodological section, is not
brought into the discussion of the results, which affects the validity of the data collected, affecting the validity of the results, and as such, their generalizability.
Finally, the authors used only three variables per groups of variable, which is an important reduction from the dozens of variables which have been linked to gifted underachievement in other studies, such as school motivation, self-efficacy, familial relationships, parental expectations, or sense of security or of belonging. However, despite the absence of numerous variables, the authors consider their groups of variables as representative of Rimm’s three classes. They even suggest that their results might mean that the individual class of factor is of greater importance than the other two, generalizing their results while having limited their analysis to three variables per class.
We can conclude that, because of its insufficient sample size, its data’s debatable validity, and the reduction of the three classes to only three variables each, the results presented in Baker, Bridger and Evans (1998) are not easily generalizable. As this research is often presented as the only one to explore the relationships between a gifted student’s perception
of its environment’s socioeducative climates and its school performance, it seems that this relationship is overlooked in research.
Concepts
Multiple concepts need to be clarified before going into the methodology of the study: giftedness, gifted underachievement and socioeducative environment are three concepts which will be defined in the following few pages.
Giftedness
A gifted individual, as defined by Legendre (1993), is a person presenting « aptitudes which are superior to that of an average person in one or more domains » (p. 398, author’s translation). As this definition outlines, there exists as many types of giftedness as there are aptitudes. However, despite the existence of multiple other types, the use of the term giftedness, unless otherwise specified, is usually used to refer to academic giftedness. Stankowski (1978, cited in(Davis & Rimm, 2003) presented 5 types of definitions of giftedness. The first was an a posteriori label of an individual whose influence and performance in their field was both exceptional and constant, without any objective measure necessary. The second type was the use of a cut-off score on an IQ test: for example, the Stanford-Binet defines a score superior to 135 as giftedness, but other researchers have also offered their own cut-off point. The third type is related to exceptional performance instead of ability. The fourth type is defined through creative ability. Finally, the last and most often used type is the definition of giftedness through the use of a standardized test, and with a cut-off score defined through comparison to other
participants and the scores’ percentile rank. The target rank varies between 80th and 99th according to the author (Davis & Rimm, 2003), with many researchers using the 95th percentile. On the other hand, Gagné (2007) supported the inclusion of students whose ability were over the 90th percentile in the “lightly gifted group”, and then defining other degrees of giftedness, each representing the higher 10% of the previous group.
Before Stankowski, Renzulli (1977) proposed the “three-ring definition” of giftedness. According to this researcher, giftedness could not be reduced to a single measure, and proposed three criteria: well-above average ability (whether general abilities, like intelligence, or specific abilities, like chemistry, or sculpture), high task commitment (enthusiasm, fascination, perseverance, and the setting of high standards for themselves, in a particular area), and high creativity (originality, but also adventurousness, openness to new ideas and willingness to take risks).
Gifted Underachievement
In 2000, Reis and McCoach published a review of the literature on the topic of gifted underachievement. Throughout this review, one of their objectives was to present a single, unified definition of gifted underachievement on which all researchers of the field could base their studies. After presenting different types of pre-existing definitions, they postulated this definition:
« Underachievers are students who exhibit a severe discrepancy between expected achievement (as measured by standardized achievement test scores or cognitive or intellectual ability assessments) and actual achievement (as measured by class grades and teacher evaluations). To be classified as an underachiever, the discrepancy
between expected and actual achievement must not be the direct result of a diagnosed learning disability and must persist over an extended period of time. Gifted
underachievers are underachievers who exhibit superior scores on measures of expected achievement (i.e., standardized achievement test scores or cognitive or intellectual ability assessments). » (p. 157)
Reis and McCoach’s definition suggests three nuances regarding gifted underachievement: (1) its exclusion of gifted students with a diagnosed learning disability (because, while their situation is unique and interesting, the study of such students is a field in and of itself, separate from that of underachieving gifted students), (2) the necessity of evaluating underachievement through comparison of actual results and expected results, and (3) its emphasis on academic performance. In this study attempting to explain the causes leading to gifted underachievement, the first step was to define what gifted underachievement truly is.
Despite their proposal for a universal definition, not all researchers agree to use the same type of methodological definition. Much like with giftedness, many different ways of identification of gifted underachievers have been used in the literature recently. Two, however, seem to see the most use: while both of these definitions label gifted students whose performance is inferior to a certain off point as underachievers, the way the cut-off point is defined is what changes. Many authors (Colangelo, Kerr, Christensen, &
Maxey, 1993; Hébert, 2001; Laffoon, Jenkins-Friedman, & Tollefson, 1989) decide to use a universal cut-off point, such as a C, or even the group’s average, which is then applied equally to all gifted students, regardless of their level of abilities. Furthermore, most of
these definitions use a very low cut-off point, only identifying students who are performing objectively poorly, regardless of their own ability, as underachievers.
The second type of definition, more in line with Reis and McCoach’s, defines a different cut-off point for each participant. By comparing the distribution of both aptitude and performance (using statistics such as the Z-score or the percentile ranks to compare them across different scales), they can identify students whose performance is inferior to their own aptitude. This has the advantage of including gifted students whose performance is still over average, yet still far below what they have the potential to reach. While more inclusive and in-line with the literary definition of underachievement, fewer authors use this type of definition (Lupart & Pyryt, 1996; Preckel, Holling, & Vock, 2006).
Socioeducative climates
The model of socioeducative environment which we will be using in this study is one which was developed by Janosz, Georges and Parent (1998). Janosz, Georges and Parent’s model is often used in Quebec to thoroughly understand the strengths and weaknesses of a school’s socioeducative environment. One of this model’s strengths is its focus on
participants’ perspectives, given that it is not the environment itself that truly affects students, but their feelings and perceptions of their environment. Another reason for selecting this model is the fact that it was developed specifically for Quebec schools. We believe that a locally-developed model was better suited for analysing Quebec students than a test developed for a different cultural background and translated into French.
According to them, the socioeducative environment is formed from multiple different aspects of the learning environment, all of which are deeply interconnected. First are the
independent variables: the school’s socioeconomical and socio-political conditions, its physical and organisational environment, and the characteristics of the learners and educators that form it. These variables are considered to be the basis of the environment, and they guide the decisions taken regarding the second tier variables, which we call “controllable variables”: these include pedagogical strategies and practices, the amount, quality and style of support offered, and school-family relationships. The choices taken on this tier will definitely have an effect on the third tier, the socioeducative environment’s climates, and the levels of performance, motivation, violence, indiscipline, and conflicts. While these are affected directly by both prior tiers, they cannot be directly controlled: school administrators and educators can only push the controllable variables towards what they believe will positively affect the third tier variables: how they actually react is, at the very least, hard to predict.
Janosz, Georges and Parent (1998) define the socioeducative environment’s climates as “the personality particular to a school environment through how this environment answers individual needs” (1998, p.288, author’s translation). This is affected by pedagogical practices employed in the environment and the socioeducative environment’s problems, whether social or academic. This “personality” of the environment is then seen through five different facets, which are the different climates.
According to Janosz, Georges and Parent (1998), a socioeducative environment contains five different climates: the relationship climate, the educative climate, the climate of security, the climate of justice, and the climate of belonging.
The first, the relationship climate, focuses on the interpersonal relationships happening within the environment. Of course, a school environment contains many types of relationships: between students, between teachers, between students and teachers, and
between teachers and principals. All of these relationships must be taken into account to better grasp the quality of the relationship climate in an environment, and evaluated through three criteria: warmth, respect, and supportiveness.
The second aspect is the educative climate, which represent the importance given to education in the environment, the perception of school as a setting for teaching and
learning. It is defined by the students’ devotion to success, the quality of the education, the focus on sensible learning, and the belief in education’s worth.
The climate of security is obviously related to the security level of the environment, but more importantly, to the feeling of security of its members, and their perception of the rarity of at-risk situations (violence, drug use, theft, intimidation). This climate’s
importance is linked to the difficulties associated with learning and teaching while feeling in danger.
The climate of justice designates a perception of the application of the rules, of the distribution of punishment and reinforcement, and of the academic evaluations as fair and equitable, linked to a person’s actions and not to the person herself. While it is true of all climates, it is particularly important here to remind the reader that what is significant is not how fair the environment actually is, but how fair its members all perceive it as being. The fifth climate, the climate of belonging, is defined as the creation of a relationship between the individual and the environment. It is identified by three aspects: a feeling of pride regarding the school one attends or works at, the importance it takes in these
individuals’ lives, and by identifying and applying the values promoted by the institution. This last climate is different from the four previous ones in that it is seen as a product of the interaction between these four previous climates.
Despite not using the term “climate” and not classifying them as Janosz, George and Parent did, authors Wang and Holcombe (2010) studied the relationship between the perception of one’s school environment and school performance in 1000 American students. These researchers found a correlation between certain perceptions and school performance. The variable that was most strongly correlated with school performance was the identification with the school, a large aspect of what Janosz, George and Parent name the climate of belonging.
Also in the same vein, a large amount of research has been conducted regarding the
relationship between teacher-student relationships and school motivation (Fortin, Plante, & Bradley, 2011; Rousseau, Deslandes, & Fournier, 2009; Valencia, 2010; Viau, 2009) or performance (Renaud, 2009). Viau (2009) also supports the impact on academic motivation that both a sense of security and a sense of belonging can have. The Center on Education Policy (2012) also states that all aspects of school environment are correlated with a student’s school motivation.
While the impact of all five climates on either motivation or performance is well-grounded in research, such a relationship has not been looked into for gifted students as a possible explanation for gifted underachievement.
It is as a solution to this lack of knowledge on the relationship between educative environment and underachievement in gifted students that this research was conducted. Through a multi-factorial approach which integrates the students’ perception of their school and family environments and their academic motivation, we aim to improve our collective understanding of the relationship between educative environment and underachievement in
gifted student and finally dig in what we believe is an often overlooked aspect of the problematic.
Family environment
Family environment is a complex concept, and through this study, we have limited it to five aspects: parental involvement in education, student’s communication with parents, family rules, parental supervision, and child-parent conflicts.
Parental involvement in education has been defined as the level of participation a parent has in their child’s education and schooling. This is indicated by communicating well with teachers, assisting with homework, volunteering in the classroom or on school trips, and understanding their child’s academic strengths and weaknesses (Steinberg et al., 1992). Researchers have concluded that parental involvement is positively correlated with multiple aspects of academic motivation: school engagement, perceived competence, perceived control, self-regulation, mastery-goal orientation, motivation to read (Gonzalez-DeHass, Willems, & Holbein, 2005), and a favorable attitude towards school (Trusty, 1996). Furthermore, it seems involved parents is positively correlated to a student’s school performance (Hoover-Dempsey & Sandler, 1997; Paulson, 1994; Steinberg, Lamborn, Dornbusch, & Darling, 1992; Trusty, 1996). Finally, it has been found that students whose parents are highly involved are less likely to drop out in high school (Rumberger et al., 1990). (Rumberger, Ghatak, Poulos, Ritter, & Dornbusch, 1990).
Student’s communication with parents is defined as the mutual level of communication between a student and their parents, particularly of communication of an emotional nature. It also includes a transparency of parenting decisions – that is, telling the child why these decisions were taken. Family rules, on the other hand, denote not the quality of
parent-imposed rules, but whether such rules exist and children are aware of them. This includes rules regarding bedtime, the amount of time that should be spent on homework and
studying or internet and video games, the circle of friends, the child’s finances, and whether the child can smoke or drink alcohol. Parental supervision denotes how informed the
parents are about their child’s whereabouts: where they are, who they are with, and what they do. Taken together, these last three variables seem rather representative of Baumrind’s authoritative parenting style (1973), which has been found to be correlated to school
success (Baumrind, 1991; Strage & Brandt, 1999), fewer problem behaviour (Maccoby, 1994), positive self-esteem (Klein, O'Bryant, & Hopkins, 1996), an internal locus of identity and psychosocial success (Marsiglia, Walczyk, Buboltz, & Griffith-Ross, 2007).
(Claes, 2004)
Child-parent conflicts are defined as “situations of confrontation which include use of either hurtful, negative language or threats, and leading to negative emotional impacts: frustration, anger, humiliation” (Claes, 2004, p.213, author’s translation). While conflict is usually a mutual confrontation, in parent-teenager relationships, they can very well be one-way, due to either the tacit acceptation of parental authority when the conflict is parent-only, or to maturity-level discrepancies or a desire for provocation when the conflict is child-only (Laursen & Collins, 1994). Research shows that conflict between a teenager and their parents is unavoidable (Cloutier & Groleau, 1987), due to the difference in goals and perception that teenagers and parents usually have.
With regards to goals, Smetana (1989) shows that while parents aim for socialization, convention and conformity, adolescents aim for personal affirmation and individualisation. As an example, Smetana presents the familiar situation of a parent who asks their teenage child to clean their room, because the family rule is that everyone in the house cleans their
own room; however, the teenager answers that what everybody else does is up to them, and that their room is not unclean, simply cleaned in a different way.
Research also supports the idea that parents and teenagers differ greatly in how they
perceive the amount and intensity of conflicts in their relationship. Robin and Foster (1989) found that the correlation rate of these perceptions was inferior to .50. Teenagers usually report a larger amount and impact of conflicts than parents do.
(Ormrod, Saklofske, Schwean, Harrison, & Andrews, 2006)
It is because numerous researchers have looked into the impact of parenting and family environment on a child’s motivation that we have included family environment variables into this research. Whether gifted students react the same way to such results has still not been looked into.
Motivation
Motivation is a highly researched topic in the field of education, and its relationship to academic performance is well established (Center on Education Policy, 2012; Gottfried, 1990; Shiefele, Krapp, & Winteler, 1992). Lack of school motivation has also been often presented through literature as one of the main causes of underachievement in gifted youth (Whitmore, 1986; Baker, Bridger & Evans, 1998; Reis & McCoach, 2000; Hébert & Schreiber, 2010). The model of motivation we are using for this study was developed by Monnard, Ntamakiliro, and Gurtner (1999) and is known as the “Multidimensional scale of motivation towards school learning” (author’s translation). From this model, five variables were kept: attribution, school attractiveness, perceived usefulness of school, self-efficacy, and willingness to learn.
Attribution is “the causal explanations for success and failure that students assign to the things that happen to them--their beliefs about what causes what. These causal attributions in turn guide their future behaviour” (Ormrod et al., 2006, p.239). Furthermore attribution is not necessarily representative of the true state of affairs: a student could blame his unsatisfactory grade on his math test to the fact that the exam was too hard, that the teacher doesn’t like him and that the explanations weren’t clear, while it is truly due to a lack of effort or skills. In general, students attribute successes to themselves (to their intelligence and effort, for example), while they blame their failures on external factors (such as their teacher, peers, or lack of luck) (Marsch, 1990).
Attribution is usually defined through three aspects: locus, stability and controllability. Locus (or place) refers to whether the student attributes events to internal or external causes, such as concluding that a test result is due to studying hard (internal) or the teacher liking you (external). Stability refers to how changing the perceived causes are, such as attributing school results to intelligence (stable, unchanging) compared to luck (unstable, changing). Finally, controllability refers to how much the student themselves can influence the cause, such as a bad test result being blamed on being sick (uncontrollable), compared to lack of sleep (controllable).
Students who attribute success and failure to internal and controllable causes have been found to be more prone to asking for help in classroom settings (Ames, 1983), to expend more effort in your studies, and to perform better academically (J. S. Eccles, 1983): if you believe that a student’s behaviour is the cause of their success, it is logical that you will be more inclined to put effort in your studies than if you believe luck is. On the other hand, attributing success to uncontrollable or external factors can lead to a state known as learned helplessness: the “general belief that one is incapable of accomplishing tasks and has little
or no control of the environment” (Ormrod et al., 2006, p.243), which has been found to be correlated to future failure (C. Peterson, 1990; Seligman, 1991).
School attractiveness represents a student’s interest towards school, which includes not only interest for learning and classes, but also the social aspect of schooling. On the other hand, perceived usefulness of school refers to the student’s perception that going to school will be beneficial to them in the future, whether for their future studies or career, or simply that they will use what they learnt in class. Research shows that these two variables seem to be inversely correlated with age: the older a student is, the less attracted to school they are, and the less useful they perceive it as being (Bouffard, 2005). (J. Eccles et al., 1989).
Self-efficacy is a person’s perception of their own capabilities in a particular situation or task. While it is somewhat related to self-concept (a person’s perception of the “quality” of their own person), self-efficacy is defined through specific tasks: for example, one may have high self-efficacy about basketball, but low self-efficacy about playing the guitar. Also, it is important to know that while the two are correlated, self-efficacy is not
necessarily on par with their actual capabilities: we all may think of at least one person who thinks of themselves as highly gifted in a field where they are very average, and of the frustrating opposite who believes they are incapable in a situation where they are, at worst, average. Students with high self-efficacy have been found to achieve more than those with low self-efficacy, even when controlling for actual ability levels (Eccles et al., 1989). Willingness to learn is what laymen (and probably many educators) probably define as school motivation: a student’s drive towards the acquisition of new knowledge. However, this does not necessarily mean more effort is being put out: as we’ve seen in this section, many other variables impact the amount of effort the student is willing to put into their studies. For example, a student with high willingness to learn, but who attributes success to
external, uncontrollable factors, would want to learn, but not understand that studying and hard work will lead him to that goal: as such, they might not do any of these things, and will seem unmotivated.
As we’ve seen in this section, motivation is a major piece of the education puzzle, but it is also more complex than simply identifying who is motivated, and who isn’t. Even looking at motivation through a spectrum, which accounts for the variation in between these two points, would be an oversimplification, because of its multi-faceted nature.
As we’ve seen, prior research has shown that multiple links exist between school
performance and both socioeducative climates and family environment. The objective of this study is to seek whether such relationships also exist in the case of gifted students. If it is the case, it could solve another piece of the puzzle of gifted underachievement.
Methodology
In order to reach our previously stated objectives, we must follow an empirical
methodology. This chapter will present the methodology we will be following throughout this study. First, we will present the characteristics of our sample. Second, we will present the four tools which were used to gather the data we will be analyzing. Last, we will discuss our analysis strategies for this study.
Participants
To answer our research question, we will analyse data previously gathered during the evaluation of Quebec’s SIAA program (Stratégie d’intervention Agir Autrement, or, in
English, Intervention strategy to act differently). First of all, we will briefly describe what the SIAA is, to then go to the participants of this study.
The SIAA is a policy from Quebec’s Ministère de l’Éducation, du Loisir et des Sports (Ministry of Education, Leisure and Sports, in English) aiming to improve the school success of students from lower socioeconomic status backgrounds. The 196 schools
targeted by the policy annually receive budgets totalling 125 million dollars, which help the schools to put in place policies which were tailored to their individual needs, as determined in each establishment by a committee of employees (Janosz et al., 2010).
To effectively evaluate the effects of the strategy, a team of researchers led a study on the subject (Janosz et al., 2010). During this study, the team gathered data, each year, from a sample of around 30,000 students and 4,000 employees from 70 Quebec high schools. Due to school fusions, this number was brought down to 66 schools during the duration of the study, a number representing 35% of the number of SIAA schools in Quebec. Furthermore, 11 non-SIAA schools were added to the sample as a control group.
Even though the original study wasn’t about gifted underachievement, it did include the battery of tests that our research requires, and a substantial sample size. Raven’s
Progressive Matrices, for example, were used as a control variable in the comparison of pre- and post-SIAA results. Because it includes all variables we needed to complete our analysis, we will conduct a secondary analysis of their data for this research.
The SIAA schools in the sample were randomly selected. However, in order to accurately represent the entirety of SIAA schools, the selection was made in order to maintain the population’s ratio with regards to the school’s teaching language, its size and its geographical situation. The first variable, teaching language, resulted into two groups: English and French. The second variable, size, knew three possible results: small (i.e. less
than 150 students), medium (i.e. between 150 and 499 students) or large (i.e. 500 students or more). Finally, the third variable, geographical situation, had three possible answers: rural, suburban, and urban (which only included school situated in Montreal, the
metropolis). It is also obvious that size and geographical situation are interrelated in our sample: indeed, we can see that almost all urban schools were considered to be of large size, while only one of the fourteen rural schools was. However, the authors of the original study assure us that this situation is also representative of the repartition in the entire population of SIAA schools. The eleven comparison schools were, however, not chosen through these same criteria, but were schools which volunteered for participation in the study.
Within these schools, students and employees alike were interviewed. In average, the research team had a 70% response rate, resulting in a sample averaging 30,000 students. This study used the data gathered from Secondary 3 (Grade 9) students, as literature suggests this is the age at which gifted underachievement starts rising more importantly, reaching a peak in prevalence in Secondary 5 (Grade 11, final grade of mandatory
education in Quebec) (Rivest, 2013). In order to maximize the number of participants who had undertaken all necessary tests, the participants we chose were all taken from the first year of the original study.
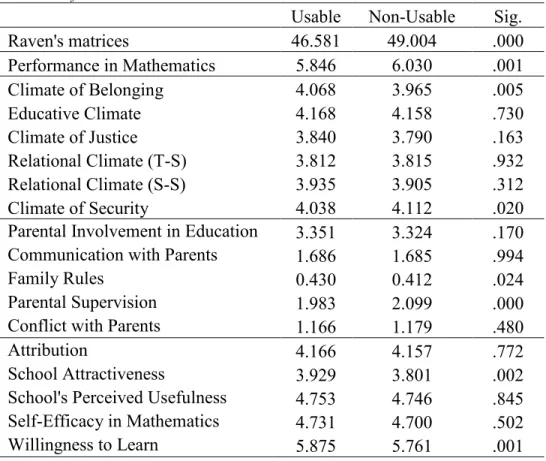
The initial sample of this research contained a total of 8125 participants. However, not all of those 8125 participants had completed both the Raven’s progressive matrices and the performance in mathematics test. Only 6039 had completed the intelligence test, only 2254 had completed the performance test, and, more importantly, only 1885 had completed both. This last group constitutes our usable sample, giving us an n=1885, an enormous loss of 6240 participants. In order to ensure our sample’s fidelity to the larger one, we conducted
analyses of variance of the students’ scores in all variables of interest to this study, which will be presented in the following section.
Our sample is unevenly divided between males and females by quite a large margin: 1023 participants were females (a number representing 54.3% of the sample), and 862 (45.7%) were males.
The sample is unevenly divided on the age front as well. This, however, is easily explained by the fact that all students in our sample are in Secondary 3, where students will usually be 14 or 15 years old (barring repeated or skipped years): as would be expected, 83.3% of participants are within this age range. 0.3% of participants are younger than 14 (all of them 13 years old), and 16.4% are older. It is impossible to know the age of the oldest student, as all ages over 17 years old were put in the “18 or older” category. If we were to consider these students to all be 18 years old, the average age would be 14.77 years old.
On Raven’s progressive matrices, the minimum score was 1, and the maximum 60,
covering the entire spectrum of possible scores. That perfect score was reached by 6 of our 1885 participants. The average score was 49, with a standard deviation of 6.34.
As we explained in the previous chapter, this last variable is the one we will use to create our gifted group, for which we selected all participants whose score is over the 90th percentile: in this case, a score of 56.
The gifted group contained 196 subjects, slightly over 10% of our complete sample (due to the fact that a score on Raven’s progressive matrices is a discreet variable), leaving 1689 non-gifted subjects. Of the 196 gifted subjects, 99 were males and 97 females, a more even distribution than that of the entire usable sample (as seen on table 1). We labeled 11.48% of male participants as gifted, and 9.48% of females.
The gifted group had an average age of 14.53 years old, a little younger than non-gifted participants who had an average age of 14.79 years old. 93.9% of gifted subjects were between 14 and 15 years old (the “normal” age range for Secondary 3 students), compared to 82.1% in the non-gifted subsample, which can probably be explained by the lower number of students who had to repeat a grade in the gifted group. Indeed, only 11 gifted participants were older than 15 years old, representing 5.6% of the subsample, compared to 17.7% in the non-gifted group.
Data gathering tools
For this study, four tools were used to gather the data we will be analysing: the
questionnaire on socioeducative environment (QES, after its French acronym), Raven’s matrices, the evaluation of school performance in mathematics, and the Psychosocial questionnaire. These three tools offered us our data: the QES offered a measure of the students’ perception of the socioeducative climate of their school; Raven’s matrices allowed us to identify the gifted students in ours ample; the evaluation of school
performance in mathematics allowed us to identify each students’ level of performance, and to categorize them as either high achiever or underachiever; the Psychosocial gave us data regarding the students’ motivation and family climate. This following section will present each of these three tools.
Questionnaire on Socioeducative Environment (QES)
The QES is largely used to measure students’ perception of their socioeducative
Bouthillier,(2007). It is a long questionnaire: the version used with students contained 166 questions, while those used with adults counted 208. The QES is divided in 4 sections: the first is about the identification variables of the participant; the second evaluates the
participant’s perception of their school’s socioeducative climate; the third measures their perception of the problems of their schools; finally, the fourth identifies the pedagogical practices perceived in the institution by the participant.
The QES’ second section, and the only one of interest to us, measures the participant’s perception of the different socioeducative climates: relational (between students, between students and adults, between employees, and between employees and administrators), educative, security, justice and belonging. Each of them is measure by four to six items of their perspective of their school, to answer on a six-level Likert scale. Examples of these questions are presented in Table 2.
The internal consistency of these scales, as measured through Cronbach’s alpha, were between .829 and .920. As such, these scales’ internal consistency can be considered good or even excellent.
Raven’s matrices
Raven’s matrices are an intelligence measurement tool, recognized as non-culturally biased, a rare feat in intelligence tests. It is, with Weschler’s scales, one of the most used
intelligence tests today (Larivée & Miranda, 2009). Raven’s matrices measure non-verbal intelligence as well as abstraction capacity through matrices which become progressively more complex (Sattler, 1988). The test’s fidelity is also impressive, with coefficients over 0.80, sometimes even reaching 0.90 (Larivée & Miranda, 2009). In addition to cultural
equity and fidelity, Raven’s matrices are also used for its ease of administration to large groups. It is this simplicity that allowed its use during the SIAA evaluation.
The most often used test, the progressive matrices test, contains 5 series of 12 items each, presented in increasing order of difficulty, and is taken in a 40 minute time frame. For each item, the subject is presented with an incomplete figure or pattern, for which they have to first understand the underlying logic, and then choose amongst the possible answers which one would better complete the figure or pattern. When scoring these tests, the corrector will go through answers and stop correcting after two errors from the participant. Each answer is then worth one point, allowing a maximum score of 60.
Usually, the results are then given a percentile rank which represents where the subject’s intellectual aptitudes rank amongst peers of their age. In this research’s case, the results were not standardized through the usual standardization tables, as they are adapted to the American standards, and not those of Quebec. We did however standardize their raw scores by comparing them to other students in our sample: this, we believe, was more representative of the Quebec environment our subjects evolved in. The results were standardized into both a percentile rank, to identify our gifted group, defined as those whose aptitude was at the 90th percentile or higher, and into a Z-score, for a closer comparison to the performance of students.
School performance in mathematics
In this study, we will use school performance in mathematics as a measure of school performance. This decision is not meant to be a judgement on the value of other school subjects, but rather due to the stronger link between what many would call