FROM RED TO GRAY
The “Third Transition” of
Aging Populations in
Eastern Europe and
the former Soviet Union
Mukesh Chawla Gordon Betcherman Arup Banerji with Anne M. Bakilana, Csaba Feher, Michael Mertaugh, Maria Laura Sanchez Puerta, Anita M. Schwartz, Lars Sondergaard, and Andrew Burns
©2007 The International Bank for Reconstruction and Development / The World Bank 1818 H Street NW Washington DC 20433 Telephone: 202-473-1000 Internet: www.worldbank.org E-mail: [email protected]
All rights reserved
1 2 3 4 10 09 08 07
This volume is a product of the staff of the International Bank for Reconstruction and Development / The World Bank. The findings, interpretations, and conclusions expressed in this volume do not necessarily reflect the views of the Executive Directors of The World Bank or the governments they represent.
The World Bank does not guarantee the accuracy of the data included in this work. The boundaries, colors, denominations, and other information shown on any map in this work do not imply any judge-ment on the part of The World Bank concerning the legal status of any territory or the endorsejudge-ment or acceptance of such boundaries.
Rights and Permissions
The material in this publication is copyrighted. Copying and / or transmitting portions or all of this work without permission may be a violation of applicable law. The International Bank for Reconstruction and Development / The World Bank encourages dissemination of its work and will normally grant permission to reproduce portions of the work promptly.
For permission to photocopy or reprint any part of this work, please send a request with complete information to the Copyright Clearance Center Inc., 222 Rosewood Drive, Danvers, MA 01923, USA; telephone: 978-750-8400; fax: 978-750-4470; Internet: www.copyright.com.
All other queries on rights and licenses, including subsidiary rights, should be addressed to the Office of the Publisher, The World Bank, 1818 H Street NW, Washington, DC 20433, USA; fax: 202-522-2422; e-mail: [email protected].
ISBN-10: 0-8213-7129-0 ISBN-13: 978-0-8213-7129-9 eISBN-10: 0-8213-7130-4 eISBN-13: 978-0-8213-7130-5 DOI: 10.1596/978-0-8213-7129-9
Cover photo: Tim Dirven/Panos
Cover design: Naylor Design, Washington, D.C.
Library of Congress Cataloging-in-Publication Data
Chawla, Mukesh.
From red to gray : the third transition of aging populations in Eastern Europe and the former Soviet Union / by Mukesh Chawla, Gordon Betcherman, and Arup Banerji.
p. cm.
Includes bibliographical references and index.
ISBN 978-0-8213-7129-9 (alk. paper)—ISBN 978-0-8213-7130-5
1. Older people—Europe, Eastern—Economic conditions. 2. Older people—Soviet Union— Economic conditions. 3. Population forecasting—Europe, Eastern. 4. Population forecasting— Soviet Union. I. Betcherman, Gordon. II. Banerji, Arup. III. Title.
HQ1064.E812C45 2007
v Foreword xix Acknowledgments xxiii Abbreviations xxv Overview 1 Introduction 1
Red to Gray: A Unique Demographic Transition 4
Red Light to Green Light: Growing Older Does
Not Have to Mean Growing Slower 13
Red Ink to Black Ink: Waging Sensible Policies
Can Ease Aging’s Spending Impact 21
Completing and Building on the Transitions:
The Different Paths Ahead 39
Notes 43
1. The Demographic Transition in Eastern Europe
and the Former Soviet Union 45
Introduction 45
The Global Demographic Transition 46
The Demographic Transition in Eastern Europe
and the Former Soviet Union, 1950–2000 49
vi Contents
Demographic Projections to 2025 55
Population Change and Dependency Rates 65
Two Distinct Demographic Profiles: Old Countries
and Young Countries 68
Conclusion 70
Notes 72
2. Demographic Change and Labor Markets 73
Introduction 73
Labor Force Projections 74
Implications of an Aging Labor Force for Labor
Market Outcomes 86
Aging and Labor Productivity 95
Policy Implications 102
Annex 2.A: ILO Labor Force Projection
Methodologies 105
Annex 2.B: Labor Force Participation Projections,
2005–20 107
Annex 2.C: Changes in Working-Age Population 110
Annex 2.D: Participation Rates in Countries
of the Region 111
Notes 114
3. Aging, Savings, and Financial Markets 117
Introduction 117
Aging and Saving Behavior 118
Aging and Financial Markets 131
Policy Implications 144
Annex 3.A: Gross Domestic Savings in Eastern
European and Former Soviet Countries 146
Annex 3.B: Selected Financial Sector Indicators 147
Notes 149
4. Aging and Pension Expenditures 151
Introduction 151
Current Pension Systems in Countries of
the Region 152
Projected Impact of Aging on Pension Spending 157
Prospects for Further Parametric Reform 163
Reform Options 166
5. Aging, Long-Term Care, and Public Expenditures 177
Introduction 177
Aging and Health Expenditures 179
Projections of Public Expenditures on Health 182
Long-Term Care 191
Policy Implications 199
Annex 5.A: Legislation on Long-Term Care
in Europe 207
Annex 5.B: Gross Domestic Product
and Public Expenditures on Health 207
Annex 5.C: Elderly Dependent Population 207
Annex 5.D: Sensitivity of Projection Results
to Data Assumptions 210
Notes 216
6. Aging and Education 217
Introduction 217
How Education Systems Have Changed
Since Transition 220
Impact of Projected Demographic Changes
on Enrollments 234
Improved Productivity through Better
Education Systems 242
Policy Implications 248
Annex 6.A: Aging and Education: Data Tables 251
Notes 259
References 263
Boxes
O.1 Demographic Projections 6
O.2 Pronatalist Policies in Europe 9
1.1 Key Definitions in Demography 47
1.2 Fertility Declines and Improvement in
Longevity in Selected Countries,
1950–2000 50
1.3 Demographic Projections 56
2.1 How Does Productivity Change with Age
for Different Tasks? 97
2.2 What Do Wage Trends Tell Us about
How Productivity Changes with Age? 98
viii Contents
3.1 Definitions of Saving Terms 120
3.2 When Can Aging Lead to Greater Savings? 121
3.3 What Role Does Cross-Border Capital
Mobility Have in Financial Markets? 132
3.4 Key Pension Fund Concepts 137
3.5 Aging and Asset Meltdown 142
4.1 Glossary of Pension Terms 153
6.1 How Are Education Systems Implicated
in the Process of Demographic Change? 219
6.2 Reforms Needed in Education Systems 227
6.3 Fundamental Problems with Current
Financing Formulas 230
Figures
O.1 The Region’s Different Mixes of Demographic
and Economic Transition 4
O.2 Most Countries in the Region Will Have
Significant Population Decreases Between
2000 and 2025 7
O.3 The Proportion of Population Aged 651 Will
be Much Higher by 2025 7
O.4 Countries Face Different Mixes of Demographic
and Economic Transition 13
O.5 In the Region, Labor Productivity Has Had
a Stronger Impact on Growth Than Aging
(1998–2005) 14
O.6 Financial Markets in Even the More Developed
Economies of the Region are Shallower Than
Those in Other OECD Countries 21
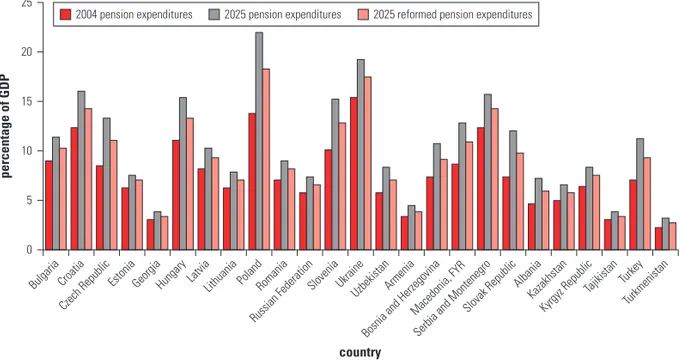
O.7 Pension Spending Would Rise Significantly
Because of the Aging Effect, But Can Be
Moderated by Reforms . . . 23
O.8 . . . Indeed, in Some Countries, Pension Reforms
Already Undertaken Will Moderate the Impact
of Aging 24
O.9 Retirement Ages Are Lower in the Region Than
in Higher-Income Countries 26
O.10 Modest Social Pensions Would Generally
be Affordable 29
O.11 Public Health Care Costs Are Likely to Rise Only Slightly in Most Aging Countries in the Region
by 2020 31
O.12 School-Age Populations Will Shrink in All
O.13 . . . But Improved Coverage Will Lead to Fast Growth in Secondary and Higher Enrollments
in Many Countries 37
1.1 Global Total Fertility Rates, 1950–2050 48
1.2 Global Life Expectancy, 1950–2050 49
1.3 Total Fertility Rates in Eastern Europe
and the Former Soviet Union, 1950–2000 51
1.4 Male Life Expectancy at Birth in Eastern Europe
and the Former Soviet Union, 1950–2000 52
1.5 Female Life Expectancy at Birth in Eastern
Europe and the Former Soviet Union,
1950–2000 52
1.6 Absolute and Relative Change in Population
Size in Selected European and Former
Soviet Countries, 1950–2000 54
1.7 Proportion of Population 65 Years and Older
in Eastern Europe and the Former Soviet
Union, 1950–2000 54
1.8 Median Age in Eastern Europe and the
Former Soviet Union, 1950–2000 55
1.9 Projected Fertility Rates in Selected Eastern
European and Former Soviet Countries,
2000–25 57
1.10 Projected Trends in Life Expectancy at Birth for Males in Eastern Europe and the Former
Soviet Union, 2000–25 59
1.11 Projected Trends in Life Expectancy at Birth for Females in Eastern Europe and the
Former Soviet Union, 2000–25 59
1.12 Population Growth Rates in Selected Eastern European and Former Soviet Countries,
2000–25 60
1.13 Projected Change in Population Size in Eastern Europe and the Former Soviet Union,
2000–25 61
1.14 Projected Change in the Population Share 65 Years and Older in Eastern Europe and
the Former Soviet Union, 2000–25 62
1.15 Projected Change in the Population Share 0–14 Years in Eastern Europe and the
Former Soviet Union, 2000–25 63
1.16 Projected Change in the Population Share 15–64 Years in Eastern Europe and the
x Contents
1.17 Projected Increases in Median Ages in
Eastern Europe and the Former Soviet Union,
2000–25 65
1.18 Child Dependency Rates in Eastern Europe
and the Former Soviet Union, 2000–25 66
1.19 Elderly Dependency Rates in Eastern Europe
and the Former Soviet Union, 2000–25 67
1.20 Total Dependency Rates in Eastern Europe
and the Former Soviet Union, 2000–25 67
1.21 Proportion of the Projected Population 65 Years and Older in 2025 and Percentage of Change in Population Size between 2000 and 2025 in
Eastern Europe and the Former Soviet Union 69
1.22 Population Age Structure of Bulgaria, 2000
and 2025 70
1.23 Population Age Structure of Tajikistan, 2000
and 2025 71
2.1 Relative and Absolute Changes in
Working-Age Population, 15–64 Years, Eastern European
and Former Soviet Countries, 2005–25 76
2.2 Immigration and Emigration Flows for Eastern
European and Former Soviet Subregions, Western Europe, North America, and Israel,
2000–03 83
2.3 Change in Male and Female Labor Force
Participation Rates for Older-Age Categories, Eastern European and Former Soviet Countries,
1980–2003 88
2.4 Participation Rates of Labor Force 50 to 64 Years
by Educational Attainment in Selected Eastern European and Former Soviet Countries,
Various Years 89
2.5 Marginal Effect of Age on Labor Force
Participation of Females in Selected Eastern European and Former Soviet Countries,
Various Years 89
2.6 Marginal Effect of Age on Labor Force
Participation of Males in Selected Eastern European and Former Soviet Countries,
Various Years 90
2.7 Marginal Effect of Age on Unemployment of
Females in Selected Eastern European and
2.8 Marginal Effect of Age on Unemployment of Males in Selected Eastern European and
Former Soviet Countries, Various Years 92
2.9 Informal Share of Wage Employment in
Selected Eastern European and Former Soviet
Countries, Various Years 93
2.10 Marginal Effect of Age on Weekly Hours of Employment for Females in Selected Eastern European and Former Soviet Countries,
Various Years 93
2.11 Marginal Effect of Age on Weekly Hours of Employment for Males in Selected Eastern European and Former Soviet Countries,
Various Years 94
2.12 Marginal Effect of Age on Wages for Females in Selected Eastern European and Former
Soviet Countries, Various Years 94
2.13 Marginal Effect of Age on Wages for Males in Selected Eastern European and Former Soviet
Countries, Various Years 95
2.14 Returns to Years of Education for Older and
Younger Cohorts in Selected Countries 102
2.A.1 ILO Estimates and Projections of the
Economically Active Population, 1980–2020 106
2.B.1 Labor Force Participation Projections under Different Scenarios, Kyrgyz Republic,
2005–20 107
2.B.2 Labor Force Participation Projections under
Different Scenarios, Turkey, 2005–20 108
2.B.3 Labor Force Participation Projections under
Different Scenarios, Bulgaria, 2005–20 108
2.B.4 Labor Force Participation Projections under
Different Scenarios, Czech Republic, 2005–20 109
2.B.5 Labor Force Participation Projections under
Different Scenarios, Poland, 2005–20 109
2.B.6 Labor Force Participation Projections under Different Scenarios, Russian, Federation,
2005–20 110
3.1 Conceptual View of the Possible Channels
from Aging to Saving and from Saving to
Investment and Growth 119
3.2 Age-Saving Profile Implied by the Life-Cycle
xii Contents
3.3 Comparisons of Saving Rates by Age Group,
Selected Industrial Countries, 1990s 122
3.4 Savings and Investment as a Percentage
of Gross National Income, Selected Eastern European and Former Soviet Countries,
1990–2002 125
3.5 Stock Market Capitalization as a Percentage
of GDP, Selected Eastern European and Former Soviet Countries and Selected OECD
Countries, 2004 133
3.6 Financial Assets of Institutional Investors as a
Percentage of GDP, Selected Eastern European and Former Soviet Countries and Selected
OECD Countries, 2004 135
3.7 Pensions Funds as a Percentage of Total
Financial Assets Held by Institutional Investors, Selected Eastern European and Former Soviet Countries and Selected OECD Countries, 2004 139
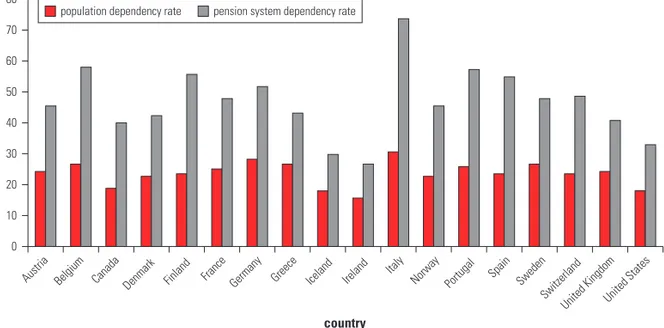
4.1 Old-Age Population Dependency Rates vs.
Pension System Dependency Rates in Eastern European and Former Soviet Countries, Most
Recent Year Available 154
4.2 Old-Age Population Dependency Rates vs.
Pension System Dependency Rates in Selected Non–Eastern European and Former Soviet
OECD Countries, Most Recent Year Available 155
4.3 Population Age 65 and Older and Per Capita
Income, 157 Countries Worldwide, 2003 155
4.4 Population Age 65 and Older and Per Capita
Income in Eastern European and Former
Soviet Countries, 2003 156
4.5 Pension Spending as a Percentage of GDP in
Selected Eastern European and Former Soviet
Countries, 2004 or Nearest Year 157
4.6 Pension Spending as a Percentage of GDP in
Eastern European and Former Soviet Countries, 2004, and Projections for 2025 Based on
Demographic Trends Alone 158
4.7 Pension Spending as a Percentage of GDP in
Eastern European and Former Soviet Countries, 2004, and Projections for 2025 Based on
4.8 Pension Spending as a Percentage of GDP, 2004, and 2025 Projections Derived from
Selected Countries’ Own Estimates 160
4.9 Pension Expenditures in 2004 and PROST
Projections for 2025 Based on Demographics and Existing Policy Reforms, Selected Eastern
European and Former Soviet Countries 161
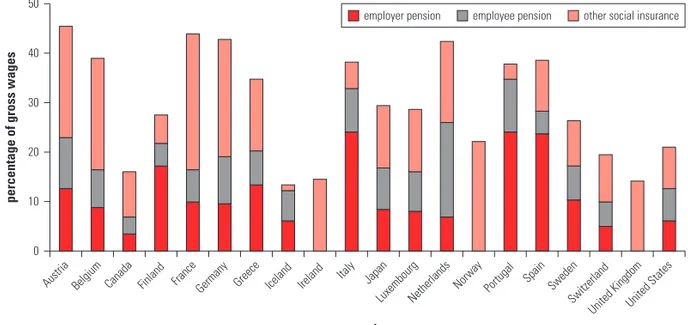
4.10 Labor Taxes as a Percentage of Gross Wages in Selected Eastern European and Former
Soviet Countries 162
4.11 Labor Taxes as a Percentage of Gross Wages in Selected Non–Eastern European and Former
Soviet OECD Countries 163
4.12 Fiscal Effects of Raising Retirement Age to 65 and Indexing Benefits to Inflation Only by 2025, Selected Eastern European and Former
Soviet Countries 166
5.1 Projected Public Spending on Health as a
Percentage of GDP under the Four Scenarios, Eastern European and Former Soviet
Countries, 2050 190
5.2 Elderly Dependent Population as a Percentage
of Total Population in Eastern European and Former Soviet Countries, 2005, and Projections for 2050 under the Pure Aging and Constant
Disability Scenarios 201
6.1 Change in School-Age Population, 0 to
17 years, Eastern European and Former
Soviet Benchmark Countries, 1989–2003 220
6.2 Evolution of Gross Enrollment Rates in Higher
Education in Eastern European and Former
Soviet Benchmark Countries, 1989–2004 221
6.3 Evolution of Gross Enrollment Rates in
Preschool Education in Eastern European and Former Soviet Benchmark Countries,
1989–2004 222
6.4 Evolution of Gross Enrollment Rates in
Primary Education in Eastern European and Former Soviet Benchmark Countries,
1989–2004 223
6.5 Evolution of Gross Enrollment Rates in
xiv Contents
and Former Soviet Benchmark Countries,
1989–2004 224
6.6 Learning Achievement and Fiscal Effort in
Education for Selected Eastern European and Former Soviet Countries Participating
in 2003 TIMSS Assessment 233
6.7 Public Expenditure on Education and Change
in School-Age Population in Selected Eastern European and Former Soviet Countries,
1989–2004 234
6.8 Change in Projected School-Age Population
by Level of Education in Eastern European
and Former Soviet Countries, 2005–25 235
6.9 Change in Projected Enrollments by Level of
Education in Eastern European and Former
Soviet Countries, 2005–25 237
6.10 Actual and Projected Trends in the School-Age
Population in Uzbekistan, 2000–25 239
6.11 Participation of Adults in Education and
Training in Selected EU Countries, 2005 246
Tables
O.1 By 2025, Many More Countries in the Region
Will Have Their Population Shrink Rather
Than Rise 5
O.2 Labor Force Participation 50–64 and Old-Age
Dependency, 2005–20 17
O.3 Uses and Sources of Funds: Selected OECD
Countries and Eastern European and Former
Soviet Countries 19
1.1 Projected Population Gains and Losses in Eastern
Europe and the Former Soviet Union, 2000–25 61
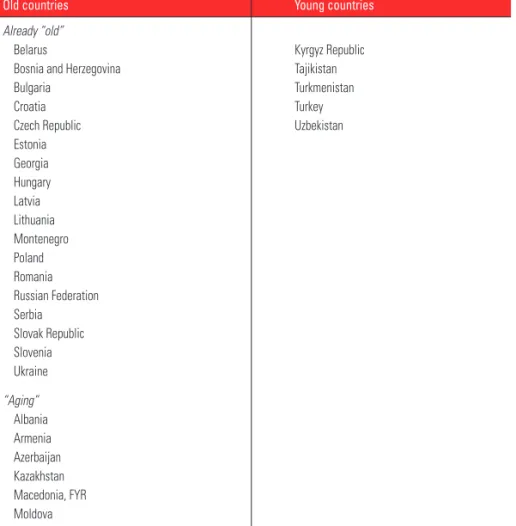
1.2 Old and Young Countries in Eastern Europe
and the Former Soviet Union 68
2.1 Classification of Eastern European and Former
Soviet Countries by Old-Age Dependency Projections and Current Labor Force
Participation of Older Workers 77
2.2 Projected Changes in Working-Age Population
in Eastern European and Former Soviet
Countries, 2005–20 78
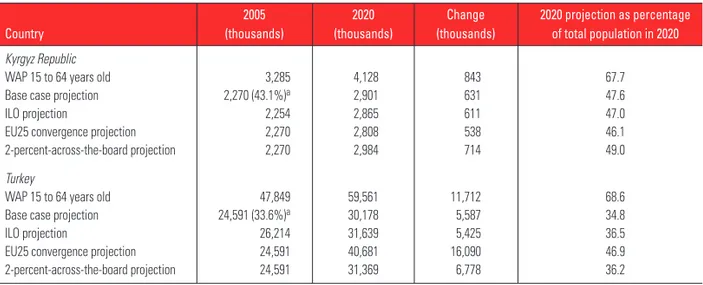
2.3 Participation Rates by Age Groups in Projection
2.4 Labor Force Projections for Two Young Countries
under Different Scenarios, 2005 and 2020 80
2.5 Labor Force Projections for Four Old Countries
under Different Scenarios, 2005 and 2020 81
2.6 Results of Projection Exercise to Estimate Net
Migration Needs by 2020 in Four Old Countries 85
2.7 Means (Standard Deviations) of Participation
Rates for People 50 Years and Older, Eastern European and Former Soviet and Non–Eastern European and Former Soviet OECD Countries,
1980 and 2003 87
2.8 Mean Age of Labor Force Entry and Exit in
Selected Eastern European and Former Soviet Countries and Non–Eastern European and
Former Soviet OECD Countries, 2000 87
2.9 Unemployment Rates by Age in Selected
Eastern European and Former Soviet Countries 91 2.10 Labor Market Reform Agenda for Aging
Countries by Country Grouping 103
2.C Changes in Working-Age Population, 15 to
64 Years, in Eastern Europe and the Former
Soviet Union, 2005–20 110
2.D.1 Participation Rates for Females 50 Years
and Older, 1980 and 2003 111
2.D.2 Participation Rates for Males 50 Years
and Older, 1980 and 2003 112
2.D.3 Changes in Participation Rates for Population
50 Years and Older, 1980 and 2003 113
3.1 Estimates of Determinants of Household and
Private Saving Rates: Panel Regression Results 127
3.2 Uses and Sources of Funds, Selected Industrial
Countries, Selected Years 129
3.3 Uses and Sources of Funds, Selected Eastern
European and Former Soviet Countries,
Selected Years 130
3.4 Benefit to Eastern European and Former
Soviet Countries from Offsetting Factors 130
3.5 Classification of Eastern European and Former
Soviet Countries According to the Relative and Absolute Significance of Their Financial
Markets 133
3.6 Reform Agenda for Aging Countries by
xvi Contents
3.A.1 Gross Domestic Saving in Eastern European
and Former Soviet Countries 147
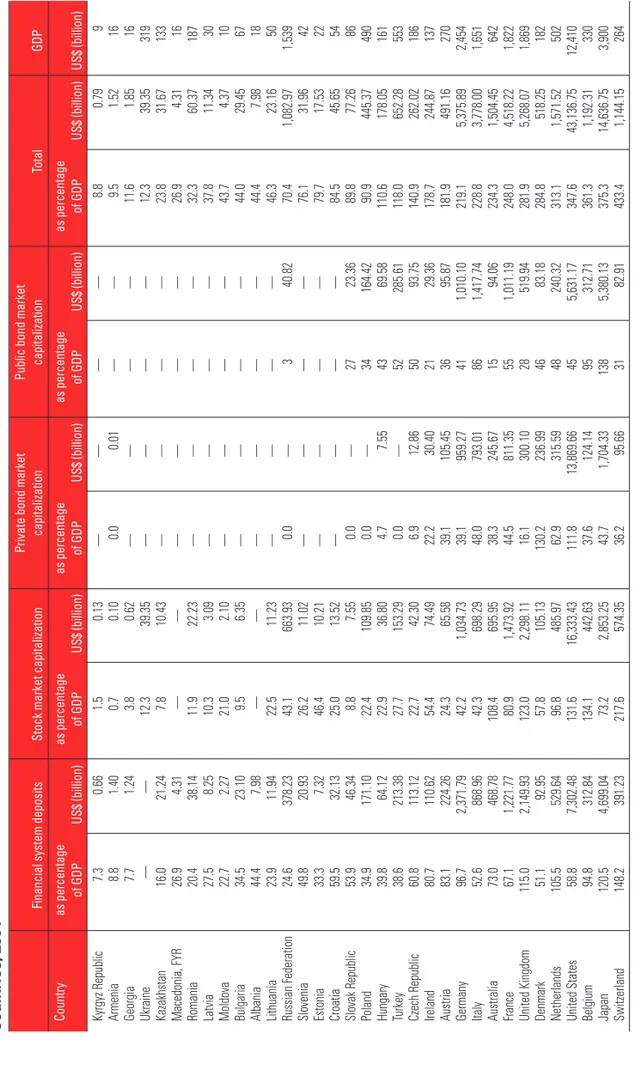
3.B.1 Selected Financial Sector Indicators for Eastern European and Former Soviet and Selected Non–Eastern European and Former Soviet
OECD Countries, 2004 148
4.1 Statutory Retirement Ages in Selected Eastern
European and Former Soviet Countries 164
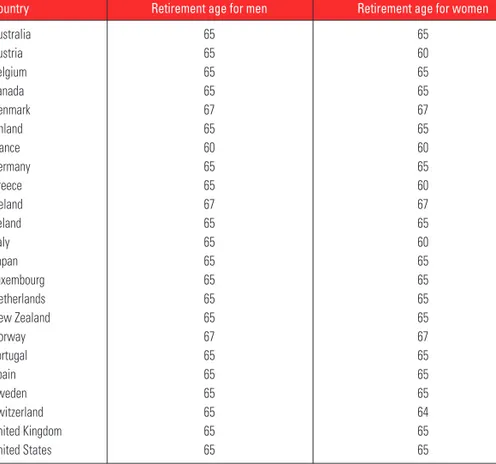
4.2 Statutory Retirement Ages in Selected
Non–Eastern European and Former Soviet
OECD Countries 165
4.3 Cost in 2005 and 2025 of a Social Pension
Equivalent to 10 Percent of Per Capita GDP in Selected Eastern European and Former
Soviet Countries 170
4.4 Status of Mandatory Funded Systems, Selected
Eastern European and Former Soviet Countries 172
4.5 Pension Reform Agenda for Aging Countries
by Country Grouping 174
5.1 Projected Health Expenditures under the Pure
Aging Scenario in Eastern European and
Former Soviet Countries, 2005–50 186
5.2 Projected Health Expenditures under the
Constant Morbidity Scenario in Eastern European and Former Soviet Countries,
2005–50 187
5.3 Projected Health Expenditures under the
Compressed Morbidity Scenario in Eastern European and Former Soviet Countries,
2005–50 188
5.4 Projected Health Expenditures under the Pure
Aging Scenario, Adjusted for Death-Related Costs in Eastern European and Former Soviet
Countries, 2005–50 189
5.5 Funding for Elderly/Long-Term Care in
Selected European Countries 194
5.6 Projections of Elderly Dependent Population
under the Pure Aging Scenario in Eastern
European and Former Soviet Countries, 2050 199
5.7 Projections of Elderly Dependent Population
under the Constant Disability Scenario in Eastern European and Former Soviet
5.A.1 National Legislation on Long-Term Care
in Selected European Countries 208
5.B.1 GDP and Public Expenditures on Health in Eastern European and Former Soviet
Countries, 2004 210
5.C.1 Estimates of Elderly Dependent Population,
2005 211 5.C.2 Estimates of Elderly Dependent Population
under the Pure Aging Scenario in Eastern European and Former Soviet Countries,
2025 212
5.C.3 Estimates of Elderly Dependent Population under the Constant Disability Scenario in Eastern European and Former Soviet
Countries, 2025 213
5.D.1 Projection Results as Percentage of GDP under the Pure Aging Scenario in Selected Eastern European and Former Soviet Countries, 2010–50: Economic Policy
Committee Report 215
5.D.2 Projection Results as Percentage of GDP under the Pure Aging Scenario in Selected Eastern European and Former Soviet Countries,
2010–50: from Table 5.2 215
5.D.3 Projected Annual Growth of GDP in Selected Eastern European and Former Soviet
Countries, 2010–50 215
6.1 TIMSS Grade 8 Student Assessment Results
for Math and Science for Participating Eastern European and Former Soviet
Countries, 1995, 1999, and 2003 232
6.2 A Composite Formula for Education Finance 240
6.3 The Role of Education in the Stages of
Economic Development 243
6.4 Selected Population and Education Parameters
by Country Grouping 250
6.5 Education Reform Agenda for Aging
Countries by Country Grouping 251
6.A.1 Change in 0 to 17 Year Population,
1989–2004; Gross Enrollment Rates in 2004; and Change in Gross Enrollment Rates, 1989–2004, Eastern European and
xviii Enhancing Job Opportunities: Eastern Europe and the Former Soviet Union
6.A.2 Change in Student-Teacher Ratios for Primary Education in Eastern European and Former
Soviet Countries, 1989–2004 253
6.A.3 Change in GDP and Public Expenditures on Education in Eastern European and Former
Soviet Countries, 1989–2004 254
6.A.4 Projected Change in School-Age Population by Level of Education in Eastern European
and Former Soviet Countries, 2005–25 255
6.A.5 Gross Enrollment Rates for Eastern European
and Former Soviet Countries, 2004 256
6.A.6 Shrinkage of School-Age Population, 1990–2000, and Change in Projected
Enrollments by Level of Education, in Eastern European and Former Soviet Countries,
2005–25 257
6.A.7 Country Rankings in Mean Scores of 15-Year-Old Students in OECD PISA
Assessment, 2000 and 2003 258
6.A.8 PISA 2000 Results: Mean Mathematical
Literacy Scores and Score Gradient Attributable
xix
Foreword
After the historical political transitions in the early 1990s, and signif-icant economic transitions over the 1990s until now, the countries of Central, Southeastern, and Eastern Europe and the former Soviet Union are experiencing a demographic transition—one that will greatly impact their polities, economies, and societies over the next two decades and beyond. This “third transition” is marked by rapid aging and shrinking populations in 20 countries of the region and sig-nificantly “graying” populations in all the transition countries and Turkey. Over the next two decades, the share and number of elderly will continue to rise; by 2025, one person in every five in most of the region’s countries will be over the age of 65.
Recently, the region has seen great economic and political achievement—such as the current economic resurgence that has reduced the number of the poor by about 57 million between 1998–99 and 2005, and the integration of 10 Central, Southeastern, and Baltic European transition countries with the European Union. There is concern, however, that the impact of aging populations will undermine this record of success, by putting at risk economic growth and fiscal sustainability in the near future—because this demographic transition in Eastern Europe and the former Soviet Union is different
xx Foreword
from that being experienced by the wealthier aging countries of Western Europe and East Asia.
The difference is the overlap with the yet incomplete economic transition. All of the region’s countries (except Turkey) face the lin-gering effects of the legacy of institutional disintegration that marked the transition. And all the countries, while experiencing rapid aging, remain immersed in the process of developing and strengthening the institutions needed for sustaining a market economy and developing the legitimacy of the state.
Will savings and investment in these economies decrease with aging? Will smaller populations translate to fewer participants in the labor force, thus lowering the rate of growth? Will the economies become fiscally unsustainable as public expenditures on pensions and health increase rapidly, and public revenues are constrained follow-ing an economic slow-down?
This report, From Red to Gray: The “Third Transition” of Aging Popula-tions in Eastern Europe and the Former Soviet Union, focuses on the
chal-lenges that the region’s aging countries will now face in having to deal with these multiple transitions. It argues that their task ahead, though uniquely daunting, is by no means impossible. Indeed, many of the potential problems can be addressed through sensible and thoughtful policies that can be enacted over the next few years. The only danger likely lies in complacency, in not being proactive in addressing the challenges.
This report finds, first, that some of the concerns about aging in Eastern European and Former Soviet countries are probably mis-placed. For example, growth is unlikely to be significantly lowered by dwindling labor forces—if policies that promote greater labor force participation and, especially, greater labor productivity are adopted. The greatest positive impact can probably come from a combination of three factors: creating a business environment conducive to enter-prise restructuring and innovation, investing in measures such as life-long learning to increase the productivity and employment of aging workers in addition to bringing hitherto idle youth and adults into the workplace, and allowing migration of workers from the “younger” countries in and around the region.
Second, the analysis in the report validates concerns about future fiscal strains in some of the region’s aging countries, but finds that many of the drivers of higher future public expenditures are unre-lated to aging. For example, high future public health care expendi-tures projected for many of the European countries of the region are more due to rising pharmaceutical and technological costs rather than
just aging populations. But there is certainly going to be higher pub-lic spending in many countries due to large pension obligations and because of the imperative to provide long-term care to an increasing number of aging disabled. Therefore, there is an immediate need to create the space for increasing public expenditures in those areas, both by reprioritizing within the existing fiscal envelope and by devis-ing appropriate policy measures in some areas—such as enactdevis-ing parametric pension reforms to ensure sustainability in the face of mounting pension spending, and designing appropriate policies to assure effective and efficient long-term care for the elderly.
Aging populations loom large for the transition countries that have recently acceded to the European Union. Latvia, for example, is expected to lose 13 percent of its population between 2000 and 2025, and Hungary about 8 percent. But these countries have also pro-ceeded further along many dimensions of the economic transition, and most have adopted significant reforms in financial markets, enterprise restructuring, pension systems and health care. They are thus well positioned to cope with their “grayer” futures, but only if they continue and deepen their reforms in the decades ahead.
The largest challenges will be faced by many of the countries of former Yugoslavia and of the Western and Southwestern parts of the Commonwealth of Independent States (CIS). They are aging rapidly—both Bosnia and Herzegovina and Azerbaijan, for instance, could see the proportion of their populations over age 65 double between 2000 and 2025, and Ukraine is projected to lose a quarter of its population over the same period. These are also the countries that have come late to reforms, and most are still in the midst of the eco-nomic transition process. This group of countries will need rapid reforms to both strengthen the institutions for sustained growth and deal with the specific challenges posed by population aging.
Rapidly aging populations, of course, are not as great an issue in some of the region’s countries—Tajikistan’s population is, for instance, projected to grow by over 40 percent between 2000 and 2025, and Turkey and Uzbekistan together will have gained an estimated 31 mil-lion people, equal to the population losses in Romania, Russia, and Ukraine combined over the same period. But even for these “younger” countries such as Turkey and those in Central Asia, the increased pro-portion of the elderly will still necessitate far-sighted reforms in pen-sion systems, health care, and financial markets.
This report—a part of the World Bank’s Europe and Central Asia Region series of regional studies—is intended as a contribution to the World Bank’s goal to work more effectively with clients and partners
xxii Foreword
in the region to reduce poverty, foster economic growth, and support social inclusion. It complements past reports onEnhancing Job Oppor-tunities, which examines in greater detail the evolution of labor
mar-kets over the transition period, andMigration and Remittances, which
examines one of the possible antidotes to the labor shortages in some countries. A forthcoming report, The Path to Prosperity, will delve
deeper into issues of productivity, which may be the other major way for aging countries to continue sustaining their growth trajectories.
But this report is particularly focused on the future—a future in the region that is critically dependent on actions that countries and societies take now, and over the next few years. I hope that this report, and the others in the series, will contribute to our under-standing of the underlying dynamics of the economies of Eastern Europe and the former Soviet Union, and help to provide the under-pinnings for the actions needed for these countries to complete their many transitions and to proceed on the path to prosperity.
Shigeo Katsu Vice President Europe and Central Asia Region
xxiii
Acknowledgments
This report was prepared by a team led by Mukesh Chawla, Gordon Betcherman, and Arup Banerji, who were also the main authors, and comprising Anne Bakilana, Csaba Feher, Michael Mertaugh, Maria Laura Sanchez Puerta, Anita Schwarz, and Lars Sondergaard. It also draws on inputs from Andrew Burns, Ramón Gómez-Salvador, Gauresh Shailesh Rajadhyaksha, and Jan van Ours. Research assis-tance was provided by Stefania Rodica Cnobloch, Nandini Krishnan, Silvia Prina, Pietro Rizza, Elena Rydvalova, and Rezeda Zakirova. Svetlana Raykova coordinated all administrative aspects of the project.
This work was supported by Pradeep Mitra, Chief Economist of the Europe and Central Asia Region of the World Bank, who provided essential guidance throughout its implementation. The team also would like to recognize suggestions and comments received from Asad Alam, Tito Boeri, Barbara Bruns, Eduard Bos, Paloma Anos Casero, Annette Dixon, Hans Dubois, Armin Fidler, Bernard Funck, Charles Griffin, Robert Holzmann, Carlos Felipe Jaramillo, Sanjay Kathuria, Lawrence Kotlikoff, Arvo Kuddo, Ali Mansoor, Kate McCollom, Fernando Montes-Negret, Roberto Rocha, Halsey Rogers, Richard Saltman, Willem van Eeghen, Milan Vodopivec, Hermann von Gersdorff, Andrew Vorkink, and Ruslan Yemtsov. Very helpful
xxiv Acknowledgments
comments were also provided by Giuseppe Carone, Declan Costello, Gilles Mourre, Bartosz Przywara, and Aino Salomaki of the Direc-torate General for Economic and Financial Affairs at the European Commission.
The team also benefited from comments and suggestions received from participants at workshops at the World Bank, Ankara, Turkey, and Ljubljana, Slovenia.
The World Bank Office of the Publisher coordinated the book design, editing, and production. Mary Fisk was the production editor; Paola Scalabrin was the acquisitions editor, and Andrés Meneses was responsible for printing. Bruce Ross-Larson provided editing services for the overview manuscript as well as advice on key messages. Vesna Kostic coordinated the launch and dissemination plans.
xxv
Abbreviations
AADL advanced activities of daily living ADL activities of daily living
AIDS acquired immune deficiency syndrome BADL basic activities of daily living
CIS Commonwealth of Independent States EAPEP Economically Active Population Estimates
and Projections (database) EPC Economic Policy Committee
EU European Union
G7 Group of Seven
GDP gross domestic product HBS Household Budget Survey HIV human immunodeficiency virus IADL instrumental activities of daily living ILO International Labour Organization IMF International Monetary Fund
KILM Key Indicators of the Labor Market (database) LSMS Living Standards Measurement Survey MTHS Multitopic Household Survey
xxvi Abbreviations
OECD Organisation for Economic Co-operation and Development
PAYG pay-as-you-go (system)
PISA Programme for International Student Assessment PPP purchasing power parity
PROST Pension Reform Options Simulation Toolkit RLMS Russian Living Measurement Survey
SHARE Survey of Health, Aging, and Retirement in Europe TFR total fertility rate
TIMSS Trends in International Mathematics and Science Study
UN United Nations
1
Age is opportunity no less than youth itself.
—Henry Wadsworth Longfellow (1807–82)
Introduction
The countries of Eastern Europe and the former Soviet Union are experiencing a third transition, a transition that overlaps with their recent political and economic transitions. In 2025, more than one in five Bulgarians will be more than 65 years old—up from just 13 per-cent in 1990. Ukraine’s population will shrink by a fifth between the years 2000 and 2025. And the average Slovene will be 47.4 years old in 2025—among the oldest in the world.
This third transition—from red to gray—is unique. Populations have been aging quite rapidly in many countries; by 2010, populations will start decreasing in such industrial countries as France, Italy, and Japan. Yet the unique conjunction of rapidly aging and relatively poor populations exists only in this region. Indeed, between 2000 and 2005, the only countries in the world with population declines of more than 5,000 people were 16 countries in Eastern Europe and the former Soviet Union—led by the Russian Federation, Ukraine, Romania,
2 From Red to Gray
Belarus, and Bulgaria. No aging country is as poor as Georgia—set to lose 800,000 people over the next two decades and with a per capita gross national income of just US$1,060 in 2004. And no other coun-tries in the world face the dual challenges of a rapidly aging population and an incomplete transition to mature market institutions to deal with the adverse economic consequences of aging.
This report examines the possible impact of this third transition. It analyzes projections and policy outlooks for a whole range of issues, from labor markets to pension policies, from health care to savings and capital markets. It concludes that although aging in the region is
occur-ring in the context of unprecedentedly weak institutional development, coun-tries can avoid severe economic consequences if they accelerate their economic transition and undertake longer-term policies to meet the aging challenge.
The report sends two central messages, which are analyzed against the different patterns of aging across the region:
• Red light to green light: Growing older does not have to mean growing slower. Aging is not a stop sign for growth—if countries enact policies that boost productivity and labor force participation.
• Red ink to black ink: Waging sensible policies can ease aging’s spending impact. The policies needed to manage much of the expected jump in public spending—especially the impacts on pensions and on health care—are well known. They need only to be enacted and implemented.
Red Light to Green Light: Growing Older Does Not Have to Mean Growing Slower
Empirical evidence based on historical data from around the world does suggest a strong and negative relationship between aging and domestic saving rates. However, this evidence cannot be applied eas-ily to aging Eastern European countries. For all but a few of the new European Union (EU) members in Central Europe, demographic-induced drops in savings will be offset by higher incomes from the early years of rapid growth—and by the ability of firms to use inter-national financial markets for their investment needs.
Nor is the threat of shrinking labor supplies as populations age a given. Straightforward policy interventions can raise the relatively low labor force participation in most of the region. However, two other fac-tors are critical. Most important, quantity shortfalls can be more than covered by increases in labor productivity—especially if education sys-tems move to more flexible lifelong learning models, if investments in new technology and other complementary factors of production are
not constrained by low foreign or domestic savings, and if enterprise restructuring allows for labor and capital to continue to shift to new and more productive forms and sectors. And, if politics permit, short-ages in the quantity of labor can easily be offset by migration within the region—much as today’s migrants from Central European EU mem-bers are providing skills needed in some Western European countries.
Red Ink to Black Ink: Waging Sensible Policies Can Ease Aging’s Spending Impact
Many of the region’s countries are, indeed, likely to face significantly higher expenditures in health care, elderly care, and public pension payments. But this report argues that three factors can mitigate the impact of aging. First, the direct impact of aging on total expenditures in health is low, with many of the cost drivers in health coming from technological factors that are independent of aging. Second, aging also reduces demand for public expenditures on education, as cohorts shrink and the large share of education in most national budgets cre-ates the potential for offsetting fiscal savings. Third, most countries have the time, over two decades, to institute proactive reforms that rationalize the structure of and demand for health care, flexible poli-cies to address long-term care for the infirm aged, and pension reforms that provide sufficient income in retirement while making pension systems sustainable.
The danger lies in complacency. The blow from aging will be sharpest if policy makers are not proactive or far sighted enough to implement the expenditure reforms whose general outlines are known today.
The region has vastly different patterns of aging, but also vastly dif-ferent paces of adjustment within the “second” (economic) transi-tion. Top-heavy public hospitals and inherited pension systems that pair generous coverage with small tax bases strain public expendi-tures. Subsidized enterprises that hoard unproductive workers and education systems that are unable to teach flexible, market-oriented skills lack the nimbleness to boost worker productivity. And despite the political openness brought about by the “first” (political) transi-tion, institutions are not yet sufficiently mature in many countries to make the hard choices for the longer run.
The speed of the aging and the breadth and depth of the institu-tional transformation will determine how easily different economies cope. This report outlines the complex challenges facing countries in three groups (figure O.1):
• Young, late reformers. The young, late reformers include the four poorer
4 From Red to Gray
and Uzbekistan. They will still have growing populations over the
next two decades. They face significant policy challenges, but they have made a later transition to mature market institutions.
• Aging, early reformers. The aging, early reformers include the
10 transition countries that recently joined the European Union, as well as Albania and Croatia. Aging rapidly, they are fairly advanced in
reforming their economic institutions. If they continue the pace of their reforms, they are well placed to meet the emerging challenges. • Aging, late reformers. The aging, late reformers are the remaining
former Soviet nations, as well as many countries in the western Balkans.
They face the greatest threat from aging—not just because of their demographic shifts, but also because their reforms are not on pace to help mitigate the effects of aging.
Red to Gray: A Unique Demographic Transition
The populations of all Eastern European and former Soviet countries grew over the past 50 years, but most of them will shrink between 2000 and 2025 (table O.1). This demographic transition is part of the global demographic trend toward longer life expectancy and lower
FIGURE O.1
The Region’s Different Mixes of Demographic and Economic Transition
Sources: World Bank staff calculations, based on United Nations 2005 and EBRD 2006.
Note: Turkey, although part of the region, is excluded because of the absence of data on the transition index. EBRD ⫽ European Bank for Reconstruction and Development. The new EU members are Bulgaria, Czech Republic, Estonia, Hungary, Latvia, Lithuania, Poland, Romania, the Slovak Republic, and Slovenia.
At the time of publication, separate figures were often not available for Serbia and for Montenegro. In such cases, throughout the publication, the aggregated data are given.
EBRD ⫽ European Bank for Reconstruction and Development. 0 10 20 30 4 3 2 1
EBRD transition index, 2006 Aging, late reformers: Armenia; Azerbaijan; Belarus;
Bosnia and Herzegovina; Georgia; Kazakhstan; Macedonia, FYR; Moldova; Montenegro; the Russian Federation; Serbia; and Ukraine p rojected p ropo rtio n of pop u latio n 65 ⫹ yea rs, 2025 (%)
Young, late reformers: The Kyrgyz Republic, Tajikistan,
Turkmenistan, and Uzbekistan
Aging, early reformers:
Albania, Croatia, and the new EU members
fertility—and the resulting shift toward population structures domi-nated by old people rather than young. The pace of aging naturally varies for countries and regions. The most dramatic aging worldwide has already occurred, but aging is expected to continue in those coun-tries that for decades have had fertility rates below replacement lev-els, such as Japan and the countries of Western Europe. The median age of populations in Europe will increase from 38 today to 49 in 2050, over 20 years more than the median age in Africa. Spain—with half its population older than 55 by 2050—will be the oldest country in the world, followed closely by Italy and Austria, where the median age is projected to be 54 (box O.1).
But the fastest aging countries over the next two decades will be in those of Eastern Europe and the former Soviet Union, the result of unprecedented declines in fertility and rising life expectancies. This region (not including Turkey) is projected to see its total population shrink by about 23.5 million. The largest absolute declines will be in Russia, followed by Ukraine and Romania. The Kyrgyz Republic, Tajikistan, Turkmenistan, and Uzbekistan, as well as Albania and Turkey, will still have growing populations. For most other countries in the region, the projected changes in absolute population size are expected to be less pronounced.
TABLE O.1
By 2025, Many More Countries in the Region Will Have Their Population Shrink Rather Than Rise
Population gained (millions) Population lost (millions)
Turkey 22.3 Russian Federation 17.3
Uzbekistan 9.3 Ukraine 11.8
Tajikistan 2.6 Romania 2.3
Turkmenistan 1.6 Poland 1.6
Azerbaijan 1.5 Bulgaria 1.5
Kyrgyz Republic 1.3 Belarus 1.4
Albania 0.4 Georgia 0.8
Macedonia, FYR 0.1 Hungary 0.8
Czech Republic 0.5
Lithuania 0.4
Latvia 0.3
Moldova 0.3
Serbia and Montenegro 0.3
Kazakhstan 0.3
Croatia 0.2
Armenia 0.2
Estonia 0.1
Slovak Republic 0.1
Bosnia and Herzegovina 0.1
Slovenia 0.1
6 From Red to Gray
The impact of the population decline will be much larger in some of the smaller countries, which will lose a significant share of their populations over the next two decades (figure O.2). Latvia (2.3 mil-lion people) and Lithuania (3.4 milmil-lion) will lose more than a tenth of their populations. Poland will lose 1.6 million, or about 4 percent of its 38 million people.
The economic impact of these changes will be felt most through the rising proportion of the elderly—those age 65 and older. Most countries had old-age shares (which we define here as the percentage of the population older than 65) of less than 15 percent in 2000; the exceptions were Bulgaria, Croatia, and Estonia. But this mark will be exceeded by 2025 in all but seven transition economies and Turkey (figure O.3). The largest increases (8 percent or more) are expected to occur in countries that already have older populations, such as the Czech Republic, Poland, and Slovenia. Bosnia and Herzegovina will see the fastest increase, with its elderly dependency ratio almost dou-bling. For nine countries, between one fifth and one quarter of the population will be 65 and older by 2025—comparable to the situation in Italy, where the proportion is projected to be about 26 percent.
As populations become dominated by older people, median ages are projected to continue to rise, even for countries (mostly in Central Asia and in Turkey) that still have fertility rates above replacement levels. Between 2000 and 2025, countries that already have median ages over 35 years (half the countries in the region) are projected to see
BOX O.1
Demographic Projections
Population projections used in this study are drawn from theWorld Population Prospects: The 2004 Revision, produced by the Population Division of the United Nations Department of Economic and Social Affairs. The 2004 revisions were the latest projections available while this report was being prepared. In March 2007, the United Nations released an updated 2006 revision.
All population projections begin with an existing population structure and apply to it fertility and survival rates determined according to assumptions about future trends in fertility and mortality. In this sense, therefore, demographic projections are conditional statements about the future, given a set of assumptions about the key population flow variables (fertility, mortality, and, to a lesser extent, migration). The United Nations projections deal with the uncertainty of population projections by producing four projections (variants) that are based on different scenarios of low, medium, high, or constant fertility. For this report, the medium variant projections have been used.
FIGURE O.2
Most Countries in the Region Will Have Significant Population Decreases Between 2000 and 2025
Source: World Bank staff calculations, based on United Nations 2005. –30 –20 –25 –24 –18 –17 –14 –13 –12 –11 –10 –9 –8 –7 –6 –5 –5 –4 –4 –3 –3 –2 –2 2 14 18 27 33 35 38 42 –15 –10 –5 0 country 10 5 15 20 30 25 40 35 45
UkraineBulgariaGeorgiaBelarus Latvia
Russian Federation LithuaniaRomania EstoniaHun gary Mol dova Armenia Cro atia Czech R
epublicSloveniaPoland
Serbia and MontenegroBosnia and Herzegovina
Slovak Republic Kazakhstan Macedonia, FYR Albania Azerbaijan Kyrgyz Republic Turkey Turkme nistan UzbekistanTajikistan per cen
tage of change in popula
tion
FIGURE O.3
The Proportion of Population Aged 65ⴙ Will be Much Higher by 2025
Source: World Bank staff calculations, based on United Nations 2005. 0 10 5 15 20 25
TajikistanUzbekistan
Turkme nistan Kyrgyz Re
public Turkey
AzerbaijanKazakhstanAlbaniaMoldovaArmenia
Macedonia, FYR Russian Feder ation Belarus Serbi a and Montenegro Geo rgia Romania Slovak Republic LithuaniaEstoniaUkraine
Bosnia and Herzegovina
Poland LatviaHungaryBulgar ia
Czech R
epublicCroatiaSlovenia
pe rce n tage of pop u latio n country 2000 2025
8 From Red to Gray
even further increases, to as high as 47 years in the Czech Republic and Slovenia, approaching Italy’s median of 50 years. Even Tajikistan— with a low median age of 18—will see its median age rise to about 26 because of slowly declining fertility rates and improvements in longevity.
Several of the countries are aging in ways similar to Western Europe and Eastern Asia. Fertility rates have been below replacement levels since the mid-1970s for most of the industrial world, and the same trend is expected for the region’s eastern neighbors, including China (but excluding Afghanistan). Life expectancies in the region are also increasing—though today’s industrial countries have longer life expectancies. For instance, Japan will have a life expectancy for women of about age 82 by 2025, about 6 years more than the highest projected for Eastern Europe and the former Soviet countries (in Croatia, the Czech Republic, and Slovenia). Old-age shares are also comparable for some countries in the region and their richer neighbors: Slovenia, for example, will see its over-65 population grow from 14 percent in 2000 to about 23 percent in 2025, falling between projections for the United Kingdom (20 percent) and for Italy (26 percent).
At the other end of the spectrum, Kazakhstan, the Kyrgyz Republic, Tajikistan, Turkmenistan, and Uzbekistan will look more like India, where about 8 percent of the population is projected to be 65 and older by 2025. The projected median ages for Bulgaria, the Czech Republic, and Slovenia will be closest to projections for Japan and Italy, which may have the world’s oldest populations. For most of the region, the projected median ages (between 40 and 45) are comparable with those in Ireland and the United Kingdom (42).
Governments in a number of countries in the region have attempted to mitigate these aging trajectories by introducing various “pronatalist” incentives. Some examples are shown in box O.2, along with a wider range of initiatives that have been implemented in Western European countries.
The economic impact of the demographic transition will be quali-tatively different—and felt more strongly—in the Eastern European and former Soviet countries than in aging countries elsewhere in the world. The region’s aging process is proceeding at a pace not seen before for such a diverse group of countries. The population share over 65 years of age will almost double in Bosnia and Herzegovina between 2000 and 2025 and will grow by more than 60 percent in such diverse countries as Albania, Azerbaijan, the Czech Republic, Kazakhstan, the former Yugoslav Republic of Macedonia, Moldova, Poland, the Slovak Republic, and Slovenia (see figure O.3). Strikingly,
BOX O.2
Pronatalist Policies in Europe
In many countries that have reached low levels of fertility, governments have initiated pronatal-ist policies to encourage higher birth rates. Their success depends, of course, on whether they counteract the actual factors that contributed to the significant declines in fertility in the first place. The number of children a woman or a couple decides to have is a result of a complex mix of factors, including cost of bringing up children, opportunities for women’s participation in higher education and employment, household economic status, marital status (including divorce and cohabitation), and degree of compatibility of work with child care.
Examples of pronatalist incentives in Europe are shown in the table below.
Examples of Incentives that Could Encourage Child Bearing
Total fertility
Country Incentives that could encourage childbearing rate, 2005
France Mothers receive 16 weeks unpaid leave for the first and second children
and 26 weeks for the third. Subsidies are provided for families with
3 or more children. 1.90
Germany Mothers receive 14 weeks leave, with parental leave up to 36 months.
Limited child care centers are available. 1.37
Ireland Mothers get 26 weeks of leave. Fathers get 14 weeks of leave. 1.99
Italy A one-off payment of €1,000 is available for the second child. 1.33
Norway Mothers receive 12 months off work with 80 percent pay or 10 months off
work with 100 percent pay. Fathers must take 4 weeks of leave 1.81
Poland Legislation is in process that would pay women for each new birth (€258, and
poor women receive double). The government plans to increase housing stock. 1.78
Russian Federation Maternity hospitals are free, and pregnant women get free vitamins and
iron supplements. 1.30
Sweden The government pays for 18 months of paid maternity leave. Subsidized day care
and flexible and reduced work hours are also available. 1.75
United Kingdom Mothers receive 6 months of paid leave and optional 6 months’ unpaid leave
after that. Free early education centers are available. 1.74
France is an interesting case for considering the effect of pronatalist policies, both because of its long history of interventions in this area and because of recent increases in the birth rate. In-deed, France has encouraged couples to have larger families for a long time, partly because some regions were among the earliest in Europe to experience fertility transition. The first paid maternity leave was introduced in 1913, and the Family Code was drafted in the late 1930s. The pronatalist interventions that France has offered include maternity leave, benefits for children, family allowances, a single-parent allowance, an adoption allowance, and larger housing for larger families. Couples enjoy some of the most generous maternity and paternity leaves in Europe: all women workers are entitled to a paid, job-protected maternity leave of 6 weeks before and 10 weeks after birth for the first two children. In addition, after maternity leave expires, parents
10 From Red to Gray
in the Czech Republic, Poland, the Slovak Republic, and Slovenia, this rapid growth will be from old-age shares that are already high—above 10 percent in 2000.
The other major difference from the more industrial aging coun-tries is in the unprecedented interaction of the demographic transi-tion with the comprehensive economic and (to an extent) political transitions still under way in most of the region. It is the interaction of the three transitions that makes the region unique.
Most social and economic implications of aging are universal, but Eastern European and former Soviet countries have only just started to come to grips with the political and economic transitions of the past two decades. They now face yet another structural transformation as their demographics change. The dissolution of the Soviet Union in 1991 was punctuated by a political transition from communism to democracy and by an economic transition from centrally planned to market economies. Although almost all the countries have completed
BOX O.2
(continued )
can take leave until the child reaches age three with entitlement to reintegration into the work-place. France has one of the largest networks of public child care facilities, providing full day care beginning at age two or three. A third-child policy pays more than for the first two children. During 1995 to 1998, France spent about 2.3 percent of its gross domestic product on family benefits.
Nonetheless, projections suggest that cohort fertility in France continues on a downward trend and that the 1970 cohort (which still has to complete fertility) will have completed fertility of 1.98 children per woman. This decline in cohort fertility is not unique, by any means, in Europe. Al-though France does have comparatively higher period and cohort fertility than some other Euro-pean countries, there is not sufficient evidence of the effect of family policies; even if these poli-cies have had an effect on fertility, they have not been effective enough in raising fertility above the replacement level of about 2.1 children per woman.
The conclusion is consistent with the weight of consensus among demographers that the effect of transfer-based pronatalist policies is negligible. Some authors have commented that, for such policies to be effective, countries will have to adopt a more comprehensive menu with a mix of family and social policies that could be quite costly and complex to implement. This is because the usual monetary transfers or tax breaks are too low to cover the full costs of having and rais-ing children to adulthood and are usually seen as temporary measures by parents and potential parents. For such policies to have a more significant impact on reproductive choices, they need to combine financial options with work and family incentives (McDonald 2000).
the political transition, if to different extents, much remains to be done in several key dimensions of the economic transition.
Even after several years of economic growth since 2000, countries in the region are still at very low levels of income and institutional development. In Ukraine, which is likely to lose the largest share of its population over the next two decades, incomes are barely above US$6,000 per capita in terms of purchasing power parity (PPP), on par with countries such as Algeria and the República Bolivariana de Venezuela. Georgia, another country hit hard by the demographic transition, has a PPP per capita income of just over US$1,000—in the same league as Mozambique or Rwanda. Even the richest economies in Central Europe substantially lag behind neighboring aging indus-trial neighbors such as Austria and Italy in terms of income and insti-tutional maturity.
Economic growth in the first decade of the transition was generally stronger in countries that made more vigorous economic reforms: • Following the initial economic collapse that affected the whole
region, the Central European and Baltic countries recovered rap-idly, pursued deep and pervasive market reforms, and pushed through integration with the European Union. Their challenge now is to further improve the business climate; address corruption and weaknesses in governance; maintain fiscal discipline and bal-ance; and find solutions for their unsustainable health, social secu-rity, and pension systems—the lack of which is exacerbated by their aging populations.
• Countries of the western Balkans experienced a disintegration that was significantly more violent and catastrophic than elsewhere in the region, but they are recovering and are beginning to integrate with the rest of Europe. They are still going through normaliza-tion, even as they prepare for EU integration.
• Reform in the former Soviet countries has generally been slow. Some—such as Belarus and Turkmenistan—have not implemented meaningful economic reforms and are much further behind. Coun-tries in the Caucasus have not fared well either, though recently there have been positive signs. Russia and Kazakhstan recovered rapidly from the initial disintegration and are looking to consoli-date their positions, with mineral-led growth greatly helping their fortunes.
• Turkey, though not a postcommunist state, has been going through its own transition since the 2001 financial crisis, which was preceded by uneven economic development through the
12 From Red to Gray
1990s. Privatization, banking and public sector reforms, social security reforms, and tight monetary and fiscal policies are at the core of its bold economic reforms. These changes are accompanied by a host of political and social reforms as the country progresses toward closer integration with the European Union.
Even for the most advanced among the region’s countries, there are wide variations in the degree of the structural transformation across their economies, and accordingly, a significant agenda remains for economic reforms. For example, Slovenia, acknowledged to be among the most successful of the transition economies, is still hob-bled by a relatively poor business environment, marked by a low-quality investment law and an inefficient transactions law (EBRD 2006). Eight of the region’s countries—including the Czech Republic, Kazakhstan, FYR Macedonia, and Russia—maintain some form of control on the inflow of direct investment. And 15 countries limit land tradability.
Broader institutional development is also progressing slowly. The quality of insolvency laws is poor in such aging countries as Georgia, Hungary, Latvia, Lithuania, Slovenia, and Ukraine. Enterprise restruc-turing is a major item remaining on the agenda—by 2006, only the eight Central European members of the EU (excluding Bulgaria and Romania) had progressed significantly on this front. Large restructuring agendas remain in aging countries such as Bosnia and Herzegovina, Georgia, Moldova, Kazakhstan, Russia, Serbia, and Ukraine.
Most of the countries, except the four Central Asian republics, will have significant old-age shares (over 10 percent) by 2025 (figure O.4). In Belarus, Bulgaria, and Estonia, this ratio will not change greatly in the next two decades: much of the aging has already happened there. In other countries, however, the relative growth in the elderly popu-lation will be significant.
The policy challenge is that only a dozen countries—the 10 new EU countries, Croatia, and (marginally) Albania, all with potentially significant old-age shares—have achieved significant progress in eco-nomic transition (indicated in figure O.4 by a score 3 or above on a scale of 1 to 4+ on a European Bank for Reconstruction and Develop-ment index). At the other extreme are the four Central Asian republics—the Kyrgyz Republic, Tajikistan, Turkmenistan, and Uzbekistan. Although they have not made significant progress toward market institutions, they have less demographic pressure because of the relative youthfulness of their populations over the next two decades. The countries facing the greatest challenge are those in the top left quadrant of figure O.4, primarily those from the former Soviet
Union and the western Balkans. They have aging populations, a sig-nificant demographic overhang, often a growing pool of aged citizens, and incomplete market institutions for weathering the shock.
Red Light to Green Light: Growing Older Does Not Have
to Mean Growing Slower
Will the changing demographics in the region mean a halt to eco-nomic growth, because older populations have shrinking labor forces and save less, with negative consequences for investment and capital accumulation? Conventional wisdom argues yes. But this report does not find convincing evidence to support such doomsday predictions, which fail to consider the characteristics of today’s transition economies—as demographic changes in these countries work their way to affect economic growth through at least three channels: labor and productivity, consumption and savings, and financial markets.
The Changing Labor Market and the Role of Productivity As output growth depends on the supply and productivity of labor, the primary macroeconomic implication of aging is less economic growth, because it will lower the expansion of the pool of available
FIGURE O.4
Countries Face Different Mixes of Demographic and Economic Transition
Source: World Bank staff calculations, based on United Nations 2005.
Note: Bubble sizes show the change in the 65 and over population share between 2000 and 2025. The new EU members are Bulgaria, Czech Republic, Estonia, Hungary, Latvia, Lithuania, Poland, Romania, the Slovak Republic, and Slovenia. At the time of publication, separate figures were often not available for Serbia and for Montenegro. In such cases, throughout the publication, the aggregated data are given.
EBRD ⫽ European Bank for Reconstruction and Development. 0 10 20 30 4 3 2 1
EBRD transition index, 2006 Armenia; Azerbaijan; Belarus; Bosnia and Herzegovina; Georgia; Kazakhstan; Macedonia, FYR; Moldova; Montenegro; the Russian Federation; Serbia; and Ukraine
p rojected p ropo rtio n of pop u latio n 65 ⫹ yea rs, 2025 (%)
The Kyrgyz Republic, Tajikistan, Turkmenistan, and Uzbekistan
Albania, Croatia, and the new EU members
14 From Red to Gray
working-age individuals, other things being equal. For a given capital stock, a decline in the labor supply implies capital deepening that is “undesired” from the perspective of firms, which will respond by investing less. In labor markets, the reality is more complex and less demographically deterministic than conventional wisdom suggests. Although the region’s aggregate labor supply will decline over the next 15 years, the declines will generally be modest. The greatest challenge will be for countries that will have large declines in their working-age populations but already have high participation rates.
But changes in labor markets are not immutably determined by demographic legacies. First, productivity improvements are the core predictor of growth, so measures taken to improve labor productivity would swamp any quantity effects of smaller labor forces. In fact, growth decomposition exercises show that in most of the region’s coun-tries in recent years, the growth in labor productivity has been the sin-gle greatest contributor to increases in per capita income (figure O.5). Second, the impact of aging on the labor supply can be at least partially offset by increases in the low labor force participation rates. Third, if political resistance is overcome, intraregional migration from younger countries can augment the labor forces of the aging countries.
FIGURE O.5
In the Region, Labor productivity Has Had a Stronger Impact on Growth Than Aging (1998–2005)
Source: World Bank forthcoming a.
Note: GDP ⫽ gross domestic product. GDP/employment measures labor productivity, employment/working-age population measures the employment rate, and working-age population/population is a proxy for aging. All data are from 2005, except data for Albania and Kazakhstan, which are for 2004.
⫺15 0 ⫺5 ⫺10 5 10 15 Turkey
AzerbaijanKazakhstan Albania Moldov
a Russian Federation Armenia Belarus Czech Republic Georgi a Romania Slovak Re public Lithua nia Estonia Ukraine Poland Latvia Hungary Bulgar ia Macedonia, FYR Croatia Slovenia pe rce n t country GDP/employment employment/working-age population working-age population/population GDP/population