Student: Pierre-Yves FESTOC (n°28 763) Supervisor: Pr Christophe PÉRIGNON Program: GE – MIF
Year: 2013-2014
Lending Club – P2P Lending
Impact Of Loan Description On Loan Performance
ABSTRACT
Lending Club (LC) is a US Peer-to-Peer lending company acting as a loan originator and a web platform between borrowers and investors. Our research paper constitutes a first-of-its-kind analysis of Lending Club’s database, as we wondered whether loan description had an impact on loan performance.
To that end, we conducted a three-step analysis. First, we determined how accurate Lending Club was in assessing its customers’ creditworthiness. Second, we analyzed loan performance following several description-based criteria. Finally, we assessed the statistical significance of these criteria.
Our study shows that there is no impact of loan description on loan performance, the latter being almost entirely explained by the rating. Thus, a loan picking strategy based on description is void of sense.
Introduction
Purpose of our paper
“Efforts and courage are not enough without purpose and direction.”
John F. KENNEDY
Studying the whole crowdfunding industry was never our intention, as it is the subject of plethora of articles at the moment. We wanted to drill down into this trendy phenomenon so as to determine a matter that could be scientifically approached.
The first step was to define which part of the crowdfunding industry we would focus on. As discussed later, there are several sorts of crowdfunding: donation-based, reward-based, equity-based and loan-based – interestingly, people generally know the first two / people are usually familiar with the first two only. We decided to focus either on equity-based or on loan-based crowdfunding, for their financial interest, and because it was more likely we would find data. This was when Professor PERIGNON told me about Lending Club, a Peer2Peer company founded several years ago by Renaud LAPLANCHE (MBA HEC).
We were relatively impressed by how transparent Lending Club was regarding to its data policy: from its website, everyone can download detailed reports on the company’s activity. We then knew we would do something with this very valuable data, but many had already thought about it before us. As a matter of fact, there are several websites or blogs that already offer an analysis of Lending Club’s database, rather focusing on straightforward metrics like ongoing return on investment. As a matter of fact, none of these websites analysed loan description data, which contains all comments added by borrowers when applying for a loan. As this field of study seemed to be left behind – scientifically speaking –, we decided to focus our research paper on it, so as to make a difference with several initiatives on the internet which have not conducted the scientific and statistical approach that we have.
One will easily understand that a loan description can contain very insightful information on the applicant borrower who filled it in. Indeed, a lending process with Lending Club (alongside
its competitors) is very crucial to a borrower as it is a chance for him/her to get a lower rate than with high street banks. Consequently, we gathered that loan description would be done conscientiously. We were inspired by Tetlock’s work on interactions between the media and the stock market, based on daily content from the Wall Street Journal (Tetlock, 2007). Following his work, we wanted to study loan descriptions at Lending Club, so as to determine whether they had a financial translation in loan performance.
This topic is much talked-about on the internet, where Lending Club investors brag about their recipes for avoiding bad loans – meaning loans that are more likely to default. However, despite its popularity amongst investors, this topic has never been the subject of a scientific paper... until now. The fact that investors look for additional parameters to guide their investment is not new. In Asset Management theory, it is referred to as stock picking investment strategy, so as to beat the market.
Throughout this study, we demonstrate that loan descriptions – following several parameters – have no impact on loan performance. Put another way, we will prove that loan picking strategies following description-based criteria are void of any sense, meaning that investors can invest regardless of descriptions.
Literature Review
“Reading furnishes the mind only with materials of knowledge; it is thinking that makes what we read ours.”
John LOCKE
The literature scope of crowdfunding is huge and is growing faster every day, due to the trendiness of this phenomenon now taking the shape of a proper, regulated industry. However, we will not refer to this accumulated literature here, as the purpose of our paper is more specific.
Strictly speaking, there is no scientific literature linked to our subject; not to say that there is no existing literature on loan description impacting the performance of Lending Club’s loans, but all the initiatives we came across were not scientifically conducted. That being said, we would like first to mention the several websites that analyse Lending Club data, and second the sole serious initiative that has been made regarding loan description impact.
According to Interest Radar Blog in its online article Description Level (September, 3rd, 2012): “you can find endless advice about what to avoid in the text: bad spelling, mismatching information, contradictions with the credit report, lack of explanations, low drive to defend the need for money”. The thing is that none of these blogs offer a scientific way to think about this topic (loan description), except a few ones, of which Peter RENTON’s online publication Loan Descriptions – Can They Be Helpful When Choosing Loans? (Renton, 2010).
Peter RENTON looked for a correlation between the length of the loan description and the rate of default. His first finding was that loans with no description at all / without any description showed a lower rate of default than loan with description. However, he realized that this phenomenon was mainly due to the fact that loan without descriptions had been issued more recently, hence decreasing their likelihood of having defaulted.
As a consequence, Peter RENTON decided to narrow the set of data to recent loans only, so that there would not be such a gap of maturity between loans with or without description. His revised finding was that no-description loans showed default rates slightly higher than the
entire population. Therefore, the author concluded that loans without description could be avoided when picking loans following a description-based strategy.
This paper was quite interesting for us who were totally new to P2P lending, especially the potential impact of current loans in the analysis. That being said, there are some material flaws to Peter RENTON’s demonstration. Indeed, in order to assess the sole impact of description on performance, we have to isolate other parameters like rating, maturity and sector.
In a nutshell, with all due respect, Peter RENTON does not address the topic with the scientific approach it requires. Hence, his conclusions are void.
Structure of our Paper
Even though the scope of our analysis is linked to the crowdfunding phenomenon, it will not be much referred to in our research paper. Indeed, we would like to strictly focus on our first-of-its-kind analysis on Lending Club’s database. For this reason, our research paper is structured in two parts: first, a brief overview of the company; and second, our study on the correlation between loan description and loan performance.
In our overview of the company, we first present the place held by Lending Club within the crowdfunding industry. Then, we explain Lending Club’s activity alongside with its business model. Finally, and more importantly, we stress the loan origination process, where a borrower can fill in a loan description.
Our research on loan descriptions is divided into three distinct parts, each of them contributing to our demonstration. Firstly, we looked at the yearly realized rate of default and compared it to the rate of default Lending Club was expecting. Secondly, we studied the evolution of several description-based parameters. Finally, we completed a statistical analysis to assess the significance of description-based parameters.
Lending Club Overview
Locating Lending Club within the Crowdfunding Industry
“While all our ancient beliefs are tottering and disappearing, while the old pillars of society are giving way one by one, the power of the crowd is the only force that nothing menaces, and of which the prestige is continually on the increase. The age we are about to enter will in truth be the era of crowds.” Gustave LE BON, in his introduction to The Crowd – A Study of the Popular Mind
What is new in Crowdfunding is the channelling of the power of the crowd through the social web, thanks to which many individuals can pool their financial support to a project. The nature of the financial transaction defines the area of the crowdfunding where the transaction operates. As commonly accepted, there are four types of crowdfunding transactions: donation-based, reward-based, equity-based and loan-based, which is the segment where Lending Club operates.
The following description of these four segments of the crowdfunding is based on the remarkable work of Kristof De Buysere, Oliver Gajda, Ronald Kleverlaan, and Dan Marom in A Framework For European Crowdfunding (Kristof De Buysere, 2012).
Donation-based: the donator does not expect any counterparty in return. It is extensively used by NGOs as it enables them to collect earmarked donations for specific projects
Reward-based: donator will receive a non-monetary compensation determined by a purchase contract. This sort of financing is mainly used for well-identified projects that can provide a symbolic token of gratitude towards the donator
Equity-based: donators are bound to the project by a contract which is a sort of / which more or less takes the form of a shareholding contract (profit sharing, exit profits). This represents an alternative to professional buyers of equity stakes
Lending or loan-based: similar to a credit contract (credit is repaid with interests). Web lending platform can act as the middle man between interested parties, including taking care of the repayments; or only as match finder between borrowers and lenders. There are several kinds of lending activities:
- Interest-free lending or social lending: funding is repaid back without interests - Peer-to-Peer lending: we chose to focus our research paper on this fast-moving
segment of crowdfunding, where Lending Club operates
Nota Bene: something interesting about peer-to-peer lending is that it should not be labelled as a crowdfunding activity, for two reasons. The first one is that people who lend money through Lending Club are rather investors than backers, meaning that they do not feel any special relationship towards projects or borrowers; they are just here to invest. The second reason is that a significant proportion of Lending Club’s borrowers do not attach any description to their application anymore, while in contrast a proper crowdfunding borrower need to make people fully aware of the project to fund. In nutshell, Lending Club’s activity is something like web retail banking, rather than crowdfunding.
About Lending Club
“We have pretty ambitious goals. We want to transform the banking system into a marketplace that is more competitive, more consumer-friendly, and more transparent.”1 Renaud LAPLANCHE, Lending Club CEO
The company
Lending Club was founded in 2007 by Renaud LAPLANCHE, after he found out that his bank had charged him an arbitrary 18% on a credit card loan2, while his savings were offered a poor yield...
In its 10K form for fiscal year ended December 31st, 2013, page 4, Lending Club’s business is described as follows: “Our marketplace connects borrowers and investors and provides a variety of services including screening borrowers for loan eligibility and facilitating payments to investors. Our model has significantly lower operating costs than traditional bank lending and consumer finance institutions because there are no physical branches and related infrastructure, no deposit-taking activities, an automated loan underwriting and servicing process and other technology-enhanced processes. We believe that the interest rates offered to borrowers through our platform are generally better, on average, than the rates those borrowers could pay on outstanding credit card balances or unsecured instalment loans from a traditional bank.”
Lending Club offers fixed interest rates which are said to be appealing within the traditional personal loan sector. The company actually benefits from the fact that its cost structure is far less important than the one of traditional banking institutions. Indeed, the whole process is conducted online and there is no branch network to fund.
1
Source: Interview of Renaud Laplanche with FORTUNE on March, 20th 2014
2 Source: Les Échos (November 29th, 2013), Renaud Laplanche, le Frenchy qui libère le crédit américain avec Lending Club
From a financial standpoint, as of December 31st, 2013, Lending Club employs 200 people and generated $98 million in revenue for a net income of $7.3 million (7.4% net margin)3. What is more, the company is said to go public but “the management continues to put off answers about the timing or size of its seemingly inevitable initial public offering”4.
Lending Club’s Business Model
Lending Club charges fees to both investors and borrowers as follows: Borrowers
- Origination Fee: compensation for borrower screening and loan issuing. It is a function of maturity and grade (see table in appendices). The origination fee is included in the Annual Percentage Rate (APR) and is deducted from the notional of the loan5
- Unsuccessful Payment Fee: there is a $15 fee when an automatic order of payment sent to a borrower’s account is rejected by the bank
- Late Payment Fee: after a 15-day grace period, a fee is charged and passed on to the investor as a compensation for delay in payment
- Check Processing Fee: applied to borrowers electing a check-based repayment Investors
- Service Charge: in compensation of making Note payment, and maintaining accounts
- Collection Fee: occurs when late payments are actually successfully collected. It is calculated on the amount recovered from late borrowers
A Five Step Loan Generation Process
We hereinafter sum up / summarize Simon CUNNINGHAM’s work in his article Lending Club Review for Borrowers: 5 Steps for a Loan from the website Lendingmemo.com, December, 2nd
3
Source: 10K Form
4 Source: The Street, Lending Club Picks Up IPO-Breed of Investors by Antoine GARA, April 17th 2014 5
2013. According to the author, the process was rather slick and fast, as the money was wired in six business days. This may partly explain the huge success Lending Club encountered in the US.
Step #1: initiate the process
The first step is to check the rate at which Lending Club is going to lend you the money. It is pretty much straightforward as the applicant borrower only has to fill out some information (like yearly income) before being offered a rate or being rejected.
Step #2: filling in details
If this first step is successfully passed, the applicant borrower will be offered the possibility to change the amount asked. After having accepted the interest rate and the amount, the applicant is asked further information regarding employment history and home ownership. Also, this is when one is asked to provide a title to the loan. Finally, one has to fill in personal banking information and agree to the loan terms.
Step #3: collecting funds
Once all of the above is completed, Lending Club reviews one’s application before creating its online listing on the investors’ platform. This listing enables all Lending Club’s investors (US residents) to examine one’s credit history, the amount and purpose of one’s loan and then to decide whether to fund it or not. Following CUNNINGHAM’s personal example, he applied during the morning; his loan was listed in the afternoon and quickly totally funded.
Step #4: getting verified
Interestingly, it is while your loan application is collecting funds that one has to verify some material information such as bank account, email address, proof of identity. Finally Lending Club runs a hard inquiry on one’s credit history.
Step #5: final approval and cash collection
One gets the final approval when Lending Club is provided with all required documents. Then, the loan status changes from Under review to Approved, triggering the official issuance of the loan.
It is important to know that borrowers still have some flexibility regarding payments (without being late of course). As a matter of fact, once a loan is initiated, one can make extra payments or pay the loan back in advance without penalty.
This step-by-step explanation of a lending process with Lending Club was very insightful. From a financial standpoint, and before our analysis on default, it seems like Lending Club has a deep knowledge of the applicants, who have to go through several verifying processes (hopefully). Therefore, Lending Club should have a clear assessment of any applicant’s creditworthiness. In addition to that, and from a more market standpoint, this applicant’s journey surely explains part of Lending Club’s huge success as the service is slick, fast and financially attractive.
As we can see, a loan request has clearly segmented areas:
At the top, one can find the purpose for the loan. Here it is debt consolidation
One will then be provided with loan details: amount requested, grade, maturity, etc.
Investors are given insights into borrower’s profile
Loan description
And finally Q&A, which is unfortunately not included in the database
The rest of our paper is devoted to determining whether loan description affects performance. We will first introduce our methodology and then present the findings of our three step approach.
Methodology
“Research is formalized curiosity. It is poking and prying with a purpose.”
Zora Neale HURSTON
Set of data
Our research is based on LC’s published loan data and encompasses all loans funded through LC with issue dates before March 31st 2014, which amounts to c.280k loans. Due to several inconsistencies in the database, we took the decision to delete irrelevant loans where material information was missing (like loan status, grade, etc.), which brought the panel of loans down to 265,098 loans.
Loan records contain very valuable insights into borrowers’ profile and loan activity. Due to the relatively precise angle for our paper, we disposed of irrelevant metrics to alleviate the file.
Regarding borrower profile, we focused on: employment period, home ownership, and, more importantly, description – leaving aside numerous credit profile attributes as our purpose here is to extract value from description. Regarding loan-focused set of data, we kept: amount asked and funded; maturity; interest rate; grade; instalment; date of approval by Lending Club and date of issuance of the loan; loan status purpose of the loan and total payment.
Creating comment-based variables
Our purpose here is to provide an answer to the ongoing interrogation about loan description having an impact on loan performance. Indeed, many investors provide their tips to one another, proudly stating that, to their knowledge, some specific words tend to increase delinquencies. To address this issue, we established several comment-based parameters, so as to clearly classify our set of data. Then we will have nothing left but to test the impact of these parameters on charged-off rate –defined thereafter.
Lending Club classifies its loans under fourteen categories which are as follows: car, credit card, debt consolidation, educational, home improvement, house, major purchase, medical, moving, other, renewable energy, small business, vacation and wedding. Therefore, for a description-based parameter to be valid, it should potentially apply for any of this set of purpose. Put another way, we had to find words or semantic fields not related to a purpose in particular; otherwise we would have assessed the “specific risk” of the purpose.
The very first parameter to test was the presence or the absence of description, which, obviously, satisfies the condition of not being purpose-specific. We therefore built a formula that would return 1 if the selected cell contained a description or 0 otherwise.
The second parameter we tested stemmed logically from the previous one: when a description was attached to a loan application, we wanted to know how long the applicant had written. Hence, we built a parameter that would return the number of characters contained in the description cell, provided that there was a description – this is to make sure the formula would not return zero, which would skew the analysis.
Nota Bene: in our analysis – more specifically in our statistic program – we actually got rid of the first parameter, as if the second one returns a value different from zero, it means that there is a description.
Once this parameter established – description length –, we paid attention to several semantic fields we thought were likely to apply for the whole set of purpose – and assure the validity of our approach. The first two we came up with were the semantic fields of religion and patriotism/community – we will use these acceptations interchangeably.
We acknowledge that this choice was, to some extent, made arbitrarily, but it seemed legitimate as we were analysing descriptions written by Americans or American residents, for whom these values are important.
We strove to build a portfolio of words with a source of authority, so that the list to be tested would not rely on our own and potentially biased choice. We based our semantic field analysis on the MacMillan Dictionary, which gives an extensive list of words for our two chosen area of analysis6. We applied a first screening to this list, as obviously some terms
6 Source: for the Religion semantic field see http://www.macmillandictionary.com/thesaurus-category/british/Beliefs-and-teachings-common-to-more-than-one-religion
would not be relevant. To that end, we simply used the Find shortcut (ctrl+F) in our database of loan descriptions and checked whether the words were present and relevant.The residual sample of the religion semantic field contained nine words; and eight for the one of patriotism.
Religion Bless, Christian, faith, God, miracle, rebirth, religion, religious, sacred
Patriotism U.S, citizen, green card, patrol, army, veteran, native, minority
We acknowledge that the size of our samples is somewhat short, as they only captured 0.7% of the total number of loans with a description. There is room for improvement regarding these two semantic fields.
Due to the material decrease over the time in the number of comments linked to these semantic fields, we looked for parameters that would be less specific. We went for something less subject to interpretation and more focused on the lending approach. Indeed, in most loan descriptions, applicant borrowers mainly explain their projects. But some of them feel the need to stress their particular ability to repay investors. We discerned two patterns: the ones focusing on their personal qualities and the ones stressing on their financial strength. We defined the former as Self Promotion, and the latter as Financial Promotion.
We established a list of words based on an extensive reading of the database. For Self Promotion, we retained twenty words expressing around four ideas. Regarding Financial Promotion, we established a list of sixteen words linked to two ideas.
Source: for the Patriotism semantic field see http://www.macmillandictionary.com/thesaurus-category/british/Community-and-the-feeling-of-belonging-to-a-community
Self-Promotion A new life New life, new start, life easier
Paying one’s bills Always pay my bills, never been late, never paid late,
Good loan candidate Good borrower, solid borrower, great borrower, a good candidate, a great candidate, loan candidate
Reliable person Let you down, reliable, responsible, respectful, trustworthy, trust me, working(ing) hard
Financial Promotion A good credit score Credit history, credit score, good credit, no delinquencies
Stable employment Excellent job, full(-)time, part(-)time, good job, job is secure, same company, same job, stable job, steady job, good salary
Altogether, these two additional parameters represent 13.4% of total number of loans with a description, which is much more than our first approach. Added to the former 0.7%, our model enabled us to study the potential impact of loan description for c.14% of the population.
Assessing performance
Lending Club provides us with up-to-date information regarding loan status. As of the day we downloaded Lending Club’s files, we know for every loan whether the borrower paid it back,
or, if the loan is still on-going, whether the borrower experiences difficulties in reimbursing it. The detail of the different status is as follows:
Loans without troubles: on-going loans are described as current (just issued loans are marked issued) until they are fully paid.
Loan with troubles: this is when borrowers miss a payment. Then, provided that borrowers still can’t complete their payment, loan status changes from in grace period (0-15 days), Late (16-30 days), Late (31-120 days), Default (121-135 days), and finally Charged Off (>135 days being late)
Definitions:
Our first approach with performance assessment was with the following formula, which lacks real significance:
Indeed, as first explained in our literature review regarding Peter RENTON’s study, a huge part of our set of loans is still outstanding7. This is due to the fact that Lending Club is more and more popular, with its customer base growing exponentially; and because since 2010, the company enables its customers to opt for a 60-month maturity.
Consequently, if we had conducted or analysis without making any adjustment, we would have found that the first years of activity have a total charged-off rate much higher compared to past few years, hence skewing the analysis. To prevent such a bias in our approach and to make results comparable we established an adjusted charged-off rate:
Equation 1: Defining the adjusted charged-off rate
7
This adjusted charged-off rate is more meaningful than the previous one that is why this is the rate we will show in our analysis. It represents a realized rate of charged-off, sensitive to any outstanding loan that goes through a credit event (be late) or that is fully paid.
In a nutshell, having shown how we segmented our set of data, and having established our metrics for performance, we can now tackle the purpose of our paper: determining whether description has an impact on performance. So as to extract the sole impact of description, we would have had to establish the adjusted charged-off rate per criterion, per maturity, per grade and per sector, as these three parameters have a material impact on performance. But building a table where adjusted charged-off rate is drilled down into criterion, maturity, rating and sector; makes the interpretations contingent upon the area of the chart. Put another way, we would not be able to interpret the data at a comprehensive level.
To clarify our problem here, let us take an example. In the table we just mentioned, we could have a close look at loans that are A-rated, with a maturity of 36 months and within the sector Debt Consolidation. Maybe we would there discern a significant variation of the adjusted charged-off rate following the description-based criteria we explained previously. The problem is that this variation would be in no way comparable to a variation spotted within loans that are from a different category – let us say G-rated, with a maturity of 60 months and used for Wedding purpose.
This example shows that our work on the database would only enable us to establish as many interpretations as possible scenarios depending on rating, maturity and sector; which amounts to:
This is the reason why we will only present in our development an aggregated view of adjusted charged-off rate per description-based criteria, blending in rating, maturity and sector, just for the sake of curiosity.
Furthermore, our willingness to give a single scientific answer to our topic is in contradiction / contradicts with the fact that we should interpret 196 different situations, which is one of the limits of our model. To solve that problem, we completed our empirical approach by a statistical one.
Statistical significance of our results
As we just said, we could not achieve any conclusion if we only relied upon the interpretation of our model, because it is contingent upon the sample of data and the parameters we choose.
In order to analyse the sole impact of each variable ceteris paribus, or independently of all the others, we ran a multiple Ordinary Least Square Analysis using EViews. We had to amend our model so that it could be statistically assessed.
As explained before, we got rid of loans being marked as current or issued so as to narrow our sample to loans that were either Fully paid or experiencing a credit event. Thus, our revised sample contained 62,895 loans.
Further amendments are described as follows:
Charged-off indicator (dependent variable): 1 if when a loan has been charged off, 0 otherwise. We focused only on charged-off as it is the only stage that investors want to avoid, as they eventually get compensated for earlier stages of default
Rating: we ranked grades from A=1 to G=7
Maturity: return 1 if a loan has a maturity of 36 months, 0 otherwise
Number of characters: this variable is equal to 0 when there is no description attached. Hence this variable will give the overall impact of description on performance
Specific content indicator: we isolated our four parameters – religion, patriotism, self-promotion and finance self-promotion – in four distinct columns, so as to assess the significance of each variable
Sector: we reduced our sector panel to eight denominations, as there were too many columns with only (0 ; 1) in our model, putting EViews in the incapacity of reversing a matrix. We kept the first eight sectors (by order of importance) which represent 95% of the funding reasons; residual loans were classified under the other purpose category. Classification is as follows:
Table 1: How we built our Sector variable
Finally, once the multiple ordinary least square completed, we tested the statistical significance of our variables by running the model over different estimation periods: first over the two halves of the sample and then during the year 20128.
The results of this statistical analysis will enable us to give a definitive and scientific answer to our interrogation, with regards to potential mistakes we may have made in the process.
Room for improvement
We obviously hope that we have made as few mistakes as possible in our study. Nonetheless, we sometimes proceeded in a way that increased the likelihood of making mistakes.
First, when working on Lending Club’s database, we first had to make adjustments to loan descriptions that contained phrases like “Borrower 123456 added on 8/14/10>”. Due to the size of our sample, we chose to complete this adjustment using Find and Replace functions in Excel. Thus, our action may have affected descriptions that unfortunately had these phrases but not due to Lending Club database management. As a result, we might have brought down the number of characters in some cells.
8
2012 is the year with the widest annual sample, with 16,952 relevant loans.
Loan purpose # loans Cumul (#) Cumul (%) Ticker
debt_consolidation 33,012 33,012 52% 1 credit_card 9,664 42,676 68% 2 other 5,349 48,025 76% 3 home_improvement 4,045 52,070 83% 4 major_purchase 2,542 54,612 87% 5 small_business 2,296 56,908 90% 6 car 1,543 58,451 93% 7 wedding 1,096 59,547 95% 8 medical 945 60,492 96% 3 moving 734 61,226 97% 3 house 640 61,866 98% 3 vacation 508 62,374 99% 3 educational 412 62,786 100% 3 renewable_energy 109 62,895 100% 3
Something more consequential is that the database only contained descriptions filled in by borrowers when completing their application process. It does not include answers to investors’ questions, which are directly published onto the loan webpage. As a result, our analysis regarding the number of loans issued with/without description, and the average description length, might be skewed.
Another weakness in our analysis is our use of the semantic fields of Religion and Patriotism. It is possible that we missed some other words that would beef them up and hence improve the significance of our analysis (regarding these two parameters). More generally, one may find another semantic field that would prove to be more relevant.
Finally, one may conduct our statistical approach in different manner, with other parameters. For instance, our choice to focus on charged-off loans instead of all states of late loans could be questioned.
LOAN DESCRIPTION AND LOAN PERFORMANCE
How much of the performance is explained by the rating?
Introducing Lending Club’s charged-off concept
Our first task was to duly classify our data following the default scale used by Lending Club, which runs from in grace period to charged-off. Since 2007, the track record of loan status is as shown in the table below:
Table 2: Classification of loan status since 2007, as of March 2014
This chart is based on the files we downloaded, where loans are ranked chronologically, based on their date of issuance. Thus, we are provided with the up-to-date status of all loans that have not been either fully paid or charged-off yet.
The first thing that is striking is the exponential growth of Lending Club’s customer base. The compound annual growth rate between 2007 and 2013 is 140%. Consequently, the population of current loans is more and more important starting in 2010. This means that, as of March 2014, 202,041 loans are still outstanding and are not currently experiencing any credit event. As we previously explained, this can cause bias in our analysis as shown at the bottom of the chart, highlighted in blue.
2007 2008 2009 2010 2011 2012 2013 Q12014
Charged Off (>135 days) 183 489 715 1,615 2,567 3,935 1,420
-Default (121-135 days) - - - 4 3 14 40
-Late (31-120 days) - - 6 91 293 1,092 1,735 23
Late (16-30 days) - - - 7 46 169 314 45
In Grace Period (0-15 days) - - - 17 111 415 776 60
Fully Paid 512 1,889 4,585 9,437 9,355 11,327 9,215 390
Current - - - 1,542 10,013 37,363 120,579 32,544
Issued - - - 162
Total 695 2,378 5,306 12,713 22,388 54,315 134,079 33,224
Total Charged Off Rate 26.3% 20.6% 13.5% 12.7% 11.5% 7.2% 1.1% -Adjusted Charged Off Rate 26.3% 20.6% 13.5% 14.5% 20.7% 23.2% 10.5%
-We want to stress this point, as it legitimates our choice to dispose of current loans for the rest of our analysis. The row Total Charged Off Rate shows us a huge drop in the charged-off rate since 2007. However, one should not conclude here to a dramatic improvement in Lending Club’s ability to assess its customers’ creditworthiness. Indeed, this rate is just an indicator of how many loans from year (t) got charged off. Put another way it is a realized charged off rate. The problem with it is that the more recent the year, the more important the amount of current loans in the denominator. This is the reason why the total charged-off rate is so low in 2013, as 90% of the 2013 population is outstanding.
This is why we established an adjusted charged off rate. This metric also captures a realized charged off rate, in the sense that it may evolve with the fate of outstanding loans, but it has much more merit than its peer. Indeed, thanks to the adjusted charged off rate, we can compare what was not comparable with the total charged-off rate, as of today obviously9. As a consequence, we can keep the recent years of data in our analysis.
Establishing expected default rate per grade
Every time an application is made to Lending Club, the applicant’s profile and credit history are thoroughly reviewed. Hence, creditworthiness of all borrowers should be fairly assessed. Thanks to an additional file that was accessible by the time we began our study, we have the expected default rates per almost all grades (A1, A2, etc.)10. Indeed, some grades were not attributed to any loan, leading us to approximating them to get the full range of expected default.
There was no time specification in the file, so our first guess was that expected default rates was comprehensive ones, meaning covering the whole maturity of each grade. However, this is inconsistent with the average rate of charged-off we can observe in Table 2, which is 20.1% between 2007 and 2009 (or 16.6% when computing a weighted average). As a matter of fact, how could we explain a charged-off rate between 16% and 20% when all expected default rates are lower than 12% (grade G)?
9
Indeed, as the 23.2% adjusted charged off rate for 2012 could evolve to 7.2% if no more loans are charged off.
10
There are two explanations to this inconsistency: either Lending Club is particularly bad at assessing its customers’ creditworthiness; or we were not provided with expected default rates covering the whole maturity. Obviously, the second explanation is much likely than the first one, which would have hit the press. Therefore, we amended our calculations so as to compute expected default at three and five years.
Just to ensure we are singing from the same hymn sheet, we provide thereafter how we transformed a one-year expected default rate into a three or five-year one:
Equation 2: From a yearly rate of expected default to a three or five-year one
Results are as follows11:
Table 3: Breakdown of expected default rates over different maturities
One could object to the validity of the expected default rates we present here, as they may have changed since inception. However, we would answer that if the rates have changed, they certainly have changed for the better, and they should now capture the expected default rate better than they used to. Therefore, it is appropriate to use them over the whole timeframe of our sample.
Several remarks on that chart: the increase in the expected rate of default is less and less important as climb down the grade ladder. See for instance how wide the gap between a three-year A (4.4%) and a three-year B (10.4%) is. Furthermore, one should not be that much
11
Nota bene: the one-year rate is an average based on the subcategories of grade. To be more precise, we could have computed a weighted average rate, based on the weight of each subcategory within the grade. A1 0.9% B1 2.5% C1 4.8% D1 6.8% E1 n.d. F1 n.d. G1 11.5% A2 1.2% B2 3.3% C2 5.1% D2 7.2% E2 n.d. F2 n.d. G2 n.d. A3 1.6% B3 3.5% C3 5.5% D3 n.d. E3 n.d. F3 n.d. G3 n.d. A4 1.7% B4 4.1% C4 6.0% D4 8.1% E4 n.d. F4 11.1% G4 n.d. A5 2.1% B5 4.6% C5 6.4% D5 n.d. E5 n.d. F5 n.d. G5 n.d. 1y A 1.5% B 3.6% C 5.5% D 7.4% E 9.2% F 10.7% G 12.0% 3y A 4.4% B 10.4% C 15.7% D 20.5% E 25.1% F 28.7% G 31.9% 5y A 7.3% B 16.7% C 24.7% D 31.7% E 38.2% F 43.1% G 47.2%
worried by the high rates of default regarding poor grades, as investors are compensated for the risk of default by a high interest rate: above 20% for E grades and less.
Comparing realized default rate and expected default rate
Now that we have established expected default rates per grade and per maturity – under the assumption that we were not provided with yearly rates in the first place – we just had to classify loans accordingly, as shown in the next table:
Table 4: Loan classification per grade and maturity since 2007
Then, we calculated the yearly expected default rate as the weighted sum of default rates, in accordance with maturity. Results are as follows:
Grade 2007 2008 2009 2010 2011 2012 2013 Q12014 Maturity 36 months A 91 323 1,204 2,668 5,700 10,795 16,918 4,956 B 123 594 1,457 2,802 4,905 17,243 39,972 8,993 C 157 581 1,353 2,070 2,319 10,134 24,556 6,469 D 116 416 817 1,251 1,307 5,190 14,439 2,660 E 111 276 313 334 276 821 3,222 849 F 59 105 105 90 55 108 615 275 G 38 83 57 32 10 24 15 8 Maturity 60 months A - - - 263 179 161 605 6 B - - - 906 1,886 1,684 3,768 656 C - - - 678 1,787 2,060 13,390 3,118 D - - - 648 1,571 2,225 6,149 3,119 E - - - 644 1,506 2,406 5,810 1,475 F - - - 227 688 1,228 3,764 478 G - - - 100 199 236 856 162
Table 5: Expected vs. realized charged-off rate
We are not going to comment on years after 2009 as they contain outstanding loans that may bring the Realized rate of default up or down – that is why rates are in italic in Table 5. Nonetheless, even prior to 2010, the results remain very interesting.
Indeed, we can observe that the gap between realized default rates and expected default rates is significantly decreasing between 2007 and 2009: in 2007, realized default was 9% higher than expected; in 2008 it was 5% higher than expected; and in 2009 it was in line with expectations. Unfortunately, our sample of data being limited to three years, we must remain cautious when establishing conclusions.
Another observation is that the expected default rate is quite steady, around 16%. This leads us to the assumption that Lending Club limits the issuance of certain grades once their quota is reached. As a consequence, in order to make the realized default rate decrease, the company is likely to have reduced its issuance of poorly graded loans. This statement is illustrated by the table below.
Grade Default 2007 2008 2009 2010 2011 2012 2013 Q12014 Maturity 36 months A 4.4% 13% 14% 23% 21% 25% 20% 13% 15% B 10.4% 18% 25% 27% 22% 22% 32% 30% 27% C 15.7% 23% 24% 25% 16% 10% 19% 18% 19% D 20.5% 17% 17% 15% 10% 6% 10% 11% 8% E 25.1% 16% 12% 6% 3% 1% 2% 2% 3% F 28.7% 8% 4% 2% 1% 0% 0% 0% 1% G 31.9% 5% 3% 1% 0% 0% 0% 0% 0% Total 100% 100% 100% 73% 65% 82% 74% 73% Maturity 60 months A 7.3% - - - 2% 1% 0% 0% 0% B 16.7% - - - 7% 8% 3% 3% 2% C 24.7% - - - 5% 8% 4% 10% 9% D 31.7% - - - 5% 7% 4% 5% 9% E 38.2% - - - 5% 7% 4% 4% 4% F 43.1% - - - 2% 3% 2% 3% 1% G 47.2% - - - 1% 1% 0% 1% 0% Total - - - 27% 35% 18% 26% 27% Expected Default 17.6% 15.9% 13.4% 16.1% 16.6% 15.2% 17.1% 17.2% Realized Default 26.3% 20.6% 13.5% 14.5% 20.7% 23.2% 10.5% 0.0%
Table 6: Proportion of each grade issued per year
This table also illustrates the fact that Lending Club has significantly increased the proportion of top grades in its portfolio, at the expense of the lowest ones. For instance, E-grade loans proportion in issuances is down from 16% in 2007 to 7%, while B-graded loans proportion is up from 18% to 29%. But then, how is it possible that the expected default rate went up in 2010 – see Table 5 – by three percentage points while the quality of the loan portfolio as increased? The answer is given by Table 4, where we can observe that from 2010 onwards, Lending Club offered the opportunity to sign up for a 60-month loan contract, instead of the traditional 36-month one. Our guess is that the company wanted to increase its revenue without bringing down the quality of its loan portfolio.
The fact that the realized default rate gradually declined to equalling the expected default rate could be a strong argument against the financial interest of loan description. We admit that this equality could be a coincidence, as we do not have enough data to prove it. Nonetheless, when having a look at 2010 – where only 12% of the issued loans are still outstanding – one can notice that realized default rate is 14.5%, 1.6% below expectations. So, unless all 2010 current loans got charged off, realized default rate is likely to meet expectations in 2010 as well.
Furthermore, in 2009, 5% of Lending Club’s borrowers did not attach any description to their loan. In 2010, this proportion is multiplied by seven, 35% of loans being issued without description.
Let us assume that realized default rate will continue to be in line with expected default rate. Thus, as on the one hand realized default rate is equal to expected default rate; and, on the
Grade 2007 2008 2009 2010 2011 2012 2013 Q12014 A 13% 14% 23% 23% 26% 20% 13% 15% B 18% 25% 27% 29% 30% 35% 33% 29% C 23% 24% 25% 22% 18% 22% 28% 29% D 17% 17% 15% 15% 13% 14% 15% 17% E 16% 12% 6% 8% 8% 6% 7% 7% F 8% 4% 2% 2% 3% 2% 3% 2% G 5% 3% 1% 1% 1% 0% 1% 1%
other hand, the proportion of loans issued without description is more and more important, we can say that loan description has an insignificant impact on loan performance. Put another, Lending Club’s rating would explain 100% of the performance.
In a nutshell, under the hypothesis that Lending Club’s rating continues to prove reliable, loan description do not hold any financial interest. Put another way, loan description has no impact on loan performance.
Loan performance following different description-based parameters
Building our description-based model
As explained in our methodology, the first and easy parameter that can be tested is the presence/absence of description. The table below gives the proportion of loans issued with or without description since 2007:
Table 7: Evolution of the proportion of loans issued without description since 2007
The first remark regarding that table is that there is a clear trend over the time period of our study: until 2009, almost all applicant borrowers used to fill in a description; in 2010, only two thirds of them would do so; and in 2013, only one third of them attach a description to their loan application. However, this table does not take into account answers written by borrowers to questions that investors directly post on the lending platform. For instance, in 2013, two thirds of the loans were issued without description, but borrowers might have answered questions online. As it was no included in Lending Club’s database, this is something we cannot account for.
Furthermore, despite the fact that borrowers and investors may eventually interact, this table is a strong argument against the assimilation of Lending Club within the crowdfunding galaxy, as briefly mentioned in Locating Lending Club within the Crowdfunding Industry. Indeed, our guess is that borrowers no longer have any incentive to write a description as their application – once reviewed and accepted by Lending Club – will get funding anyway, due to the unceasingly increasing demand from investors’ part.
Before going into the details of our second description-based parameter, it is interesting to notice that if an investor decides to follow a loan picking strategy based on the description,
2007 2008 2009 2010 2011 2012 2013 Q12014 Description provided 679 2,375 5,020 8,307 13,130 33,245 48,044 11,843 No Description 16 3 286 4,406 9,258 21,070 86,035 21,381 Total 695 2,378 5,306 12,713 22,388 54,315 134,079 33,224 Description provided 98% 100% 95% 65% 59% 61% 36% 36% No Description 2% 0% 5% 35% 41% 39% 64% 64%
s/he automatically shuts the door on 64% of loans, drastically reducing his/her investment opportunities.
Interestingly, we noticed a similar trend when analysing our second metric: description length. Indeed, alongside with a decrease in the proportion of loans with a description, we noticed a material drop in the average number of characters per comment. We also conducted an analysis per quartile as one knows how sensitive to high values an average can be. Results are illustrated as follows:
Table 8: Evolution of the average description length and quartile analysis
We can observe that all metrics are up from 2007 to 2010, denoting that borrowers were filling in wordier and wordier descriptions. However, this upward trend has brutally stopped / come to a halt from 2011 onwards: between 2010 and 2013, average description length was divided by nearly 4. This table clearly shows that should a borrower write a description – which is less and less likely to happen – the number of characters used is far less important than it used to be. To translate this result in something more meaningful: Lending Club’s borrowers now write descriptions that contain 22.4 words on average12 - against 89.4 in 2010. Similarly to what we discussed regarding the proportion of loans with/without comment, our data might be incomplete as it does not include possible answers to investors’ questions – if any. Nonetheless, we have established a clear and material downward trend regarding average description length.
If there were any impact, it could potentially be explained by the presence of key words or the length of the description itself. But the fact that descriptions get shorter and shorter undermines the first explanation, as the likelihood for those specific words to be written has
12 5.1 is the domineering average number of letters for an English word – widely quoted on the internet. 22.4 represent the average number of words per description between 2013 and 2014.
2007 2008 2009 2010 2011 2012 2013 Q12014
Avg length 284 339 380 456 315 143 116 111
Quartile 1 64 77 100 136 96 60 44 40
Quartile 2 151 195 244 295 212 125 89 79
dramatically decreased. So, if there were any, financial impact of description is likely to have shrunk. Nonetheless, at this stage, we cannot address the fact that length itself – even shorter and shorter – may have an impact on performance. We address it in our statistical approach, the third step of our demonstration.
Let us now focus on the other description-based parameters: the semantic fields of religion, community, self-promotion and financial promotion. We thereafter provide a comprehensive view of our findings, giving the total number of comments found per semantic field. For more detailed tables on number of comments and occurrences, see in the appendices - Table 12, Table 13, Table 14, and Table 15.
Table 9: Evolution of the number of comments per semantic field
A quick look at the Table 9 shows that are first two semantic fields are proven insignificant. Indeed, the cumulative number of comments is only 872, hence 0.7% of all comments. However, similarly to description and description length, we noticed a continuous increase in the number of religious and patriotic comments until 2011, after which it started to fall – the drop was more significant for the patriotic semantic field, which declined from 108 identified comments in 2011 to 22 in 2013.
Later on, we added the other two semantic fields to our analysis, in the hope of finding parameters that would encompass a much larger proportion of comments. Indeed, it was logical for us that in order to secure the funding of their loan, borrowers would stress their personal values or their financial strength to pay back investors. We were proved right, as the size of our additional semantic fields is much more important: cumulated together, they represent 13.4% of all comments.
We are quite certain that the list of words to test regarding self and financial promotions could be significantly increased thanks to a more comprehensive reading of the description
2007 2008 2009 2010 2011 2012 2013 Q12014
Religion 5 20 38 110 142 104 77 20
Patriotism 7 16 41 83 108 76 22 3
Self promotion 35 153 637 1,190 1,639 1,340 1,030 185
database. However, as shown in Table 9, we still captured a material decrease in the number of comments referring to one these two semantic fields. As a matter of fact, the number of comments related to self-promotion declined by 37% between 2011 and 2013. Regarding financial promotion, the number of comments is down by 33% over the same period.
We gather that this phenomenon is linked to the automation of Lending Club’s lending process. As the demand for Lending Club’s loans is unceasingly increasing, investors are likely to get less fussy about description, and rely on their own questions to borrowers, or on the company’s loan rating. Anyway, because borrowers less and less promote their ability to repay investors back, it is hard to think that descriptions would provide insights into borrowers’ reimbursement capacity. In a nutshell, the decline of these two semantic fields goes against a potential financial value of descriptions.
In a nutshell, even before studying the adjusted charged-off rate per description-based criteria, the sole analysis of these parameters has proven to be very interesting. Indeed, we have highlighted several trends that undermine the idea that descriptions could enable to anticipate loan performance:
Two thirds of the loans are issued without description
When there is a description attached, it contains much fewer words than it used to
The importance in description content of two semantic fields well related to loan performance – meaning the ability for the borrower to repay investors back – is materially shrinking
Once again, our analysis does not take into account the fact that investors and borrowers can interact via Q&A on the loan page. Borrowers who do not leave a description attached to their loan request might be asked to give some details. Nonetheless, since April 15, 2011, investors can only ask questions from a predefined list13, which limits the extent of investigation.
Presenting loan performance based on description-based parameters
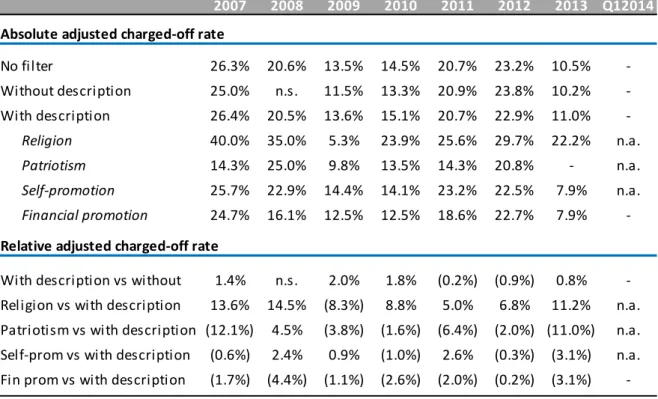
The following table presents adjusted charged-off rate (as defined in Equation 1) per description-based criterion. The upper part gives the absolute figures, whereas the lower one presents differences of charged-off rate. For instance, the row With description vs without is the difference between the adjusted charged-off rate for loans with a description and the one for loans without a description. TN.s. stands for non-significant; and n.a. for non-applicable. A detailed loan status breakdown is provided in the appendices, Table 16.
13
Table 10: Adjusted charged-off rate per description-based variable
We focus our observation on the lower part of the table Relative adjusted charged-off rate. As previously explained, these figures do not prove anything as they are sensitive to grade, maturity and sector distribution. Anyway, it is worth looking at the sign of the difference. The first row gives us the comparative performance of loans with a description against loans without a description. From 2007 to 2010 the difference is positive, meaning that loans with a description experienced a higher rate of charged-off. However, in 2011 and 2012 the phenomenon was reversed, as the difference is negative. If we ignore the potential effects from a difference in grade, maturity or sector distribution, we could say that this sign change invalidates the fact that the presence or the absence of a description would have an impact on performance – which would have been translated in a stable positive or negative sign. Hence, one cannot say that adding description has a positive or negative impact on loan performance.
A similar remark could be made regarding the fourth row, Self-promotion vs with description, as the sign of the difference is changing from one year to another.
The case of the religion semantic field is interesting despite the relative insignificance of the sample of loans it refers to. Indeed, loans within this semantic field have always
2007 2008 2009 2010 2011 2012 2013 Q12014
Absolute adjusted charged-off rate
No filter 26.3% 20.6% 13.5% 14.5% 20.7% 23.2% 10.5% -Without description 25.0% n.s. 11.5% 13.3% 20.9% 23.8% 10.2% -With description 26.4% 20.5% 13.6% 15.1% 20.7% 22.9% 11.0% -Religion 40.0% 35.0% 5.3% 23.9% 25.6% 29.7% 22.2% n.a. Patriotism 14.3% 25.0% 9.8% 13.5% 14.3% 20.8% - n.a. Self-promotion 25.7% 22.9% 14.4% 14.1% 23.2% 22.5% 7.9% n.a. Financial promotion 24.7% 16.1% 12.5% 12.5% 18.6% 22.7% 7.9%
-Relative adjusted charged-off rate
With description vs without 1.4% n.s. 2.0% 1.8% (0.2%) (0.9%) 0.8% -Religion vs with description 13.6% 14.5% (8.3%) 8.8% 5.0% 6.8% 11.2% n.a. Patriotism vs with description (12.1%) 4.5% (3.8%) (1.6%) (6.4%) (2.0%) (11.0%) n.a. Self-prom vs with description (0.6%) 2.4% 0.9% (1.0%) 2.6% (0.3%) (3.1%) n.a. Fin prom vs with description (1.7%) (4.4%) (1.1%) (2.6%) (2.0%) (0.2%) (3.1%)
-underperformed the population of loans with a description, except for the year 2009. It could be due to the grade/maturity/sector distribution, but still, the difference in performance is significant.
The remaining two parameters appear to have outperformed the control population – with description. Indeed, the sign of the difference is almost always negative.
In a nutshell, we can infer from that table that there is no clear impact of description on loan performance. Indeed, the sign of the difference in performance between loans with and without a description is irregular.
However, these variations in performance could be due to differences in the grade, maturity, or sector distribution within the categories. Therefore, so as to identify the sole impact of description, we had to run a statistical assessment of our variables. What is more, thanks to this statistical approach, we were able to test the impact of residual parameters as: description length, and semantic fields.
Statistical significance of the impact of loan description on loan performance
Purpose
Throughout our research paper, we often stressed the importance to control for side effects from parameters not linked to description. Indeed, following the results of Table 10, the poor performance of the Religion semantic field could potentially be explained by a concentration of G-grades or longer maturities. Analysing all possibilities individually would not solve the issue, as it would mean giving up the scientific aim of our research paper: studying the impact of loan description on loan performance, all other things being equal.
In the previous part, we showed that descriptions were less and less meaningful and that there was no clear correlation with performance. But, the limits of our model prevented us from achieving irrefutable conclusions. These limits are solved but the statistical approach; as it will provide us with the impact that each variable has on default, independently from the others.
Finally, as mentioned in our methodology, our own statistical model needs to be tested; otherwise the statistical significance of our variable would be contingent upon the sample studied. To that end, we ran our model over different estimation periods, to check whether the significance of our parameters were regular.
Results of the statistical approach
The results of our analysis are as follows:
Table 11: Statistical assessment of our parameters since 2007
Our dependent variable was a column named charged-off, with only 0 and 1, 1 meaning that a loan had been charged-off. Hence the low value of the coefficients. “C” represents the constant parameter of the equation.
At first sight, the usefulness of our model seems undermined by its poor R-squared of only 3.4%. But this does not come as a surprise, as a high R-squared would have meant that we could have predicted default, which is impossible – one can only give a probability of default, like the expected default rates in Table 3. Therefore, as what matters is not to predict default, but to determine which parameters have an impact on it, the important metrics are the sign of the coefficients and the t-Statistic values.
The sign of the coefficients indicates whether a variable has a positive or a negative impact on the dependent variable. Put another way, the sign of the coefficients shows whether the studied parameter increases or reduces the likelihood for a loan to be charged off.
The t-Stat test enables us to prove or disprove the null hypothesis, which refers to the fact that the relationship between a parameter and the dependent variable is non-existent. Strictly speaking, for a variable to be statistically significant, its t-Stat should be above 2, in absolute value.
The previous table provides us with a key finding in our analysis, as it proves that the impact of loan description on loan performance is statistically insignificant, and thus could be totally ignored when investing. Indeed, the t-Stat value for the variable NBCHARACTERS is 0.11 – in absolute value – far below the significance threshold. Compared to our former analyses, which were dependent on several assumptions or other parameters, this statistical approach is much more solid.
Statistical validity of our parameters
Based on the results illustrated by the Table 11, NBCHARACTERS is the only variable whose significance can be rejected immediately. Even so, one cannot conclude that the remaining parameters are significant. Indeed, for these parameters to be validated, they must show resilience in the sign of their coefficient and their t-Stat value when tested over different estimation periods.
The revised statistical results over different estimation periods are provided in the appendices, see Table 17: Results of our OLS analysis over the first half of our sample, Table 18: Results of our OLS analysis over the second half of our sample, and Table 19: Results of our OLS analysis over the year 2012.
The other parameters whose significance is invalidated by our statistical assessment are: the maturity14 and all our description based criteria. In a nutshell, only the rating and the loan purpose – sector – have a statistically significant impact on default. These findings may sound a bit obvious, but the fact that they are proven right by our statistical model strengthens the
14 We did not expect the significance of maturity to be invalidated, as in basic finance a longer maturity is riskier, increasing the likelihood of default.
latter. Put another way, there would be something wrong with a model indicating that rating has no impact on default. So it is very encouraging.
We would like to give some more details about our parameters. First, we remind that we built the Rating variable to evolve from A=1 to G=7. What is more, as the associated coefficient is positive, it means that an augmentation in the parameter – from 1 to 7, which actually means a lower grade – increases the likelihood of default, which is logical. Second, considering how we built our Sector variable – see page 19 – the positive coefficient means that the likelihood of default is gradually increasing when one invests towards the ticker 8. We do not really see much value in this information, as it could due to the sole fact that we classified loan purpose by size. Indeed, the marginal effect of one loan being charged off is much more significant within the sector 8 than within the sector 1, due to their respective size. Therefore, only the variable Rating has an irrefutable impact on performance.
Nota bene: the usefulness of the statistic approach is highlighted by the fate of the criterion Finance promotion. As a matter of fact, based on the results of Table 10, this description-based parameter seemed to outperform the population of loans with a description. This was a potential example of the fact that specific words could have an impact on performance. Nonetheless, it resulted from the statistical model this parameter was insignificant, undoubtedly because the outperformance is solely explained by the rating within this population of loans.
Conclusion: loan description has no impact on loan
performance
The strictness of our scientific approach makes this research paper a first-of-its-kind, compared to other similar initiatives. Following a three-step approach, we proved that loan descriptions have no impact on loan performance.
Our first step was to analyse Lending Club’s accuracy in assessing the creditworthiness of its borrowers. During Lending Club’s first three years of activity, the spread between the realized charged-off rate and the expected charged-off rate gradually decreased to reach zero in 2009. One year is not enough for us to formulate conclusions, but if this spread were to remain low, it would mean that performance is entirely explained by Lending Club’s rating model. Thus, there would be usefulness for loan picking based on description-based criteria, as the market could not be beaten.
Our second step was to drill down into loan descriptions, with the analysis of several parameters. We showed that description writing was a trend going scarce, since the proportion of borrowers writing a description is down from 100% at inception to one third now, and because the average description length has been divided by four since 2010. What is more, an analysis of adjusted charged-off rate per description-based criterion showed no pattern in favour of loans with a description, except for one semantic field, which was proven insignificant in our next part. All this undermines the possibility for loan descriptions to have a potential impact on loan performance.
The third part of our analysis solved the contingency of our previous findings upon the data sample. To that end, we statistically assessed the significance of our variables. The variable linked to the presence of description – the number of characters – was proven to be statistically insignificant, alongside with all our description-based parameters. As a matter of fact, nothing but the rating has a statistically significant impact on loan performance15. Therefore, a loan picking strategy based on description is void of sense.
15 We prefer not to mention the parameter Sector, also proven to be statistically significant, as it might be a result of how we built the variable.
The impact of our study goes beyond the sole case of individual investors: it legitimates Lending Club as an investment opportunity for more traditional financial actors. Indeed, we have shown that the investing process could be automated, regardless of P2P characteristics like description for the loan and Q&A with investors. Added to the fact that performance seems to depend solely on rating, Lending Club’s loan portfolio represents a choice investment opportunity for more and more investors that are not Peers16.
16
Actually, based on The Wall Street Journal’s article Would You Lend Money to These People? (April 13, 2012) “In the past 18 months, Lending Club has gathered 30 institutional investors, including hedge funds and wealth-management firms”