Dietary mineral intakes of young Tibetan children
living in areas endemic for Kashin-Beck disease:
preliminary results of a cross-sectional survey
M. Dermience
a, F. Mathieu
b, X. Li
c, S. Vandevijvere, W. Claus
b,
V. De Maertelaer
b, G. Dufourny
d, L. Bin
e, D. Yangzom
b, G. Lognay
a36th SICOT Orthopaedic World Congress (Guangzhou, P.R. China, 2015)
a
c b
Background
• Kashin-Beck disease (KBD) is an endemic and
chronic osteochondropathy whose etiology
remains unclear [1]
• Environmental factors are assumed to be
involved, among which the selenium and
iodine deficiency [2,3]
Background
• Tibetan populations share 4 macro-ecosystems [4]:
Urban zones
Suburban zones
Pastoral zones
Agricultural zones
• KBD only encountered in Agricultural zones
Aim of the study
• Assessment of minerals intakes of preschool children
living in endemic areas for Kashin-Beck disease
• Compare the calculated intakes with Chinese [5] and
US [6,7] nutritional recommendations
• Investigated nutrients:
Preliminary studies
• Effects of thirty elements on bone metabolism [8]
• The relevance of food composition data for nutrition
survey in rural Tibet: pilot study in the context of
Kashin-Beck Disease [9]
• Minerals and trace elements in traditional foods of
rural areas of Lhasa Prefecture, Tibet Autonomous
Region (P.R. China) [10]
Experimental design
• Cross-sectional survey
• 250 Children (aged 3 to 5) of Lhasa Prefecture (3
Counties) interviewed twice (2 seasons)
• Interactive multiple-pass 24-hour food recall
• Specific Food Composition Table
Results
Table 1. Distribution of children according to their age and county
County
n total
age
n male
n female
Lhünzub (L)
70
3
10
11
4
16
11
5
7
15
Maizhokunggar (M)
27
3
4
3
4
6
8
5
4
2
Nyêmo (N)
153
3
24
27
4
33
20
5
23
26
Total
250
127
123
Results
Table 2. Energy and water mean intakes by county and comparison with the Chinese and US recommendations
Nutrient County Mean StDev (%)# China RNI/AI
for 4 y/o US RDA/AI for 4-8 y/o China ULs for 4 y/o US ULs for 4-8 y/o Energy (kcal) L 1026a 428 71 1300-1600 1485-1642 - - M 995a,b 535 69 N 848b 455 58 Water (g) L 811a 386 48 - 1700 - - M 798a 334 47 N 606b 354 36
RNI: recommended nutrient intake; AI: adequate intake; RDA: recommended dietary allowance; ULs: upper limits
# Percent of China RNI/AI/ or US AI/RDA if Chinese value is missing
Results
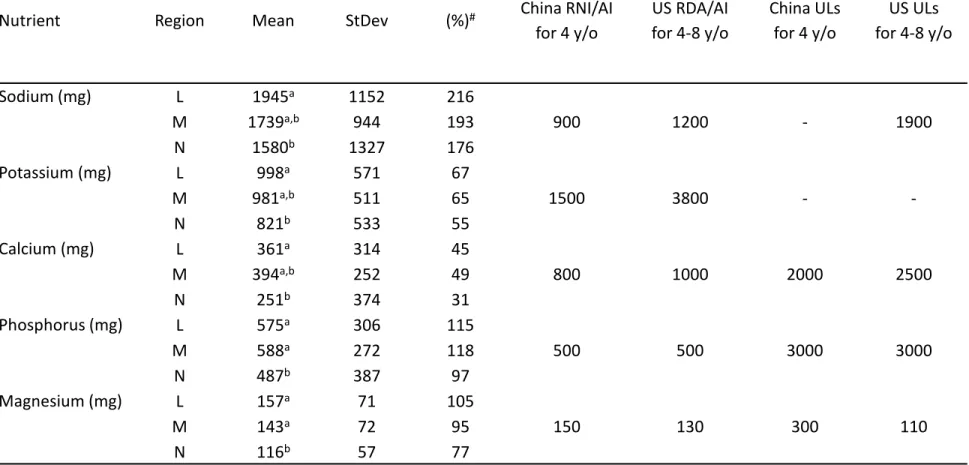
Table 3. Major elements mean intakes by county and comparison with the Chinese and US recommendations
Nutrient Region Mean StDev (%)# China RNI/AI
for 4 y/o US RDA/AI for 4-8 y/o China ULs for 4 y/o US ULs for 4-8 y/o Sodium (mg) L 1945a 1152 216 900 1200 - 1900 M 1739a,b 944 193 N 1580b 1327 176 Potassium (mg) L 998a 571 67 1500 3800 - - M 981a,b 511 65 N 821b 533 55 Calcium (mg) L 361a 314 45 800 1000 2000 2500 M 394a,b 252 49 N 251b 374 31 Phosphorus (mg) L 575a 306 115 500 500 3000 3000 M 588a 272 118 N 487b 387 97 Magnesium (mg) L 157a 71 105 150 130 300 110 M 143a 72 95 N 116b 57 77
RNI: recommended nutrient intake; AI: adequate intake; RDA: recommended dietary allowance; ULs: upper limits
# Percent of China RNI/AI/ or US AI/RDA if Chinese value is missing
a,b Values with the same letter present no significant differences, values with different letters present significant differences (P<0.05)
Results
Table 4. Minor elements mean intakes by county and comparison with the Chinese and US recommendations
Nutrient Region Mean StDev (%)# China RNI/AI
for 4 y/o US RDA/AI for 4-8 y/o China ULs for 4 y/o US ULs for 4-8 y/o Iron (mg) L 14,7a 10,1 122 12 10 30 40 M 12,0a,b 6,0 100 N 11,2b 10,4 93 Copper (mg) L 0,67a 0,28 67 1 0,44 2 3 M 0,72a 0,37 72 N 0,79a 1,10 79 Zinc (mg) L 4,9a 2,2 41 12 5 23 12 M 5,2a 4,2 44 N 3,6b 2,2 30 Selenium (µg) L 13a 8 50 25 30 180 150 M 14a 12 55 N 9b 9 36 Manganese (mg) L 2,5a 1,1 165 - 1,5 - 3 M 2,3a 1,0 153 N 1,7b 0,7 112
RNI: recommended nutrient intake; AI: adequate intake; RDA: recommended dietary allowance; ULs: upper limits
# Percent of RNI/AI/RDA
a,b Values with the same letter present no significant differences, values with different letters present significant differences (P<0.05)
Conclusions
Low intakes in:
– Energy
(58-71% of China AI)
– Water
(36-48% of US RDA)
– Potassium
(55-67% of China AI)
– Calcium
(31-49% of China AI)
– Copper
(67-79% of China AI)
– Zinc
(30-44% of China RNI)
– Selenium
(36-55% of China RNI)
High intakes in:
– Sodium
(176-216% of China AI)
Thank you for your attention !
References
1. Mathieu, F., and Hinsenkamp, M., 2008. Kashin-Beck disease. In: Malaisse, F., and Mathieu, F. eds. Big Bone Disease.
A multidisciplinary approach of Kashin-Beck disease in Tibet Autonomous Region (P.R. China). Gembloux: Les presses
agronomiques de gembloux, a.s.b.l., 11-18.
2. Li, S., et al., 2009. Soil selenium concentration and Kashin-Beck disease prevalence in Tibet, China. Frontiers of
Environmental Science & Engineering in China, 3 (1), 62-68.
3. Chasseur, C., et al., 2008. The mineral defiiency hypothesis. In: Malaisse, F., and Mathieu, F. eds. Big Bone Disease. A
multidisciplinary approach of Kashin-Beck disease in Tibet Autonomous Region (P.R. China). Gembloux: Les presses
agronomiques de gembloux, a.s.b.l., 101-103.
4. Malaisse, F., et al., 2008. Framework. In: Malaisse, F., and Mathieu, F. eds. Big Bone Disease. A multidisciplinary
approach of Kashin-Beck disease in Tibet Autonomous Region (P.R. China). Gembloux: Les presses agronomiques de
gembloux, a.s.b.l., 19-36.
5. National Institute of Nutrition and Food Safety China CDC. 2009. China Food Composition. 2nd ed. Beijing: Peking University Medical Press.
6. Intakes, S. C. S. E. D. R., et al., 2005. Dietary Reference Intakes for Energy, Carbohydrate, Fiber, Fat, Fatty Acids,
Cholesterol, Protein, and Amino Acids (Macronutrients). National Academies Press.
7. NAS. IOM. Food and Nutrition Board. Dietary Reference Intakes: Elements. Available from: http://www.nal.usda.gov/fnic/DRI/DRI_Tables/DRI_Elements.pdf [Accessed: 31/07/2015].
8. Dermience, M., Lognay, G., Mathieu, F., Goyens, P., 2015. Effects of thirty elements on bone metabolism. J. Trace Elem. Med. Biol. 32, 86–106. doi:10.1016/j.jtemb.2015.06.005
9. Dermience, M., et al., 2013. The relevance of food composition data for nutrition surveys in rural Tibet: pilot study in the context of Kashin-Beck Disease. Biotechnologie, Agronomie, Société et Environnement, 17 (1), 32-42.
10. Dermience, M., et al., 2014. Minerals and trace elements in traditional foods of rural areas of Lhasa Prefecture, Tibet Autonomous Region (P.R. China). Journal of Food Composition and Analysis, 35 (2), 67-74.