Treizième édition des Journées scientifiques
du Regroupement francophone pour la recherche et la formation sur le béton
(RF)
2B
_____________________________________________________________________________________________________ Lyon
5-6 juillet 2012
EFFET DE L'EMPILEMENT ET DE LA FORME DES ADDITIONS DANS
LES PROPRIÉTÉS DES LIANTS À MATRICE CIMENTAIRE
Huan HE, Luc COURARD, Frédéric MICHEL et Eric PIRARD
GeMMe Matériaux de construction, Département ArgEnCo, Université de Liège, Belgique
RÉSUMÉ : Mélanger le ciment avec des additions minérales, en particulier avec des sous-produits industriels, permet de réduire efficacement la consommation de ciment et de réduire son impact environnemental. Récemment, un concept novateur a été proposé en vue de remplacer les plus gros grains de ciment par les charges inertes, en vue du développement d’un ciment durable. En tant que mécanisme de base, l’empilement des particules joue un rôle important dans le remplacement ou le mélange. Dans la première partie de l'étude, l’empilement des grains de ciment, de filler calcaire (LF) et de ciment mélangé est abordé. Une nouvelle méthode, basée sur l’empilement en phase humide, est comparée à une méthode d'empilement à sec. La distribution de taille des particules (PSD) et la forme des particules des différentes poudres sont caractérisées sur base d’un système d'analyse d'image avancée. Le document présente les résultats des tests d’empilement avec l’influence du paramètre PSD, de la forme des particules, du type de ciment, de l’énergie de vibration, du mélange et du superplastifiant (Sp). Les avantages et les limites des deux méthodes sont également discutés.
ABSTRACT: Cement blending with mineral admixtures, especially with by-product or waste product
powder, can effectively reduce consumption of cement and promote the ecology. Recently, an innovative concept was proposed to replace of “coarse” cement grains by the inert fillers for sustainable cement in the low w/c concrete cement. As a basic mechanism, particle packing plays an important role in such replacement or blending. In the first part of study, the paper discusses the particle packing aspect of cement grains, limestone filler (LF) and LF blended cement. The new developed wet packing method and a dry packing method are proposed for the evaluation purpose. Particle size distributions (PSDs) and particle shape of different powders are firstly characterized by an advanced image analysis system. The paper presents results of packing tests with the influences of PSD, particle shape, cement type, vibration, mixing, superplasticizer (SP), blending proportions, etc. The advantages and limitations of two packing methods are also discussed in this paper.
1. INTRODUCTION
Nowadays, cement industry is given more and more attention to the environment concerns. Production of cement shares a heavy responsibility of global CO2 emissions. Partial replacement of cement with mineral
admixture is the most promising way to make concrete more ecological. Three main advantages may be considered when adding mineral powders: filler effect, nucleation sites development and chemical reactions. Blast furnace slags are used as hydraulic binders while fly ash and rice husk ash may develop pozzolanic reactions. Even if limestone filler (LF) is chemically inert, it modifies particle packing density (PD) of concrete by means of filler effect. As a result, a denser microstructure will improve the mechanical properties and durability performances of concrete.
High strength concrete requests a relatively low water to cement ratio (w/c). Even after many months, a quite large amount of cement cores remains unhydrated due to high compaction level and insufficient space for water ingress. These cement particles can however hydrate afterwards and produce a self-healing potential to resist against microcracking under some favorable conditions [He et al., 2009]. High proportions of unhydrated cement are mainly constituted with coarse cement grains. If a suitable proportion of coarse cement is replaced by limestone powder, working as inert filler, the properties of concrete should be same: this concept was early revealed by Bentz [Bentz and Conway, 2001; Bentz, 2005]. Fig. 1(a) shows the particle size distributions (PSDs) of different type of powders used in the study [Bentz, 2005]. Coarse cement (larger than 30 µm) was replacement by the same amount of coarse LF. The results show long-term compressive strength of reference cement and blended cement are in similar level [Bentz, 2005], see Fig. 1(b). By this way, low cement content make concrete more ecological. However, particle packing enhancement can be considered as the most important way to increase cement blending efficiency or partial replacement by inert fillers (e.g. LF).
Therefore, the first part of study focuses on the particle packing aspect of powder and blended powder materials. As two crucial factors for packing properties, particle size and shape of cement and LF are detailed and characterized by an advanced image analysis system in this study.
Dry packing methods are conventionally performed according to standard code BS 812-2 (1995). The uncompacted packing and compacted packing by blows of rod are specified in the code. A wet packing method was recently proposed by Wong and Kwan [2008] for packing measurement of powder materials. It has been successfully used for packing of powder materials, like cement, fly ash, silica fume [Kwan and Wong, 2008]. More detailed information is here introduced about procedure. In the wet process, particles can be packed with higher density by reducing the effects of inter-particle forces. The wet packing method measures the packing density of solid particles into a water matrix. Water is proportionally reduced by testing mixtures designed with a decreasing volume of water to binder (cement) ratio (uw) [Wong and Kwan 2008]. In each mixture, the required water is firstly mixed with half amount of binder for 3 minutes. Then, one quarter of the left half binder is added to the mixture and mixed for 3 minutes. The procedure is
(a) (b)
Fig. 1 (a). PSDs of different powder materials; (b) Measured (□ and ○) and model (lines) compressive strength development for original cement (solid line) and blended system (dashed line) mortars with
repeated for the left materials until all the binder is incorporated. The achieved paste is then filled into a standard cylinder for the volume (V) and weight (M) measurements. It is assumed that volume in the cylinder consists of three parts: volume of water (Vw), volume of solid binder (Vb) and volume of air (Va). But only mass of water (Mw) and mass of solid binder (Mb) contribute to the weight of cylinder. The wet packing method had been successfully applied in PD measurement of Portland cement (PC), pulverized fuel ash (PFA), condensed silica fume (CSF) [Kwan and Wong, 2008] and even crushed rock particles [Fung et al. 2009].
On the other hand, the dry packing method in the code can be modified by introducing vibration and compaction in order to reduce the influence of inter-particle forces. The packing tests are then performed by both this dry method and the wet packing method [Wong and Kwan 2008]. The influence of different parameters, e.g. particle size distribution (PSD), particle shape, vibration, inter-particle forces, mixing process, air contents, superplasticizer (SP), etc. on PD are extensively studied and discussed. The advantages and limitations of each method are also discussed in this paper. Finally, packing properties of blended cements with different proportions of LF are evaluated and discussed.
2. MATERIALS AND EXPERIMENTS
Two types of PC, characterized by coarser and finer cement particles, respectively, have been selected for the study: CEM I 42.5 (Holcim, Belgium) and CEM I 52.5 (CBR, Belgium). One typical Belgian limestone filler M1350 (Carmeuse, Belgium) is also used as mineral addition: it offer high CACO3 purity and its chemical components are listed in Table 1. As a reference, CEN standard sand is used in the dry packing test. The size range of sand is 0~2 mm and its particle size distribution (PSD) is completely according to the regulation of EN 196-1:2005. As the specific density is important for packing evaluation, it was determined by means of a pycnometer. The specific densities of LF, CEM I 52.5, CEM I 42.5 and the standard sand are 2.72 g/cm3, 3.23 g/cm3, 3.21 g/cm3, 2.66 g/cm3, respectively.
As particle size and shape are important for packing behavior, these three types of powders are analyzed by means of an advanced image analysis system: Pharma (Occhio SA, Belgium). The maximum resolution of the machine is 0.5 µm/pixel. A vacuum dispersion device is used for reducing the effect of agglomeration. Shape analysis may be processed in real time by this instrument.
Particle packing tests have been performed in dry and wet ways. The first series of tests follows the wet packing method described by Wong and Kwan [2008]. Packing properties of three types of materials are evaluated, respectively, in the wet state. Dry packing is based on the use of a steel cylinder (30 mm diameter) and a corresponding sized steel rod placed on the filled materials, which induces a 9.77 kPa pressure. This top rod helps to reduce loosing of particles [He, 2010]; this low compressive pressure will avoid any crushing of cementitious powders as it is much lower than their compressive strengths. The dry packing test is performed on a vibration table, which is commonly used for concrete vibration; vibration is attempted for reducing inter-particle forces and improving packing density. The vibration frequency and amplitude of the table are 50 Hz and 0.3 mm, respectively. Volume and PD of packed particles inside the cylinder can be easily calculated after measuring the depth of rod inside the cylinder. After evaluation of particle packing of purely components by the two different methods, packing tests have also been performed on different proportions of LF blended cement particles.
3. RESULTS AND DISCUSSION
3.1 Size and shape characterization
Size and shape of three powder materials are evaluated by an advanced static image analysis (SIA) system, i.e. Pharma. It is logically assumed that particles are lying on the most stable position on the glass plate after dispersion. The inner diameter is defined as the diameter of the maximum inscribed circle of a particle profile. It has been proved that inner diameter can precisely represents the sieve size of a particle [Pirard et al. 2004]. This image analysis method is also competitive compared with laser diffraction (LD) method [Michel et al. 2007] for the measurement of PSD.
Table 1. Chemical components of LF [%]
Calcite Dolomite (K2O, Al2O3, SiO2, Fe2O3, Cr2O3, TiO2, MnO2, PO4 3-, Other) 99.5 0.5 (0.02, 0.07, 0.22, 0.04, 0.001, 0.002, 0.01, 0.01, 0.08) 0 20 40 60 80 100 0.1 1 10 100 Size [µµµµm] P as s in g fr ac ti on [% ] LF CEM I 52.5 CEM I 42.5
Fig. 2 PSD of different types of materials (size was estimated by the inner diameter)
Figure 2 illustrates PSD of three types of powders by SIA. It seems LF has a wider and more linear size distribution in the log-chart. Differences of fineness between CEM I 42.5 and CEM I 52.5 can be easily identified in Fig.2. CEM I 52.5 contains higher amount of fine particles and a lower up-bound of particle size. The information of PSD is crucial for the analysis of packing results, which will be discussed later. Shape characteristics of each type of materials are further evaluated by the SIA method. The binary image examples of three types of powder are plotted in Fig. 3. Shape identification is not easy; but PSD differences, as aforementioned, can already be observed in Fig. 3. Compared with size identification, shape characterization requests higher amount of pixels to represent a particle. Therefore, only particles containing more than 500 pixels are selected in the analysis. The size of selected particles is ranged approximately from 6 µm. As shape evaluation is sensitive to the pixels quantity of single particle, wide size distributed particles are classified into several size ranges, e.g. 6~10 µm, 10~20 µm, 20~30 µm, 30~40 µm, 40~50 µm, etc. The comparison of shape characteristics is more meaningful within a narrow size range.
Some traditional shape parameters are then used for the evaluation. Elongation is one of the most popular parameters used in the shape analysis: it describes the relationship between width (b) and length (a), as shown in Fig. 4(a) (Eq. 1):
1
b
Elongation
a
= −
(1) A more elongated particle has a higher value of elongation (≤1). Circularity is defined as the ratio between equivalent circle perimeter and the perimeter of particle (P) (Eq. 2):
Circularity
4 A
2P
π
=
(2)where A is the projected area of a particle. It indicates the similarity degree of a particle to a disc, considering the smoothness of the perimeter. Circularity and elongation distributions of three powders with different size ranges are plotted in Fig. 4(b). Although coming from different factories and different finenesses, CEM I 42.5 and CEM I 52.5 have very similar circularity and elongation in a same size range.
LF CEM I 52.5 CEM I 42.5 Fig. 3 Examples morphological images of three types of powders
0 0.2 0.4 0.6 0.8 1 6.70 16.70 26.70 36.70 46.70
Average inner diameter [µµµµm]
D im en si o n v al u e
Circularity LF Circularity CEM I 52.5 Circularity CEM I 42.5 Elongation LF Elongation CEM I 52.5 Elongation CEM I 42.5
(a) (b)
Fig. 4(a) Length and width of an arbitrary shape, (b) distribution of circularity and elongation of particles in each size range of specimens
Generally, LF has also similar values of circularity and elongation in all size ranges as PC. However, large LF particles (>30 µm) tend to have slightly higher values of elongation but also lower circularity compared with PC grains. A more interesting phenomenon is that particles smaller than 10 µm have much higher elongation values for all the three types of materials. This phenomenon has also been observed by Holzer et al. [2010] in PC with X-ray tomography method. As the three materials are produced by the grinding process, this phenomenon may be due to the higher crushing degree of smaller particles. Smaller particles may be “chipped” off from the large ones inducing more elongated particles [Holzer et al., 2010]. Two other shape parameters, i.e. solidity and roundness, are also used for shape evaluation. Solidity is defined as ratio of particle area (A) to the area of the corresponding convex hull bounded particle (Ac,
shown in Fig. 5(a)). It measures the overall concavity of a particle. The similar parameter called convexity ratio was used by Mora and Kwan [Mora and Kwan, 2000] for shape characterization of coarse aggregates. It was found that convexity is one of the most important parameters affecting the packing density of aggregates [Mora and Kwan, 2000]. Roundness is also a useful parameter for describing the similarity degree of a particle to a circle. Unlike circularity, roundness considers the maximum Ferret diameter (χFmax, shown in Fig. 4(a)) in the equation (Eq.3):
2 max
4
FA
Roundness
πχ
=
(3)The distributions of solidity and roundness of three powders with different size ranges are shown in Fig. 5(b). Generally, the three types of materials have similar solidity and roundness within the same size range. Value of solidity is quite stable with the different size ranges. Similar to circularity, particles smaller than 10 µm offer lower roundness. This may also be due to their elongated shape as illustrated in Fig. 4(b) and described in [Mora and Kwan, 2000]. As roundness is an evaluation of the similarity degree to a disc from χFmax, the changes in values of roundness are much significant in comparison with values of
circularity for particles smaller than 10 µm.
100 µm 100 µm 100 µm
Length (a) Width (b)
0 0.2 0.4 0.6 0.8 1 5.00 15.00 25.00 35.00 45.00
Average inner diam eter [µµµµm]
D im en si o n v al u e
Solidity LF Solidity CEM I 52.5 Solidity CEM I 42.5 Roundness LF Roundness CEM I 52.5 Roundness CEM I 42.5
(a) (b)
Fig. 5(a) A convex hull bounding particle and (b) distribution of solidity and roundness of particles in each size range of specimens
From above results, it seems that, for the same size, LF has similar shape characteristics than cement grain. However, parameters used here above are based on global shape quantities (A, P, a, b, χFmax, etc.): shape is not described in a fractal way. For a better shape identification, a more advanced shape parameter, i.e. bluntness, is then defined. Bluntness describes the maturity of the particle in the abrasion process. The parameter has been investigated by geologists. Krumbein proposed a popular chart to quickly identify the bluntness of a particle in the practical use [Krumbein, 1941]. Bluntness is based on the accurate measurement of local curvature and comparison of average local radius with the maximum radius of the inscribed disc. A descriptor, called Calypter [Pirard, 1994], is used in this study. It indicates the center and radius of the maximum inscribed disc on each point of boundary (shown in Fig. 6(a)). Then, bluntness can easily be calculated by Eq. 4:
1
1
Bluntness
V
=
−
(4) in which,1
(1
max)
2 N i ir
V
N
r
=
∑
+
, ri is the radius of the maximum inscribe circle on point i and rmax is themaximum value of ri. High value of bluntness indicates high degree of abrasion.
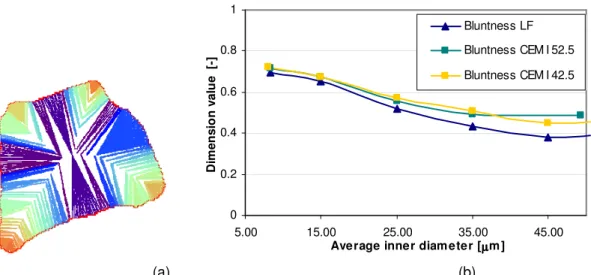
Figure 6(b) illustrates the distribution of bluntness of the three powders with different ranges of size. Compared with the results of other shape materials, the differences of average bluntness between LF and cement in the same size range are much more significant. The difference increases with increasing of particle size. Cement has higher bluntness compared with LF in the same size range. It may indicate that LF particle is more angular and rough. However, similarly to other parameters, the difference of bluntness between the two cements is negligible. It confirms again that PC can have similar shape characteristics although coming from different factories and having different finenesses. The decrease of bluntness with increasing particle size may be due to the increase of pixel numbers of particle profile and so increasing details of boundary with increasing particle size. Although elongation is dramatically increased for particles smaller than 10 µm, the change in bluntness is not so significant. It is because bluntness does not mainly depend on the elongation but on the asperities and pixel numbers. Compared with traditional shape parameters, bluntness can be used for a better identification of different type of materials.
0 0.2 0.4 0.6 0.8 1 5.00 15.00 25.00 35.00 45.00
Average inner diameter [µµµµm]
D im en si o n v al u e [ -] Bluntness LF Bluntness CEM I 52.5 Bluntness CEM I 42.5 (a) (b)
Fig. 6(a) the calypter of a arbitrary 2D shape and (b) distribution of Bluntness of particles in each size range of specimens 0.3 0.4 0.5 0.6 0.7 0.8 0 30 60 90 120 150 180 Vibration time [s] P ac ki n g d en si ty ( P D ) [-] Sand LF CEM I 52.5 CEM I 42.5
Fig. 7 Evolution of packing density with vibration time
3.2 Results of the dry packing tests
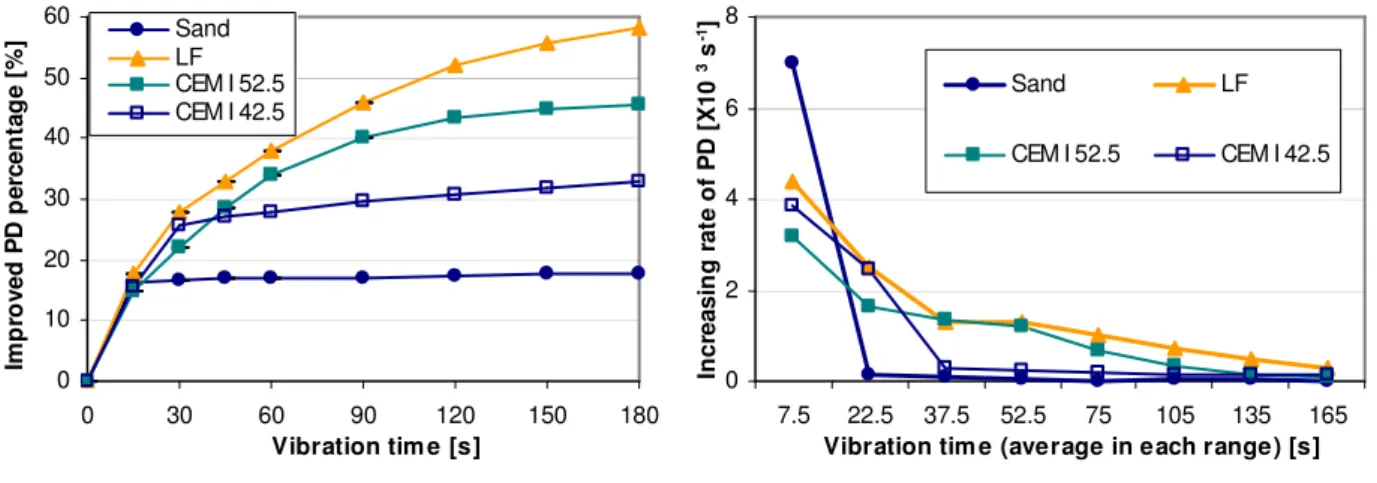
The three types of powders and the reference standard sand are tested with dry packing method. Results are presented in Fig. 7. Vibration has a great impact on particle packing density PD. PD generally increases with increasing vibration time for all the materials. However, increasing rate of PD depends on the type of material. Evolution of increasing PD percentage to the initial PD with vibration time is plotted in Fig. 8(a). Fig. 8(b) shows the evolution of average increasing rate of PD with vibration time. It appears that increasing rate of PD is the highest for all types of materials within the first initial 15 seconds of vibration; afterwards, the slope declines with vibration time. For sand, increasing rate of PD is much higher than for cements and LF in the initial 15 seconds. Further, there is almost no more evolution: the initial 15 seconds of vibration can improve 15.7% of initial PD and later 165 seconds of vibration can only further improve 2% of PD. Packing density of sand is always higher than for the other three powders, with or without vibration. The sand has indeed a wider PSD (0~2 mm), which may help for a better packing structure compared with materials with a narrow PSD.
Moreover, sand has a more rounded shape and thus a higher PD for a mono-sized packing [He et al., 2011]. As most of particles of sand are coarser than these three powders (<100 µm), the effects of
inter-particle forces on PD are negligible [Wong and Kwan, 2008; Piesch, 1997]. Sand inter-particles can easily find a stable positions and form a denser packed structure.
0 10 20 30 40 50 60 0 30 60 90 120 150 180 Vibration time [s] Im p ro ve d P D p er ce n ta g e [% ] Sand LF CEM I 52.5 CEM I 42.5 0 2 4 6 8 7.5 22.5 37.5 52.5 75 105 135 165
Vibration time (average in each range) [s]
In cr ea si n g r at e o f P D [ X 10 3 s -1] Sand LF CEM I 52.5 CEM I 42.5 (a) (b)
Fig. 8 Evolution of (a) Increased PD percentage to initial PD and (b) increasing rate of PD with vibration time Although LF has relatively lower bluntness, LF packing density is higher than for the two cement specimens, especially with vibration. It may indicate that PD of powders like LF is mainly influenced by the PSD and inter-particle forces. As LF has a wider PSD and is more linear in log-chart than cements, denser packed structure can be formed with LF grains. The increasing rate of PD of LF dramatically decreases in the first 30 seconds and slowly continues afterwards. In the first 30 seconds of vibration, packing density of LF has been improved up to 27.7%.
Packing density of CEM I 42.5 is generally higher than that of CEM I 52.5 with or without vibration. The difference in PD between CEM I 42.5 and CEM I 52.5 is larger within the first 60 senconds than in later150seconds. Increasing rate of PD of CEM I 42.5 is higher than of CEM I 52.5 in the first 30 seconds of vibration. Then it dramatically drops to a lower value (only slightly higher than the rate of sand) after 30 seconds of vibration. Improved PD of CEM I 42.5 is about 25.8% in first 30 seconds of vibration. The later 150 seconds of vibration only further improves up to 8.2% of PD. Compared with CEM I 52.5, CEM I 42.5 has a lower fineness. For instance, CEM I 42.5 has only 40% volume particles smaller than 20 µm (80% for CEM I 52.5). The influence of inter-particle forces is much less significant in CEM I 42.5 than in CEM 52.5. But, by means of vibration, the PD difference is gradually reduced with time. As CEM I 52.5 is the finest material tested is this study, the influence of inter-particle forces on PD is also the most significant. There is no obvious threshold value of the increasing rate of PD for CEM I 52.5.
As the increasing rate of all the materials is more or less constant in a low quantity after 180 seconds vibration, 3 minutes is selected as the required duration of vibration time in the dry packing method. As illustrated in Fig. 8(b) this required vibration time can be less for sand as well as for CEM I 42.5 (approximately 1 minute).
3.3 Results of the wet packing tests
Packing tests on the same materials were also performed according to the wet packing method [Wong and Kwan, 2008]. Each type of materials is tried to be mixed with different volume proportions of water. Water to binder ratio in volume (uw) is gradually reduced until the minimum void ratio or PD is found.
Packing density and void ratio are calculated based on [Wong and Kwan 2008]. Fig. 9(a) shows the distribution of voids ratio of the different materials with uw. The nominal line indicates the expected void
ratio without considering air content. When high uw (approximately>1.0), void ratio of three type of
materials is close to uw as air content in the paste is negligible. In this range, the paste is relatively
flowable. But with decreasing uw, the deviation between void ratio and uw increases. The paste gradually
becomes dry and air based pores are becoming also more and more important and visible: process of reducing uw induces also the process of reducing water content and increasing air content. The mixture
with the minimum void ratio has also the maximum packing density. The corresponding distributions of PD with uw are shown in Fig. 9(b). Similar to the above dry packing results, the maximum PD of LF
obtained by the wet packing method is higher than for the two types of cement and the maximum PD of CEM I 42.5 is higher than CEM I 52.5 as well.
0 0.3 0.6 0.9 1.2 1.5 0 0.2 0.4 0.6 0.8 1 1.2 u w [-] V o id r at io [ -] LF CEM I 52.5 CEM I 42.5 Nominal 0.3 0.4 0.5 0.6 0.7 0.8 0 0.3 0.6 0.9 1.2 1.5 u w [-] P ac ki n g d en si ty ( P D ) [-] LF CEM I 52.5 CEM I 42.5 Nominal (a) (b)
Fig. 9 Distribution of (a) void ratio and packing density with different volume ratio of water to binder (uw), the
nominal lines indicate the estimations without considering air in the systems.
3.4 Particle packing of LF blended cement
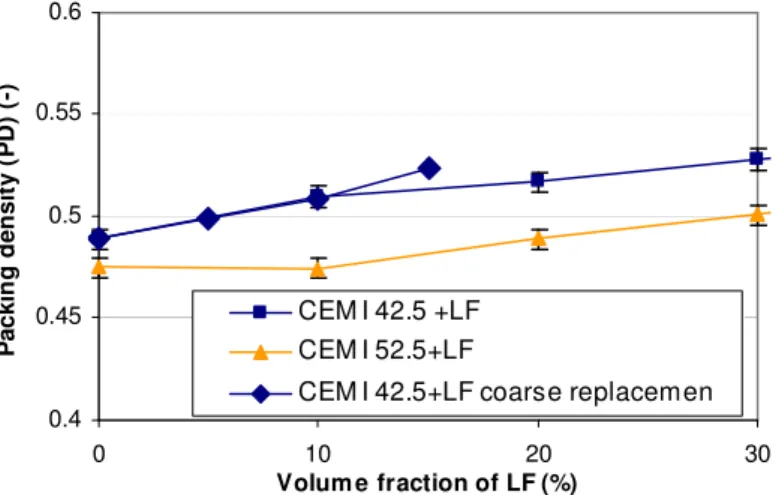
As a research topic of this study and with regard to the development of CEM II types, packing tests have also been carried out to assess the behavior of LF blended cements. The tests were performed with the dry packing method. Mixtures of blended cements with different volume proportions of LF (10%, 20% and 30%, respectively) are preliminary fully mixed into a mixer. Duration of vibration is selected to 180 seconds, according to the conclusions of the above tests. The final results are presented in Fig. 10. They show that PD is increased with increasing of LF volume fraction for both types of cement. This may be due to the higher PD of mono-LF particles. The positive effect of blending seems to be more significant for CEM I 42.5. As CEM I 42.5 is coarse than CEM I 52.5, it is selected for replacement tests of coarse cement by LF. Cement grains of CEM I 42.5 and LF particles are separated by a sieve of 40 µm. Different proportions of coarse cement (>40 µm) are replaced by the coarse LF (>40 µm). 15% is set as the maximum proportion of the replacement as only approximately 15% of initial CEM I 42.5 particles are larger than 40 µm. The dry packing tests are carried out for the mixtures with different proportion of coarse LF. The results are shown also in Fig. 10. Similar to the replacement above, Replacement of coarse cement by coarse LF can also improve the packing density of mixture. PD of mixture with 10% replacement of coarse cement by coarse LF is similar as PD of the blended cement mixture by LF. But PD of the mixture with 15% replacement of coarse cement by coarse LF is higher than that of 20% LF blended cement. It may because less influences of inter-particle forces by the replacement of coarse cement by LF than the total replacement. The results above show blending with LF or replacement of coarse cement by coarse LF can effectively improve packing density of mixture. Sometime, replacement of coarse cement by coarse LF has more advantages in PD than the total replacement. In order to find the optimum proportions of the blend, it will be necessary to investigate the workability and the properties of hardened blended cement paste or mortar. This will be discussed in the next paper.
4. CONCLUSIONS
This study focuses physical packing properties of two typical OPC, LF and LF blended cement. Particle size and shape were characterized by an advanced image analysis system. Particle packing are evaluated by the wet packing method as well as a proposed dry packing method. Some conclusions can be drawn from the study: Packing of fine particles is significantly influenced by the inter-particle forces
such as Van der Waals force or electrostatic force. This is obviously revealed by the comparison between packing densities of sand, LF and cement grains, respectively. Generally, the tested LF and PC have relatively similar particle shape on the base of shape analysis. Both fine LF and PC particles (<10 µm) are more elongated than large particles: it may due to the “chipping” process of small particles from big clinker grains. It is impossible to find differences between LF and OPC on the base of traditional shape parameters, e.g. elongation, compactness, roundness, solidity, etc. For the better shape identification, an advanced shape parameter, i.e. bluntness, has been used in this study.
0.4 0.45 0.5 0.55 0.6 0 10 20 30 Volume fraction of LF (%) P ac ki n g d en si ty ( P D ) (-) CEM I 42.5 +LF CEM I 52.5+LF
CEM I 42.5+LF coarse replacemen
Fig. 10 Dry packing density of LF blended cement (error bars indicate the variance for three tests). It can give more detailed shape information. LF particles have a lower bluntness compared with cement grains. This may be due to longer crushing process for limestone (from meter level) than for clinker (from centimeter level). Blending cement with LF can effectively improve the packing density of the binder. The higher amount of LF in mixtures can result a higher packing density of solid particles. But the optimization of blending need to evaluated the material properties after maturation.
5. ACKNOWLEDGEMENT
The first author would like to thank A. Van der Wielen and other GeMMe research engineers for their help in the experimental program. The authors also warmly appreciate the contribution of OCCHIO Company in performing particle shape analysis. This research program has been financially supported by University of Liège Research Foundation.
6. REFERENCES
Bentz D.P., Conway J.T., 2001, Computer modeling of the replacement of “coarse” cement particles by inert fillers in low w/c ratio concretes: hydration and strength, Cem. Concr. Res. 31(3): 503–506. Bentz D.P., 2005, Replacement of “coarse” cement particles by inert fillers in low w/c ratio concretes: II.
Experimental validation, Cem. Concr. Res. 35(1): 185–188.
Bonavetti V.L., Rahhal V.F., Irassar E.F., 2001, Study on the carboaluminate formation in limestone filler-blended cements, Cem. Concr. Res. 31: 853-859.
Fung W.W.S., Kwan A.K.H., Wong H.H.C., 2009, Wet packing of crushed rock fine aggregate, Mater.
Struct. 42: 631-643.
He H., 2010, Computational modelling of particle packing in concrete. PhD Thesis, Delft University of Technology, Delft.
He H., Courard L., Pirard E., Michel F., 2011, Characterization of fine aggregate in concrete by different experimental approaches, Proceeding of 13th International Congress for Stereology. Beijing.
He H., Guo Z., Stroeven P., Stroeven M., 2009, Numerical assessment of concrete's self-healing potential for promoting durability, Int. J. Model. Identif. Control. 7(2): 142-147.
Holzer L., Flatt R.J., Erdoğan S.T., Bullard J.W., Garboczi E.J., 2010, Shape comparison between 0.4–2.0 and 20–60 µm cement particles, J. Am. Ceram. Soc. 93:1626–1633.
Krumbein W.C., 1941, The effect of abrasion on size, shape and roundness of rock fragments. J. Geology, 49: 482-519
Kwan A.K.H., Wong H.H.C., 2008, Packing density of cementitious materials: part 2–packing and flow of OPC+PFA+CSF, Mater. Struct. 41: 773–784.
Michel F., Gregoire M.P., Pirard E., Size distribution of powder in range of 1 µm -100 µm: a comparison of static digital image analysis and laser diffraction, Proceeding of PARTEC 2007, Germany, 2007 Mora C.F., Kwan A.K.H., 2000, Sphericity, shape factor, and convexity measurement of coarse aggregate
for concrete using digital image processing, Cem. Concr. Res. 30: 351-358.
Piesch W., 1997, Size enlargement by agglomeration. In Fayed ME, Otten L(eds) Handbook of powder sciences and technology, Champman& Hall, New York.
Pirard E., 1994, Shape processing and analysis using the calypter, J. Microsc. 175: 214-221.
Pirard E., Vergara N., Chapeau V., 2004, Direct estimation of sieve size distribution from 2-D image analysis of sand particles, Proceeding of International congress for particle technology, Nuremberg, Gemany.
van Breugel K., 1997, Simulation of hydration and formation of structure in hardening cement-based materials, PhD thsis, Delft University of Technology, Delft University of Press, Delft.
Wong H.H.C., Kwan A.K.H., 2008, Packing density of cementitious materials: part 1–measurement using a wet packing method, Mater. Struct. 41: 689–701.

![Table 1. Chemical components of LF [%]](https://thumb-eu.123doks.com/thumbv2/123doknet/6879256.192953/4.892.100.811.170.485/table-chemical-components-of-lf.webp)