Prognostic Indices for Mortality of Hospitalized Children in Central Africa
Michele Dramaix,1 Daniel Brasseur,2 Philippe Donnen,3 Paluku Bawhere,4 Denis Porignon,3 Rene Tonglet,5 and Philippe Hennart13
A hospital-based follow-up study was conducted between 1986 and 1988 at Lwiro (South Kivu Province, Zaire). Of 1,129 children in the study, three of four were severely malnourished, and 17.4% died. This study analyzes the mortality in hospital; its objectives are to evaluate the prognostic power of edema and anthro-pometric and biologic indicators and to seek indices that perform better. Receiver operating characteristic curves were established for each parameter under study and for each index constructed. Areas under receiver operating characteristic curves were highest for biologic indicators, and simple indices, obtained by counting the number of risk factors present, performed best. In the absence of biologic parameters, the authors suggest classifying children as at risk of dying when they present with edema and/or with arm circumference of less than 115 mm. When biologic measurements are possible, in addition to edema and arm circumference, the authors suggest taking serum albumin and transthyretin into account. For serum albumin and transthyretjn, mortality risk is defined in terms of values of less than 16 g/liter and 6.5 mg/dl, respectively. Children will be classified as at risk of dying when they present with at least two of the four risk factors. The resulting diagnostic test has a high sensitivity (91.2%) and positive and negative predictive values of 40.8% and 97.9%, respec-tively. Am J Epidemiol 1996;143:1235-43.
child; hospitals; malnutrition; mortality; ROC curve
In previous hospital-based studies carried out in developing countries, various authors have found a close association between some anthropometric mea-surements and mortality in hospital (1-3). The asso-ciation in hospitals between mortality and biologic indicators such as serum albumin and serum trans-ferrin has seldom been analyzed, however, and the results do not always agree (4, 5). The indicators used in all of these studies were either anthropometric or classifications based on anthropometric indicators or were clinical or biologic ones, but the three types of indicators were not often used together or in
combi-Received for publication April 14, 1995, and in final form March 18, 1996.
Abbreviations: MUAC, mid-upper arm circumference; ROC, re-ceiver operating characteristic; QROC, quality rere-ceiver operating characteristic.
1 School of Public Health, Free University of Brussels (ULB),
Brussels, Belgium.
2 Queen Fabiola Children's University Hospital, Free University of
Brussels (ULB), Brussels, Belgium.
3 Scientific and Medical Center of the Free University of Brussels
(ULB) for its Cooperation Actions—Cemubac Team, Brussels (Bel-gium) and Kivu (Zaire).
4 Research Center in Natural Sciences, Lwiro, South Kivu, Zaire.
9 School of Public Health, Catholic University of Louvain,
Brus-sels, Belgium.
Reprint requests to Dr. Philippe Hennart, Laboratory of Epidemi-ology and Social Medicine, School of Public Health, Free University of Brussels (ULB), Route de Lennik, 808, B-1070 Brussels, Belgium.
nation. The approach adopted in these research studies was essentially based on the estimation of risk, and an analysis of the prognostic power of the indicators was seldom performed.
Outside hospitals, several community-based, obser-vational prospective studies have been carried out and reviewed recently (6, 7). In terms of public health, these have shown the impact of malnutrition on child mortality in developing countries. In some of the stud-ies reviewed, a diagnostic approach was considered (8-10); however, the only indicators of malnutrition used were anthropometric ones.
In South Kivu (eastern Zaire, Central Africa), all forms of protein energy malnutrition are frequently encountered, and many children present with maras-mus and edema at the same time. In a hospital-based follow-up study, for some admission values of vari-ous anthropometric, clinical, and biologic parame-ters, increased risk of mortality was observed (11, 12).
The present study has two objectives. The first is to analyze the prognostic power of edema and anthropo-metric and biologic parameters strongly associated with mortality, and the second is to seek combinations of these indicators that may lead to indices with better diagnostic properties.
at World Health Organization on June 11, 2014
http://aje.oxfordjournals.org/
MATERIALS AND METHODS
Sample, variables, and statistical methodology This study was conducted in South Kivu Province of Zaire, along the eastern border of the country. In these highlands, farmers live in a subsistence economy sys-tem, and their food supply is deficient in energy and proteins, with protein shortage being particularly se-vere at the end of the dry season and at the beginning of the rainy season before the harvest. Several publi-cations have described the nutritional status of the children in Kivu Province (13, 14). hi the work of Dr. Philippe Hennart (13), it was also observed that the mean serum albumin level was significantly lower for children who came from the rural area of South Kivu than for children who came from the urban area of the same region (28.6 vs. 32.2 g/liter); the prevalence of edema reached 4.4 percent in the rural area.
In North Kivu, data collected on children under age 5 years (14) have shown that between 50 and 70 percent were stunted, and 1-3 percent were wasted or wasted and stunted. The prevalence of edema reached 7 percent in the highest age groups. When the obser-vations made in North Kivu are compared with those made in South Kivu, it can be seen that the nutritional status was worst in the rural area of South Kivu. In North Kivu, 40-50, 62-76, and 7-10 percent of the children were situated below the fifth percentile of the international reference growth curves for weight for age, height for age, and weight for height, respec-tively, while in the rural area of South Kivu, these proportions were 61, 72, and 18 percent, respectively. About 500 children are admitted yearly to the chil-dren's hospital of Lwiro, South Kivu, and three of four suffer from clinical protein energy malnutrition. The clinical pattern of protein energy malnutrition was mainly kwashiorkor with or without marasmus. The highest fatality rate prevailed in edematous children with marasmus (15). In Central Africa, the main causes of death are hypovolemic shock, dehydration, electrolyte disturbances, and infectious complications (15, 16).
Between August 1986 and October 1988, 1,129 consecutively admitted children were included in a clinical follow-up study. A set of sociodemographic, clinical, and anthropometric data and serum albumin were collected on admission. For 238 children, serum transferrin, transthyretin, and retinol-binding protein were also measured. Mean duration of stay in hospital was approximately 26 days, but the median duration of stay was only 12 days.
The anthropometric indicators taken into account were weight for age, height for age, and weight for height, expressed as percentages of the median of local
growth curves (E. De Maeyer, World Health Organi-zation, 1959, unpublished data) or as z scores com-puted from international growth curves (17) and arm circumference. Weight was measured to the nearest 10 g. The scales used for weighing were calibrated every morning. Height was measured to the nearest millime-ter when the child was supine and to the nearest 2 mm in the standing position. Mid-upper arm circumference (MUAC) also was measured to the nearest millimeter with a plastic tape. From the clinical data, edema was chosen for inclusion in the analyses; it was categorized as absent, moonface or pretibial, or both. The presence of edema was determined by applying pressure for 30 seconds to the pretibial region. Retinol-binding pro-tein, serum transthyretin, serum transferrin, and serum albumin were chosen as biologic nutritional markers. The albumin was determined according to the method of Sonnet and Rodhain (18); the other proteins were measured using nephelometric techniques (19).
This work analyzes these variables and evaluates by means of receiver operating characteristic (ROC) curves their ability to discriminate between the chil-dren who will survive and those who will die during hospitalization.
The ROC curve is obtained by plotting the propor-tion of true positives or the sensitivity of a diagnostic test (the proportion of positive tests among the de-ceased in this case) against the proportion of false positives (the proportion of positive tests among the survivors) or 1 — specificity, with these two parame-ters estimated at different operating points. The diag-onal of the graph is called the "chance line" since its points correspond to equal proportions of false and true positives. The performance of a diagnostic test in terms of sensitivity and specificity will be better the higher the ROC curve is above the diagonal.
ROC curves have been established with C. E. Metz's FORTRAN program (20-23). For comparison of the indicators, the area under the ROC curves (24, 25) was estimated with the same program. Ranking of indicators was performed by simply considering the estimates of area under the ROC curves; no formal significance test was carried out to compare ROC areas. Edema and anthropometric and biologic param-eters were combined in indices. Two types of indices were considered. The first was obtained by weighting the component variables with coefficients estimated by logistic regression. At the final stage, three logistic regression models were established, including 1) arm circumference and edema; 2) arm circumference, edema, and serum albumin; and 3) arm circumference, edema, serum albumin, and transthyretin, respectively. In each of these three models, the coefficients of the included variables differed significantly from zero,
at World Health Organization on June 11, 2014
http://aje.oxfordjournals.org/
except for that of arm circumference in the third model. The absence of significance of the effect of arm circumference in the last model can be explained by the fact that this was established on the reduced sample of 238 subjects for whom that transthyretin was measured. Logistic regression was performed us-ing SPSS version 4.0 for UNIX (26). For the second type of index, to define categories corresponding to a higher risk of dying, continuous variables have been dichotomized. Two sets of cutoffs were chosen: the values of the variables corresponding to the maximum of the sum of sensitivity and specificity and the values corresponding to optimal efficacy (27), as described below. The indices were obtained by simply counting the number of risk factors present. In the two types of indices, edema was always included as two categories: present or absent.
From the newly constructed indices and on the basis of the quality criteria (27) described below, diagnostic tests have been proposed. The sensitivity and speci-ficity of these tests, the predictive value of a positive test result (the proportion of deaths among the positive tests), and the predictive value of a negative test result (the proportion of survivors among the negative tests) were computed.
Validation has been performed on the data collected in the hospital during the years 1989-1991.
Quality criteria for the characteristics of a diagnostic test
P will denote the proportion of deaths, and Q will denote the proportion of positive tests. Se and Sp denote the sensitivity and the specificity of the diag-nostic test, respectively.
Efficiency is the overall proportion of correct clas-sification that can be computed by
Se X P + Sp X (1 - P).
The quality of the sensitivity and specificity of the test will be expressed by a weighted kappa coefficient:
*(l,0) = (Se - Q)l{\ - Q) for sensitivity, and
*(0,0) = (Sp - (1 - Q))IQ for specificity.
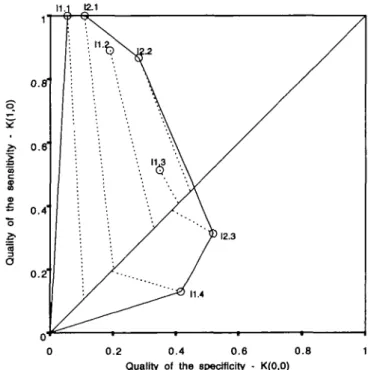
The graph obtained by plotting fc(l,0) against k(0,0) is called a QROC (quality receiver operating charac-teristic) curve. The optimally sensitive and specific tests are those corresponding to the highest and the right-most points, respectively, in the QROC plane. In the QROC curve, all tests for which Q = P lie along the diagonal line also called the "diagnosis line." The
QROC curve obtained for two indices combining MUAC, edema, serum albumin, and transthyretin is presented in figure 1.
The two indices of the kappa coefficients are related to cost-benefit factor. The quality of efficiency is defined by Cohen's kappa:
*(0.5,0) = - Q) X - P)Q
X *(0,0)]/[/>(l - Q) + (1 - P)Q\ The optimally efficient test will be the one for which £(0.5,0) is the maximum; choosing an optimally effi-cient test amounts to assigning equal importance to false negative and false positive. Graphically, so-called "0.5-projection lines" can be drawn between each test point and the diagnosis line; the highest intersection point indicates the optimally efficient test (27). For the two indices considered, the decision point was taken to be the optimally efficient test (12.2 on the QROC; figure 1).
RESULTS
Including early deaths (20 percent of the deaths occurred during the first 48 hours), 197 subjects, i. e.,
0.2 0.4 0.6 Quality of the specificity
-0.8 K(0,0)
FIGURE 1. Mortality in children hospitalized in Lwiro, Zaire, be-tween 1986 and 1988. Quality receiver operating characteristic of the indices combining edema, mid-upper ami circumference, serum albumin, and transthyretin. Indices obtained by counting the num-ber of risk factors present. For mid-upper arm circumference, serum albumin, and transthyretin, the cutoffs for Index 1 (11) were 125 mm, 21 g/liter, and 7.5 mg/dl, respectively, and for index 2 (12), they were 115 mm, 16 g/liter, and 6.5 mg/dl, respectively. The number after the period represents the number of risk factors that a child has to present to be declared at risk of dying.
at World Health Organization on June 11, 2014
http://aje.oxfordjournals.org/
17.4 percent of the 1,129 subjects admitted to hospital, died. The median age of the children was 27 months: Three quarters were age 5 years or under, and 45 percent were under age 2 (table 1). Nutritional status is described in table 1; a large proportion of the children had very low values for anthropometric and biologic parameters. About 30 percent of the subjects presented with edema on admission.
Among anthropometric parameters, weight for age expressed as percentage of the median of local growth curves had the best sensitivity for a given specificity, but its performance was similar to that of MTU AC and weight for age z score computed from the international growth curves. Among proteins, for serum albumin and serum transthyretin, ROC curves were almost superimposable. The ROC curve of serum transferrin was the highest, while that of retinol-binding protein
TABLE 1. Distribution (number and %) of age,
anthropometric and biologic parameters, and edema at the time of admission of the children hospitalized in Lwiro, Zaire, August 1986 to October 1988 Age (years) <1 1-<2 2-<5 £5
z score (international growth curves) Weight for age
< - 2 £ - 2
Weight for height
<-1.5 £-1.5 MUACf (mm) <115 115-124 12S-134 £135
Serum albumin (g/liter) <16 16-<23 23-<30 £30 TTR (mg/dl) <6.5 £6.5 Edema None Pretibial Face Pretibial + face No.' 303 201 330 278 678 404 394 546 176 162 212 505 216 260 320 236 67 170 792 175 24 127 % 27.2 18.1 29.7 25.0 62.7 37.3 41.9 58.1 16.7 15.4 20.1 47.9 20.9 25.2 31.0 22.9 28.3 71.7 70.8 15.7 2.1 11.4
was near the chance line. These observations were corroborated by the estimations of the area under the ROC curve for each indicator, which are presented in table 2. Serum transferrin, serum transthyretin, and retinol-binding protein have been measured only in a subsample of 238 children, of whom 39 (16.4 percent) died. This explains the lower precision of the esti-mated areas for these variables. Edema noted just as present or absent had a sensitivity of 57.2 percent and a specificity of 76.7 percent, and when the four cate-gories of edema were taken into consideration, the area under the ROC curve was the same as that for serum albumin.
From the anthropometric indicators, MUAC was selected for inclusion in the indices, first, because its ROC area was one of the highest and, second, because indices including MUAC had a slightly better per-formance than did those that included weight for age expressed as a percentage of the median of the local growth curves as well as a z score computed from the international curves. Among biologic indicators, se-rum albumin and sese-rum transthyretin proved to give the combinations with the best performance.
The area estimated under the ROC curves for the different indices constructed with edema, MUAC, se-rum albumin, and sese-rum transthyretin (table 3) indi-cated that the index based simply on the number of risk factors (continuous indicator value under a single cutoff; edema present) presented by a child performed at least as well as and often better than the more complex index based on logistic regression. As
de-TABLE 2. Area and standard deviation under the ROC* curves for anthropometric and biologic parameters and for edema at the time of admission in mortality detection of the children hospitalized in Lwiro, Zaire, August 1986 to October 1988
• Because of missing data, the number of subjects is different for
each variable and is less than 1,129, the total number of children included in the sample. Serum transthyretin (TTR) has been measured in a reduced sample.
t MUAC, mid-upper arm circumference.
Edema
% median of local growth curves Weight for age
Height for age Weight for height
/score (international growth curves) Weight for age
Height for age Weight for height MUAC* (mm) Serum albumin (g/liter) Serum transferrin (mg/dl) Serum TTR* (mg/dl) Retinol-binding protein (mg/dl) Area under ROC curve 0.760 0.698 0.673 0.614 0.682 0.662 0.618 0.684 0.765 0.827 0.753 0.611 <SD«) (0.022) (0.020) (0.022) (0.025) (0.021) (0.022) (0.025) (0.022) (0.019) (0.036) (0.041) (0.050) * ROC, recerveroperating characteristic; SD, standard deviation; MUAC, mid-upper arm circumference; TTR, transthyretin.
at World Health Organization on June 11, 2014
http://aje.oxfordjournals.org/
TABLE 3. Area and standard deviation under the ROC* curves for indices combining edema, arm circumference, serum albumin, and transthyretin at the time of admission in mortality detection of the children hospitalized in Lwiro, Zaire, August 1986 to October 1988 (training set)
Logistic regression-based indices MUAC* + edema
MUAC + edema + serum albumin MUAC + edema + serum albumin
+ TTR*
Indices equal to the number of risk factors present
Edema, MUAC <125 mm Edema, MUAC <115 mm Edema, MUAC <125 mm, serum
albumin <21 g/Iiter
Edema, MUAC <115 mm, serum albumin <16 g/liter
Edema, MUAC <125 mm, serum albumin <21 g/Iiter, TTR <7.5 mg/cfi
Edema, MUAC <115 mm, serum albumin <16 g/liter, TTR <6.5 mg/dl Area under ROC curve 0.777 0.822 0.858 0.792 0.800 0.816 0.827 0.860 0.900 (SO*) (0.019) (0.017) (0.032) (0.020) (0.019) (0.018) (0.017) (0.029) (0.024) • ROC, receiver operating characteristic; SD, standard deviation; MUAC, mid-upper arm circumference; TTR, transthyretin.
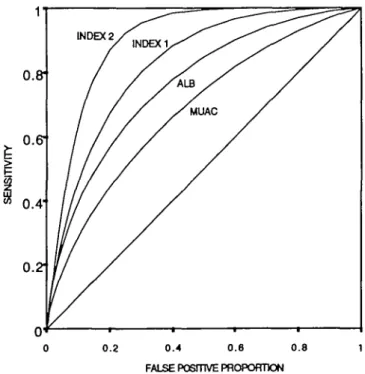
(ROC area, 90 percent) (table 3). The ROC curves for the indices are shown in figure 2 along with the ROC curves for MUAC and serum albumin alone. This figure shows the improvement in diagnosis of death brought about by the indices.
At this stage of the analysis, from the defined indi-ces with good performance, the problem lies in choos-ing a decision level from which special treatment guidelines may be derived.
As a first step, the problem was approached without recourse to biologic indicators, since such measure-ments are sometimes difficult to obtain. Of the two indices combining edema and MUAC, the one with cutoff at 115 mm for MUAC had the highest ROC area and led to the diagnostic test with the best values of sensitivity and specificity (figure 3).
When biologic measurements are possible, a better diagnostic test can be constructed by including serum albumin and serum transthyretin.
This test was derived from the index combining edema and MUAC, serum albumin, and serum trans-thyretin with cutoffs of 115 mm, 16 g/liter, and 6.5 mg/dl, respectively, and by classifying a child as at risk of dying as soon as he or she presented with at least two of the four risk factors (figure 4).
scribed in Materials and Methods, two methods were applied to derive cutoffs. The first of these methods (maximum of the sum of sensitivity and specificity) produced thresholds equal to 125 mm, 21 g/liter, and 7.5 mg/dl for MUAC, serum albumin, and serum transthyretin, respectively. The second, based on the kappa coefficient of optimal efficacy, produced thresholds equal to 115 mm, 16 g/liter, and 6.5 mg/dl, respectively. Since cutoffs obtained with the second method were the lowest, the corresponding diagnostic tests were less sensitive and more specific than the were tests constructed with the first series of cutoffs. The highest ROC areas were those of the indices obtained with a cutoff to define risk for continuous indicators fixed at a low level (115 mm for MUAC, 16 g/liter for serum albumin, and 6.5 mg/dl for serum transthyretin) (table 3). The index including only edema and MUAC showed an improvement in ROC area of approximately 12 percent relative to MUAC alone and 4 percent relative to edema alone. Including age or other clinical signs such as diarrhea, hair anom-alies, skin infection, or malaria did not improve the performance of the index. On the other hand, adding serum albumin to the index that included arm circum-ference and edema further increased the ROC area by 3 percent. Finally, the addition of serum transthyretin led to the index with the best sensitivity and specificity
0.8"
0.61
0.41
0.21
0.4 0.6 0.8
FALSE POSmVE PROPORTION
FIGURE 2. Mortality in children hospitalized in Lwiro, Zaire,
be-tween 1986 and 1988. Receiver operating characteristic curves for mid-upper arm circumference (MUAC), serum albumin (ALB), and Indices obtained by counting the number of risk factors present (index 1: edema, MUAC < 115 mm, and albumin < 16 g/liter, index 2: same indicators with the same cutoffs and transthyretin < 6.5 mg/dl).
at World Health Organization on June 11, 2014
http://aje.oxfordjournals.org/
MUAC < 115 mm AND/OR oedema (42%) TEST + MUAC > = 115 mm AND no oedema (58%) TEST-Se : 80.5% (3.1%) Sp : 65.2% (1.6%) PVP : 30.8% (2.2%) PVN : 94.5% (0.9%)
FIGURE 3. Mortality in children hospitalized in Lwiro, Zaire, be-tween 1986 and 1988. Classification of the children as positive (at risk of dying) or negative on the basis of edema and mid-upper arm circumference (MUAC). Characteristics (standard error) of the re-sulting diagnostic test. Se, sensitivity; Sp, specificity; PVP, predic-tive value of a posipredic-tive test result; PVN, predicpredic-tive value of a nega-tive test result.
DISCUSSION
The relation between malnutrition and mortality has been studied by many authors in different regions; it has sometimes been analyzed by using a diagnostic approach in observational, prospective, community-based studies. Stressing the fact that for screening, the best indicator was the one for which sensitivity was higher for high values of specificity, Bairagi (8) again analyzed the data of Chen et al. (28) collected in Bangladesh. Other authors, such as Alam et al. (9) in Bangladesh and Briend et al. (10) in Senegal, also estimated the sensitivity and specificity of their indi-cators in similar studies. In all of these reports, the indicators considered were only anthropometric ones. For example, for MUAC and for a specificity of 80 percent, the observed sensitivities were about 40-45, 55, and 50 percent in the works of Bairagi (8), Alam et al. (9), and Briend et al. (10), respectively.
This may also prove to be very interesting in a hospital context. For example, Briend et al. (2) have compared the sensitivity and specificity of several anthropometric parameters for the mortality of mal-nourished children hospitalized in Dhaka, but this ap-proach is not very frequent. For comparison with the results of the above-mentioned community-based studies, it can be noted that in the hospital-based study by Briend et al. (2), the sensitivity of MUAC was about 45 percent for a specificity of 80 percent.
We have used this sensitivity-specificity approach for the data collected in 1986-1988 at the pediatric hospital in Lwiro, in South Kivu (Zaire). For this
period, the proportion of deaths during hospitalization was 17.4 percent. The predictive performance of edema and of biologic parameters was better than that of the anthropometric parameters. This is in agreement with the results derived by other methods of analysis, which had already revealed the important effect on mortality of serum albumin as well as the significant contributions of edema and MUAC (11, 29).
The area under the ROC curve of weight for age expressed as a percentage of the median of the local growth curves was the greatest, but it was only slightly greater than that under the ROC curves of MUAC and z score weight for age computed from the international growth curves. ROC curves for height for age were a little below, while those for the weight for height remained well below. These results largely correspond to the observations made in Dhaka by Briend et al. (2). The area under the ROC curve of edema was approx-imately equal to that of serum albumin. Among bio-logic parameters, serum transferrin had the best per-formance, and retinol-binding protein had the worst. These results regarding retinol-binding protein also agree with those obtained by other methods from the same data (12). Serum albumin and serum transthyre-tin performed nearly equally well, but neither was as good as serum transferrin.
In this region of central Africa where children are observed with both severe kwashiorkor and marasmus, these different anthropometric, clinical, and biologic indicators are needed to characterize the severity of protein energy malnutrition. Does the grouping of some of these parameters in an index lead to improve-ment in the diagnosis with respect to individual pa-rameters?
Different classifications combining some of these parameters were used previously to define the nutri-tional status of the children in developing countries. For example, Waterlow's classification (30) combines two anthropometric parameters, height for age and weight for height, and the classifications of Gomez et al. (1) and the Wellcome Trust Working Party (31) are based on an anthropometric indicator (weight for age) and a clinical indicator (edema). The classification of McLaren et al. (32) leads to a score obtained on the basis of serum albumin and clinical signs including the presence of edema. In their community-based study conducted in Zaire, Van den Broeck et al. (33) ana-lyzed clinical-anthropometric mismatch. They took into consideration both anthropometric indicators and clinical malnutrition signs to analyze mortality and morbidity. In their conclusion, they emphasized the importance of the clinical diagnosis that should prevail when the child has a normal weight. None of the above-mentioned classifications considers the three
at World Health Organization on June 11, 2014
http://aje.oxfordjournals.org/
MUAC >=. 115 mm AND no oedema (49%) TEST - ? VIUAC < 115 mm OR oedema (46%) MUAC < 115 mm AND oedema (5%) TEST +
Serum albumin and TTR dosage
ALB > = 16 g/l A N D / O R TTR > = 6.5 mg/dl (100%) TEST-ALB < 16 g/l AND TTR < 6.5 mg/dl (0%) TEST + ALB > = 16 g/l AND TTR > = 6.5 mg/dl (35%) TEST-ALB < 16 g/l A N D / O R TTR < 6.5 mg/dl (65%) TEST + Se : 91.2% (4.9%) Sp : 75.7% (3.2%) PVP : 40.8% (5.6%) PVN : 97.9% (1.2%)
FIGURE 4. Mortality in children hospitalized in Lwiro, Zaire, between 1986 and 1988. Flowchart for the classification of the children as
positive (at risk of dying) and negative on the basis of edema, mid-upper arm circumference (MUAC), serum albumin (ALB), and transthyretin (TTR). Characteristics (standard error) of the resulting diagnostic test. Se, sensitivity; Sp, specificity; PVP, predictive value of a positive test result; PVN, predictive value of a negative test result.
types of indicators—anthropometric, clinical, and bi-ologic—simultaneously. Gomez's classification (1) was established on the basis of the analysis of the different parameters according to mortality in hospital; the other classifications have been used to estimate the risk of death in hospital or of malnourished children outside the hospital. None of these classifications is based on the diagnostic performance of the indicators. In Lwiro, indices constructed on the basis of an anthropometric parameter, edema, and biologic pa-rameters produced substantial improvements in dis-criminating between the children who were going to die and those who would be discharged, in comparison with each indicator taken separately.
MUAC was the anthropometric indicator chosen for inclusion in the indices. This choice was guided by the fact that, as was shown in other work (9, 10, 34), MUAC was able to discriminate between the children who would survive and those who would not and because it had been used in constructing good indices. Moreover, as emphasized in other studies on malnu-trition (2), MUAC is simple to measure and easier to obtain than weight for age or height for age, for example, which require the use of growth curves.
Edema, both a clinical sign and an indicator of the severity of protein energy malnutrition, was included in the indices.
Serum albumin is primarily used to define protein deficiency in clinical practice (35, 36). It is measured
routinely at Lwiro hospital and is available for the entire sample in this study. For these reasons in par-ticular, serum albumin was selected for inclusion in the indices. Furthermore, we observed that combining serum transthyretin with MUAC and edema led to the same results as combining serum albumin with MUAC and edema. However, including serum transthyretin in addition to edema, MUAC, and serum albumin led to even better quality of the indices constructed. Since serum albumin and serum transferrin were strongly correlated (Pearson correlation coefficient: r = 0.68; p < 0.001), it appeared that the indices with either had virtually the same performance.
Different methods were used to obtain indices; lo-gistic regression should theoretically weight each vari-able optimally to predict mortality. However, the re-sulting score requires the simultaneous measurement of all component indicators and relatively complex computation. In contrast, a score based on a count of the number of risk factors that a child presents is quick and simple to obtain. Furthermore, in this diagnostic procedure, the component indicators do not have to be measured simultaneously. Finally, in general, ROC areas were greater for the simple indices than for logistic regression-based indices (table 3).
On the basis of the ROC curves, it has been ob-served that an improvement of the diagnosis can be achieved by the consideration of MUAC, edema, se-rum albumin, and sese-rum transthyretin. From the
at World Health Organization on June 11, 2014
http://aje.oxfordjournals.org/
ces including these four indicators, the problem is then to choose a diagnostic test. In fact, different diagnostic tests more or less sensitive or specific or of more or less good quality of efficiency (estimated by assigning equal importance to the two types of misclassifica-tions) could be constructed. The diagnostic test chosen was the optimally efficient one, which had also a very high quality of sensitivity. The result of this diagnostic test will be positive as soon as a child is classified at risk for at least two of the four indicators. As shown in figure 4, with the test so constructed, decisions can be taken in two steps. The first one consists in noting at admission the presence or absence of edema and mea-suring MUAC. If MUAC is less than 115 mm and edema is present, the result of the test is positive, and the other measurements do not have to be carried out. Blood has to be taken only in the remainder of the sample (still 95 percent of the admitted children (fig-ure 4)). For these children, the result of the test will depend on whether or not serum albumin and serum transthyretin are lower than 16 g/liter and 6.5 mg/dl, respectively (figure 4).
When it is not possible to measure biologic indica-tors, we suggest classifying a child as at risk of dying when he or she presents with edema and/or with MUAC < 115 mm at admission to the hospital (figure 3).
The case-fatality rates in hospital of children with protein energy malnutrition vary from 9 to 51 percent (36). As stated by Waterlow, "comparisons between different centers are clearly inappropriate, because of the differences in the criteria for admission and the prevalence and type of infections, as well as in the facilities" (36, 164-165).
In the region of our study, protein energy malnutri-tion is frequent and severe; therapeutic management depends on local conditions, but efforts are made to improve therapeutic care. Thus, in 1994, the propor-tion of deaths observed during hospitalizapropor-tion on a
sample of 738 admitted children was 10.4 percent. However, this proportion may vary according to the type and severity of protein energy malnutrition in hospitalized children. Our approach has the advantage of demonstrating possible improvements since it re-duces the influences of the variations related to the nutritional status of the hospitalized children, a status that depends on the different factors included in our indices.
Serum transthyretin was no longer measured in the years after those studied in this investigation. Conse-quently, validation of our results could only be per-formed for edema, MUAC, and serum albumin and for indices including these three indicators. ROC areas were smaller in the validation set for both individual indicators and indices, although the difference was slight for MUAC (table 4). These effects could per-haps be explained by different reasons, such as the characteristics of the admitted children, their age, and their condition at admission. In fact, between 1989 and 1991, the observed proportion of deaths in the hospital was 14.6 percent, slightly lower than that during the study period.
The relative importance of the different components of protein energy malnutrition, like the essential asso-ciated deficiencies, may vary strongly from one region to another. To validate this particular combination of indicators, similar studies in other regions affected by malnutrition (for example, other countries from central or north Africa) will be of primary interest. Neverthe-less, as biologic indicators are included in the index, the values of the cutoffs will perhaps have to be modified according to the techniques of determination. In the reduced sample (218 subjects) in which val-ues for the four parameters included in the index were available, it was observed that among the children without edema and with MUAC less than 115 mm, none had low serum albumin and low serum transthy-retin (cutoffs, 16 g/liter and 6.5 mg/dl, respectively). If TABLE 4. Area and standard deviation under the ROC* curves for arm circumference, serum albumin,
and edema at the time of admission and different indices combining the three indicators in mortality detection of the children hospitalized in Lwiro, Zaire, August 1986 to October 1988 (training set) and between 1989 and 1991 (validation test)
Area underneath ROC curve
Arm circumference Serum albumin Edema
Indices equal to the number of risk factors present Edema, MUAC* <115 mm
Edema, MUAC <115 mm, serum albumin <16 g/liter
* ROC, receiver operating characteristic; SD, standard deviation; MUAC, mid-upper arm circumference. 86-88 0.684 0.765 0.760 0.800 0.827 (SO*) (0.022) (0.019) (0.022) (0.019) (0.017) 89-91 0.664 0.696 0.677 0.726 0.745 (SO») (0.020) (0.021) (0.037) (0.024) (0.025)
at World Health Organization on June 11, 2014
http://aje.oxfordjournals.org/
this observation could be verified, it would be neces-sary to take blood from only less than half of the children admitted (figure 4). It would therefore be very interesting to check the model presented in figure 4 by recording serum transthyretin in a new sample of children admitted to the Lwiro hospital.
If the validity of the model that we propose is proven, it will be possible to identify in a more precise and standardized way the children with a higher risk of death. More particularly, this should allow the hospital teams to assess the quality of their work better or to test new therapeutic methods. All of these approaches might finally lead to improving the management of children hospitalized with protein energy malnutrition.
ACKNOWLEDGMENTS
This research was partially supported by grant 3.4532.86 from the Belgian Fund of Scientific and Medical Research. The authors thank the David and Alice Van Buuren Foundation for their financial support and Dr. C. E. Metz for his FORTRAN program.
REFERENCES
1. Gomez F, Galvan RR, Frenk S, et al. Mortality in second and third degree malnutrition. J Trop Pediatr 1956;2:77-83. 2. Briend A, Dykewicz C, Graven K, et al. Usefulness of
nutri-tional indices and classifications in predicting death of mal-nourished children. BMJ 1986;293:373-5.
3. Beau J-P, Garenne M, Diop B, et al. Diarrhoea and nutritional status as risk factors of child mortality in a Dakar hospital (Senegal). J Trop Pediatr 1987;33:4-9.
4. Hay RW, Whitehead RG, Spicer CC. Serum-albumin as a prognostic indicator in edematous malnutrition. Lancet 1975; 2:427-9.
5. Reeds PJ, Laditan AO. Serum albumin and transferrin in protein-energy malnutrition. Their use in the assessment of marginal undernutrition and the prognosis of severe undernu-trition. Br J Nutr 1976;36:255-63.
6. Shroeder DG, Brown KH. Nutritional status as a predictor of child survival: summarizing the association and quantifying its global impact. Bull World Health Organ 1994;72:568-79. 7. Pelletier DL. The relationship between child anthropometry
and mortality in developing countries: implications for policy, programs and future research. J Nutr 1994;124 (Suppl. 10): 2047S-81S.
8. Bairagi R. On validity of some anthropometric indicators as predictors of mortality. Am J Clin Nutr 1981;34:2592-4. 9. Alam N, Bogdan W, Rahaman MM. Anthropometric
indica-tors and risk of death. Am J Clin Nutr 1989;49:884-8. 10. Briend A, Garenne M, Maire B, et al. Nutritional status, age
and survival: the muscle mass hypothesis. Eur J Clin Nutr 1989;43:715-26.
11. Dramaix M, Hennart P, Brasseur D, et al. Serum albumin concentration, arm circumference, and edema and subsequent risk of dying in children in central Africa. BMJ 1993;307: 710-13.
12. Brasseur D, Hennart Ph, Dramaix M, et al. Biological risk factors for fatal protein energy malnutrition in hospitalized children in Zaire. J Pediatr Gastroenterol Nutr 1994; 18: 220-4.
13. Hennart P. L'allaitement matemel en situation nutritionnelle critique: adaptations et limites. (In French). Ph.D. Thesis. Brussels, Belgium: University Libre de Bruxelles, 1983. 14. Tonglet R, Katulanya-Isu, Chiabrera F, at al. Pattern of
at-tained growth in 0 to 5 year-old children from Kivu (Zaire). Ecol Food Nutr 1991 ;26:215-26.
15. Vis HL. On the treatment of certain forms of protein-energy malnutrition in childhood with respect to fatal complications (an example from rural Central Africa). Ann Nestle 1985;43: 19-30.
16. Viart P. Haemodynamic findings in severe protein-caloric malnutrition. Am J Clin Nutr 1977;30:334-48.
17. National Center For Health Statistics. National Center for Health Statistics growth curves for children birth-18 years, United States. Washington, DC: US Department of Health Education and Welfare, 1977. (Vital and health statistics, Series II, no. 165) (DHEW publication no. (PHS) 78-1650). 18. Sonnet J, Rodhain J. Etudes des prot£ines s6riques par l'61ec-trophorese sur papier. I. Techniques et r6sultats normaux. (In French). Rev Beige Pathol 1952:22:226-40.
19. Connors LH, Gertz MA, Skinner M, et al. Nephelometric measurements of human serum prealbumin and correlation with acute-phase proteins CRP and SAA: results in familial amyloid polyneuropathy. J Lab Clin Med 1984;104:538-45. 20. Dorfman DD, Alf E. Maximum likelihood estimation of pa-rameters of signal detection theory and determination of con-fidence intervals—rating method data. J Math Psychol 1969; 6:487-96.
21. Metz CE. Basic principles of ROC analysis. Semin Nucl Med 1978;8:283-98.
22. Swets JA, Pickett RM. Evaluation of diagnostic systems: methods from signal detection theory. New York, NY: Aca-demic Press, Inc., 1982.
23. Hanley JA, McNeil B. The meaning and use of the area under a receiver operating characteristic (ROC) Curve. Radiology 1982;143:29-36.
24. Erdreich LS, Tee ET. Use of relative operating characteristic analysis in epidemiology. A method for dealing with subjec-tive judgement. Am J Epidemiol 1981;114:649-62.
25. Brownie C, Habicht J-P, Cogill B. Comparing indicators of health or nutritional status. Am J Epidemiol 1986; 124:
1031-44.
26. Norusis MJ, ed. SPSS INC. Chicago, JL: SPSS Statistical Data Analysis, 1990.
27. Kraemer HC. Evaluating medical tests. Objective and quanti-tative guidelines. Newbury Park, CA: Sage publications, 1992.
28. Chen LC, Chowdhury A, Huffman SL. Anthropometric as-sessment of protein-energy malnutrition and subsequent risk of mortality among preschool aged children. Am J Clin Nutr
1980;33:1836-45.
29. Dramaix M, Hennart P, Paluku, et al. Valeur des indicateurs nutritionnels pour le pronostic de la mortality intra-hospitaliere chez les enfants du Kivu (French). Rev Epidemiol Sante Publique 1993.41:131-8.
30. Waterlow JC. Classification and definition of protein-calorie malnutrition. BMJ 1972;3:566-9.
31. Wellcome Trust Working Party. Classification of infantile malnutrition. Lancet 1970;2:302-3.
32. McLaren DS, Pellet PL, Read WWC. A simple scoring system for classifying the severe forms of protein-calorie malnutrition in early childhood. Lancet 1967; 1:533-5.
33. Van den Broeck J, Meulemans W, Eeckels R. Nutritional assessment: the problem of clinical-anthropometrical mis-match. Eur J Clin Nutr 1993;48:60-5.
34. Trowbridge FL, Sommer A. Nutritional anthropometry and mortality risk. Am J Clin Nutr 1981:34:2591-2.
35. Alleyne GAO, Hay RW, Picou DI, et al. Protein-energy mal-nutrition. London, England: Edward Arnold, 1977.
36. Waterlow JC. Protein energy malnutrition. London, England: Edward Arnold, 1992.
at World Health Organization on June 11, 2014
http://aje.oxfordjournals.org/