Faculty of Sciences
Department of Chemistry
OB
IAC
HEMGroup
Development of multidimensional approaches
for metabolomics
Dissertation presented by
to obtain the grade of
Supervisor Prof. J-F. Focant
Nicolas DI GIOVANNI
Doctor of Philosophy in Sciences
Dawn points, and another day
Prepares for heat and silence. Out at sea the dawn wind
Wrinkles and slides. I am here
Or there, or elsewhere. In my beginning.
L’aube point, et un nouveau jour
S’apprête à la chaleur et au silence. Le vent de l’aube
Ondule et glisse sur la mer. Je suis ici
Ou là, ou bien ailleurs. En mon commencement.
1
Contents
List of abbreviations
2
Chapter 1 General introduction
5
Chapter 2 Untargeted serum metabolic profiling by comprehensive two-
dimensional gas chromatography−high-resolution time-of-flight mass spectrometry
19
Supporting Information
47
Chapter 3 Specificity of metabolic colorectal cancer biomarkers in serum
through effect size
58
Supporting Information
80
Chapter 4 Correlations for untargeted metabolomics of colorectal cancer
91
Supporting Information
106
Chapter 5 General discussion and outlook
114
Chapter 6 Summary - Résumé
125
List of publications
145
References
146
2
List of abbreviations
ANOVA
Analysis of variance
Anti-TNFα
Antitumor necrosis factor α
AUC
Area under the curve
BMI
Body mass index
BSTFA
N,O-bis(trimethylsilyl)trifluoroacetamide
CB
Candidate biomarker
CD
Crohn's disease
CDEIS
Crohn’s disease endoscopic index score
CI
Confidence interval
CL
Common language effect size
CRC
Colorectal cancer ('active' state)
d-like ES
Effect size in the form of Cohen's d
DoE
Design of experiment
EI
Electron ionization
ES
Effect size
FC
Fold change
FDR
False discovery rate
FR
Fisher ratios
GC×GC
Comprehensive two-dimensional gas chromatography
GC-MS
Gas chromatography mass spectrometry
HC
Healthy controls
3
HMDB
Human metabolome database
HR
High resolution
IBD
Inflammatory bowel disease
IS
Internal standard
K
Kendall's tau
KEGG
Kyoto encyclopedia of genes and genomes
LC
Liquid chromatography
LDA
Linear discriminant analysis
LOD
Limits of detection
LOESS
Locally estimated scatterplot smoothing
LOQ
Limit of quantification
LRI
Linear retention indices
LV
Latent variable
MANOVA
Multivariate analysis of variance
MDA
Mean decrease accuracy
MeOX
Methoxyamine hydrochloride
MS
Mass spectrometry
MSI
Metabolomics standards initiative
MSTFA
N-methyl-N-(trimethylsilyl)- trifluoroacetamide
MTBSTFA
N-tert-butyldimethylsilyl- N-methyltrifluoroacetamide
NHST
Null hypothesis significance testing
NIST
National institute of standards and technology
NMR
Nuclear magnetic resonance
NN
Neural networks
4
OVL
Overlap
P
Pearson's r
PCA
Principal component analysis
PLS-DA
Partial least squares discriminant analysis
P
MModulation period
QC
Quality control
R-CRC
Colorectal cancer in remission
RF
Random forests
R-HC
Healthy controls matched to R-CRC samples
r-like ES
Effect size in the form of a correlation coefficient
ROC
Receiver operating characteristic
RSD
Relative standard deviation
SAM
Significance analysis of microarrays
SI
Supporting information
Sp
Spearman's rho
sPLS-DA
Sparce partial least squares discriminant analysis
SRM 1950
Certified reference material - metabolites in plasma
SVM
Support vector machine
TMCS
2,2,2-trifluoro-N-methyl-N-(trimethylsilyl)-acetamide, chlorotrimethylsilane
TNM
Tumor Node Metastasis (staging system)
TOF-MS
Time-of-flight mass spectrometry
U
Cohen's U
UC
Ulcerative colitis
VIP
Variable importance in the projection
5
Chapter 1
6
METABOLOMICS
Metabolomics was defined in 1998 as the comprehensive study of the low-molecular weight metabolites of a biological sample1 such as biofluids, cells and tissues. Its main strength is that it can be regarded as the end point of the “omics” cascade and the closest link to the phenotype. It gives access to the cellular and molecular processes and thus reflects all the information expressed and modulated by the other omic layers, namely the genome, the transcriptome and the proteome. Therefore, the changes observed can legitimately be seen as the ultimate answer of an organism to genetic alterations, diseases, or environmental influences2,3.
While it goes back up to Ancient China, where diabetes was diagnosed through the glucose content of urine, quantitative metabolomics as we know it today is much more recent. In 1956, Williams first described the ‘variability of metabolic characteristics’4. In 1971, two research groups performed the first ‘metabolic profiles’ and showed that gas chromatography coupled to mass spectrometry (GC-MS) could be used to measure the compounds present in human urine5,6. However, it is only at the start of the new century that the field truly took off, helped by the creation in 2005 of the Metabolomics Society and of a dedicated journal. Since then, metabolomics research has focused on technological developments, the integration with other omics, and the diagnosis of complex phenomena like diseases7. In 2016, Kell and Oliver8 looked back to this period and observed that metabolomics had grown along with the massive improvement of mass spectrometric and chromatographic methods9–13, through the capability to identify metabolites of interest using mass exactitude14,15 as well as the possibility to perform untargeted analysis, i.e. metabolic profiling16,17 and to discover new biomarkers for medical and environmental conditions18,19. They regretted the frequent improper use of statistical and related data processing methods20,21. They also identified new trends such as the standardization of the processes, that include data integration22–25. One can have an idea of the evolution and the current state of the field through the Human Metabolome Project that completed the first draft of the human metabolome and established a database of approximately 115 000 metabolites and 25 000 pathway maps at the last reporting point (2018), respectively 50 and 1000 times more than at the start in 200726,27.
7
Nowadays, metabolomics is a widespread discipline employed to provide phenotypic insights in a great variety of applications28 such as plants29, microbial systems30, nutrition31, drug discovery32, functional genomics33, fluxomics34 and clinical medicine35,36 including the gut-microbiota interaction37,38.
Indeed, metabolomics-based strategies have become an important part of modern clinical research through the assumption that metabolites have an essential role in biological systems and that diseases cause disruption of biochemical pathways39. When carried out properly, they allow for a better understanding of pathophysiological conditions and disease mechanisms. They also provide innovative tools for more adequate, i.e. non-invasive, sensitive and specific, diagnosis and prognosis approaches40,41. For instance they can help identify patients at risk of disease or predict the response to specific treatments42. They can also serve in drug development and in personalized medicine43. However, the number of metabolic biomarkers that are actually used in clinic is extremely reduced in comparison to the metabolomic studies that aimed to find such metabolites42,44,45. This is because to achieve that, high standards are needed while there are numerous pitfalls along the way. It starts with the study design, continues with the sample collection and preparation, until the data acquisition and analysis43. In fact, there are so many potentially deadly issues that they are the subject of dedicated publications39,40,46,47. Therefore, finding appropriate ways for each of those, in order to ultimately get reliable results is the challenge every metabolomic experiment conducted in a clinical context has to face, whatever the exact subject studied or the instrumentation.
ANALYTICAL PLATFORMS IN METABOLOMICS
Capillary electrophoresis mass spectrometry (CE-MS), Direct infusion mass spectrometry (DIMS), supercritical fluid chromatography mass spectrometry (SFC-MS), matrix-assisted laser desorption/ionization (MALDI-MS) and ion mobility (IM) can be used to study the metabolome48. Nvertheless, the three main instrumentations in metabolomics are, by far, gas and liquid chromatography coupled to mass spectrometry (GC-MS and LC-MS) and nuclear magnetic resonance (NMR).
NMR 49, either 1H nuclear magnetic resonance (NMR)18,50–58 or its variant 1H magnetic resonance spectroscopy (MRS)59–61, is an unbiased45, nondestructive, rapid and highly reproductible technique that
8
requires a relatively simple sample preparation40,49,62,63. Therefore, it is particularly useful for the metabolic profiling of molecules that are difficult to ionize or require derivatization for MS analysis49 such as biofluids (e.g., culture medium) and semisolid or solid samples (e.g. intact cells, tissues or living organisms)49,62. Because its signal intensity is less affected by the other components in the sample, NMR can also be utilized for the analysis of samples that are composed of compound mixtures62. However, this is counterbalanced by its lack of resolution. It also has a comparatively low sensitivity so its ability to cover the detection of low abundance metabolites is relatively poor49,64. One more bottleneck of quantitative metabolomics using NMR is the difficulty to perform spectral deconvolution62. Finally, it is more expensive64.
Mass spectrometry (MS) is the other powerful analytical platform, especially when combined with separation techniques such as liquid65,66 or gas chromatography67–70 that (partially) prevent potential matrix effects.
GC-MS exhibits a high peak capacity through its superior separation efficiency as well as readily available compound libraries that enable easy and often reliable compound identification through the consistent spectra obtained with 70 eV electron ionization (EI)49,62. The identification is further improved by the excellent repeatability of retention times that provide additional information on the physicochemical properties of the metabolites. GC-MS analyzes volatile compounds49 and low molecular weight hydrophilic metabolites through derivatization62. Overall, the chemical classes observed in GC−MS are very similar to the ones observed in NMR, with individual metabolite differences71–73, and the measured concentrations show generally good agreement73. Those classes are mainly amino acids, organic/carboxylic acids, fatty acids, long chain alcohols, amides, alkaloids, sugars, and sugar alcohols71,73. Sample preparation, however, is time consuming and therefore reduces the throughput40. It can also add analytical variability49 and produce artefacts73. The run times are
comparatively long (20-60 min)49. And the instrumentation has a generally higher variability compared with LC-MS40.
9
LC-MS is able to analyze a wide range of metabolites -ranging from high to low molecular weight and from very polar to very lipophilic- by selecting the appropriate column and mobile phases. This is especially interesting for the heavy compounds that are not volatilized even after derivatization and the ones that are degraded by heat. This is the case of lipidic compounds74,75 such as (lyso)phosphatidylcholines (PCs and LPCs)65,76, di- and triglycerides (TG), fatty acids (FA)77 and phospholipids76,78,79 or carnitines and nucleotides66. LC-MS can also detect negatively charged molecules that include sugar phosphates, nucleotides, and carboxylic acids. It requires only minimal amounts of sample and no sample derivatization. However, it suffers from matrix suppression effects49. Recent developments include ultra-performance liquid chromatography (UPLC) instrumentation62, that
improves the metabolite coverage and detection49.
MS detection is the most frequently used platform in metabolomics45. Nevertheless, due to the physicochemical diversity of the biological systems, no single analytical instrumentation is able to detect and quantify all the metabolites present in complex samples40,45,73. Therefore, the combination of different analytical platforms is becoming increasingly common, despite the fact that it is expensive and time consuming. It allows to take advantage of each technique's strengths and to overcome their specific limitations in order to allow a broader perspective of the metabolome49. It is particularly important in order to cross-validate the results obtained on each separate platform43.
COMPREHENSIVE TWO-DIMENSIONAL GAS CHROMATOGRAPHY
In the decades following the invention of the open tubular capillary column by Golay80, gas chromatography was applied successfully in very diverse fields and became an analytical technique of choice81. However, despite the efforts deployed, the separation power of GC-MS appeared to be too low to fully resolve complex biological or environmental samples82. While the column lengths and gas velocities can be adapted to increase the separation efficiencies, this has limits and results in lengthy analysis times. A more effective way to solve this issue is to perform multidimensional gas chromatography83. Especially if, instead of only “heart-cutting” some selected fractions of the first-dimension effluent, the system is made comprehensive84–86. In that case, all the compounds from the
10
first column are continuously transferred into the second one through a device called a modulation system that traps, reconcentrates and reinjects them (Figure 1). In this thesis, it was achieved by alternatively cooling and heating a short portion of capillary column (thermal modulation) in opposition to the use of valves (flow modulation).
Figure 1. Principle of GC×GC separation.
If the two columns are orthogonal87, i.e. contain stationary phases dissimilar enough, the resulting peak capacity is approximately equal to the product of the peak capacities of the two individual separation systems88. In addition, because of the modulation, the sensitivity is far better and a true baseline is always available. Finally, for certain classes of compounds, such as the hydrocarbons, structured chromatograms are obtained that facilitate their interpretation89.
Because of those properties, comprehensive two-dimensional gas chromatography (GC×GC) has soon demonstrated high potential for the elucidation of biological19,90,91 as well as environmental92,93 samples. During the last two decades, it has been subject to major enhancements and numerous studies94, leading the way to a mature technique95,96. Further coupling with high-speed MS analyzers such as time-of-flight (TOF) MS allowed higher resolution, sensitivity, and mass spectral quality49,97. In comparison to single
11
dimensional (1D) GC-MS, this resulted in an increased number of detected peaks95,98, 20-times enhanced detection limits99 and to more accurate and reliable results98.
Moreover, new high-resolution (HR) TOF-MS instruments not only strengthen the compound annotation but also further improve the quantitation based on distinctive masses as well as the selectivity through deconvolution. Which leads to an increase in the number of unique metabolites detected and to a facilitated search for target compounds100.
In addition, many key aspects have been extensively investigated, such as quality assurance/quality control (QA/QC)101–103, sample preparation104, separation and detection105, or identification14. This is also the case for data (pre)processing17,106,107 where single GC−MS protocols are, in some extent, transferable to GC×GC. Moreover, specific resources and protocols have been developed and perfected over the years, such as software (GC Image™ (LLC, Lincoln, Nebraska, USA), ChromaTOF™ (LECO Corporation, Saint-Joseph, Michigan, USA), ChromSquare™ (Shimadzu, Kyoto, Japan), GC×GC-Analyzer™ (MsMetrix, Utrecht, The Netherlands) as well as chemometric methods (PARAFAC108) and platforms (the more general MetaboAnalyst109, MetPP110).
GC×GC-TOF-MS IN METABOLOMICS
The aforementioned qualities of sensitivity and resolution of GC×GC-TOFMS make it particularly suited to perform untargeted analysis, namely the global metabolic profiling of complex, biological samples98,111,112. When this thesis started, in 2014, it had already been applied in metabolomics for more than ten years. The range of applications96 was already quite large with various matrices113,114, pathologies19,90,115–117 and compounds118–120 studied. Even animal models95 and more general and fundamental aspects99,121–126 were investigated.
Nevertheless, the technique was undermined by various issues. First, the general limitations of GC−MS such as sample preparation104,127, compound annotation15, and thermal decomposition128,129that, as seen above, did not prevent the widespread use of gas chromatography and that we considered of lesser importance. Second and more important to us in the perspective of developing GC×GC, difficulties
12
common to comprehensive technologies regarding the analytical optimization and stability as well as the handling of large data sets that made the detection of the significant variables more challenging and less reliable. Reason why the untargeted analysis of a large number of metabolites very diverse in the concentrations and chemical natures was still one of the major challenges faced by the scientists in the field.
Since the very beginning of the technique, it is known that the intrinsic performances of GC×GC are not everything and that, in spite of the metabolic coverage allowed, performing untargeted analysis on complex biological samples in a reliable manner with a comprehensive platform such as GC×GC−MS is not straightforward. Indeed, a pioneer article published in 2002 clearly stated that, because it radically alters the GC analysis, GC×GC requires new thought processes and validated methodologies developed as ‘total systems’86. To us, this idea was more relevant than never and a major reason for the frequent preference of 1D GC in cases where the peak capacity of GC×GC would be useful, including routine laboratories130.
To summarize, metabolomics in a clinical context faces many analytical challenges. GC×GC-TOFMS has much higher sensitivity and resolution, therefore much higher untargeted capabilities than GC-MS but is still largely neglected in comparison. In front of that situation, the aim of the thesis was to develop methods to exploit the performances of GC×GC-(HR)TOF-MS in untargeted metabolomics in a clinical context, with the underlying goal of extending its use relatively to 1D GC-MS.
DEVELOPMENT OF A GC×GC-(HR)TOF-MS METHOD FOR METABOLOMICS
The first step was to set up, i.e. to design and evaluate, a global analytical workflow. At the time, exploratory metabolomics studies most frequently consisted in perfoming sample preparation and analysis, data (pre)processing, statistical tests and annotation of the molecules of interest (Figure 2).
13
Figure 2. Global analytical workflow performed in metabolomics as well as in GC×GC. The encircled steps are the ones generally covered by the analytical scientist in the course of an exploratory study.
While this pattern had been successful over the years, we looked to go further by considering all the steps of the process, together. Indeed, we believe that focusing on only one or a few of them is likely to leave weak points in the chain going from the samples received from the clinic to the metabolites of interest annotated and tested, which would limit the overall reliability of the latter.
Among other things, we paid particular attention to the different ways to perform the different operations, making ours the observation that, while difficulty should not be pursued for itself, the analysis of environmental or biological samples should not be seen as a purely routine matter131. Here are a few examples. The sample preparation and the chromatographic separation can be imported from published protocols, as they are or with adaptations, or that can be optimized, in a variable extent, for the specific application. The analytical performances of the method can be validated, which is not frequent. In this case, different properties can be assessed such as the precision, the accuracy and the limits of detection and quantification (LOD and LOQ), through intra-day, inter-day (repeatability) and even inter-laboratory (reproducibility) measurements. The raw data can be used directly or they can be normalized and scaled in various ways. Many different statistical tests and models can be applied to find the metabolites of interest that, in the end, can be identified using fragmentation spectra and/or exact mass, and/or retention times.
14
We also took a particular care of the potentially confounding factors, either analytical or clinical, which are often left aside despite the fact that they can have a nonnegligible132 impact and produce spurious results21,102. For some scientists, they even represent the “most important threat to validity”133. For instance, it is well documented that colorectal cancer (CRC) incidence and mortality are influenced by sex and age134,135, lifestyle136–138 through alcohol139 and tobacco consumption140 or nutrition habits, and even possibly ethnicity141 (chapter 3).
It is important to note that at the start of the PhD, quality control (QC) procedures were more an exception than the rule, whatever the instrumental platform. Indeed, at the time, it was considered only by a few leading scientists who used mainly it to monitor the analytical system43,101,121,142–146, but also to partially correct for the measured analytical variations (LOESS procedure)102,147,148 and to normalize the data98,149–151.
Similarly, chemometrics strategies were not very elaborate. Most frequently, univariate tests such as t-tests (Student’s, Welch, Wilkoxon-Mann-Whitney) were conducted152. Along with fold change (volcano plot)153, visualization tools such as principal component analysis (PCA) and hierarchical clustering analysis (HCA) and partial least-squares discriminant analysis PLS-DA as a classification model154. Alternatives to extract the desired information from the data107,155–159 and build models155 were reported but quite rare. They included the analysis of variance (ANOVA), Fisher ratio, orthogonal partial least-squares discriminant analysis (OPLS-DA), K-nearest neighbors (KNN), feature selection, information gain (IG), multilayer perceptron (neural network; NN), support vector machine (SVM), linear discriminant analysis (LDA), self organizing maps (SOM), decision trees (DT), random forests (RF) and naïve Bayes classifiers. As well as PARAFAC, ANOVA-SCA (simultaneous component analysis) and SIMCA (Soft independent modeling of class analogy) for multi-way analysis160. In addition, Bonferroni as well as cross-validation and permutation testing were sometimes employed, respectively to correct for multiple testing and to avoid overfitting21,161. Receiver operating characteristic (ROC) curve, that evaluates the diagnosis capability21, could also be found.
15
In the end, a global analytical method was developed and successfully used in a proof of concept study, where it was applied to serum samples with the aim to discover candidate biomarkers (CB) of Crohn’s disease (CD) endoscopic activity. To do so, we analyzed three groups of CD patients (n = 35) of various endoscopic activities according to the related Crohn’s disease endoscopic index score (CDEIS): quiescent patients (n = 9; CDEIS = 0), low endoscopic activity patients (n = 14; 0 > CDEIS > 3), and high-endoscopic activity patients (n = 12; CDEIS > 3), along with “healthy” controls (n = 33). At first, all the CD samples were put together and compared to the controls. Then, it was attempted to distinguish the three CD groups between them (chapter 2).
SPECIFICITY OF CANDIDATE BIOMARKERS
In our second work, we applied the same workflow to investigate the metabolic effects of colorectal cancer in serum (chapter 3). First, we aimed to find candidate biomarkers for patients with confirmed colorectal cancer lesions (CRC, n=18) in comparison to healthy control samples (HC, n=19) specifically matched for age and gender, two of the most influential confounding factors, and controlled for other potential biases.
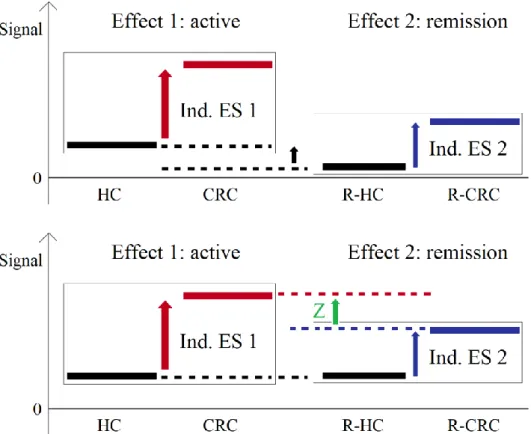
Then, we assessed their specificity to the ‘active state’ of the disease (CRC) by monitoring their distributions in distinct patients in remission (R-CRC, n=17), a case that differed from usual the longitudinal study. Indeed, to evaluate the evolution of a phenomenon, such as the remission of a pathology, longitudinal studies are the method of choice. In those, the metabolic profiles of the patients under treatment are followed over time, together with their clinical status. It has the advantage to avoid any bias due to the sampling or to the individual patient traits. However, it is more expensive and patients can be difficult to follow over long periods of time162. This is what happened here.
In addition, because of to the difficulty to control and to match for all clinical and demographic traits when sampling small cohorts163–165, the R-CRC patients available in our study were not matched for age and gender to the CRC group. The consequent risk of bias prevented the use of the usual null hypothesis significance testing (NHST) and thus the direct comparison of CRC and R-CRC samples. Instead, we compared the R-CRC samples to a second, specifically matched group of healthy controls (R-HC, n=17), and used this comparison to indirectly compare the “two states” of the disease (CRC vs R-CRC) through
16
a measure called effect size (ES)166,167, defined as the quantitative measure of the magnitude of a phenomenon166. We also investigated several methodological aspects regarding which effects sizes to use, the formulas to convert them and their interpretation, and we considered the individual ES for the CRC candidate biomarkers in order to confirm the reported complementarity of this approach166,168 to the NHST.
The NHST assesses the probability that an effect such as the one measured is obtained under the assumption of the null hypothesis. This probability, usually reported as the p-value, is by far the most frequent measure used to give sense to experimental results. Despite the fact that it is by nature a distorted measure. Moreover, it informs only on the statistical significance, and mixes the size of the effect and its variability, the latter including the sample size of the cohort. In most cases, it is widely used with very rigid thresholds (0.05 and 0.01). Finally, as it occurred here, it is sensitive to bias and its reliability is reduced when the groups of samples that are compared are not paired or matched.
The ES, on the other hand, has several interesting characteristics. It focuses on the practical importance168,169 and thus directly represents the measured data, without the mediation of the null hypothesis167,170,171. Its interpretation is not based on rigid thresholds167,171, but depends on the domain of research, which encourages to pay more attention to the research conditions and the overall data quality172. It distinguishes the magnitude of the effect and its variability, or uncertainty, expressed in the form of the confidence intervals (CI)168–170,173–175, which is a pre-requisite for the conduct of meta-analyses.
The results of individual studies are often insufficient to provide confident insights into the complex biological phenomena investigated. Indeed, many reviews observe that the results are not consistently reproducible176, mostly because of the limited sample size or rare outcomes177. Traced back to the 17th century, first used in its modern acceptation in 1904 by Pearson178 and named in 1976179, a meta-analysis is a statistical analysis that combines and compares the results of multiple individual scientific studies, with the aim toprovide a more precise estimate of an effect180, with increased statistical power177,181. It
17
is therefore the quantitative complement to a systematic review177,182 that encourages cumulative science168,183. Meta-analysis is capable to yield conclusive results when individual studies are inconclusive181 and it can contribute to the generalisability of study results by overcoming the limitation of the specific populations investigated or by explaining their heterogeneity such as the different reactivities of subgroups177.
The maturity achieved by metabolomics and GC×GC induces an exponential increase in the number of publications and thus creates a growing interest for this type of study. Meta-analysis should play a major role in many fields, if one wants the investigations that accumulate over the years to have a real impact on the clinical practices.
CORRELATIONS
Centered on the diagnosis capability, candidate biomarkers provide a limited biological knowledge in comparison to the high-dimensional, complex chemical data sets obtained with comprehensive instrumentations. To get more from them, one can investigate the correlations between the metabolites, calculated as the statistical dependency between them. Through their specific features in the samples studied, they contain potentially valuable information about the changes in the underlying metabolic network that are associated to a biological process184,185, such as the global perturbation induced by a disease condition or its evolution in time. Even when the metabolite concentrations are not directly altered63. In addition, they make possible to complete the metabolic pathways as they are already known and to discover and modelize associations outside them. While their interpretation necessitates strong metabolic understanding, their determination is pure data processing and requires no additional analytical effort.
In our final work, we used the colorectal cancer final data set to evaluate the correlations between metabolites (chapter 4). By doing so, we aimed to push forward the investigation of this pathology as well as to examine the methodological aspects of correlations conducted on GC×GC-TOF-MS metabolomics data.
18
relationships, the visual control of the detected associations, the handling of atypical values and the role of the precision of the data. Respectively through the comparison of parametric and non-parametric correlation coefficients (Pearson’s r, Spearman’s rho and Kendall’s tau), the use of scatterplots and their associated regressions and angles, a complete outlier detection strategy for both samples and individual values and an original procedure to assess the distance between consecutive values relatively to their uncertainty defined by the residual standard deviation in the QC samples.
19
Chapter 2
Untargeted Serum Metabolic Profiling by comprehensive
two-dimensional gas chromatography−high-resolution time-of-flight mass
spectrometry
J. Proteome Res. 2020, 19 (3), 1013–1028.
Nicolas Di Giovanni,
†Marie-Alice Meuwis,
‡Edouard Louis,
‡and Jean-François Focant
*,††Department of Chemistry, Organic and Biological Analytical Chemistry Group, Quartier Agora, University of Liège, Allée du Six Août, B6c, B-4000 Liège (Sart Tilman), Belgium
‡GIGA institute, Translational Gastroenterology and CHU de Liège, Hepato-Gastroenterology and Digestive Oncology, Quartier Hôpital, University of Liège, Avenue de l’Hôpital 13, B34-35, B-4000 Liège, Belgium
20
ABSTRACT While many laboratories take appropriate care, there are still cases where the performances of untargeted profiling methods suffer from a lack of design, control, and articulation of the various steps involved. This is particularly harmful to modern comprehensive
analytical instrumentations that otherwise provide an unprecedented coverage of complex matrices. In this work, we present a global analytical workflow based on comprehensive two-dimensional gas chromatography coupled to high-resolution time-of-flight mass spectrometry. It was optimized for sample preparation and chromatographic separation and validated on in-house quality control (QC) and NIST SRM 1950 samples. It also includes a QC procedure, a multiapproach data (pre)processing workflow, and an original bias control procedure. Compounds of interest were identified using mass, retention, and biological information. As a proof of concept, 35 serum samples representing three subgroups of Crohn’s disease (with high, low, and quiescent endoscopic activity) were analyzed along with 33 healthy controls. This led to the selection of 33 unique candidate biomarkers able to classify the Crohn’s disease and healthy samples with an orthogonal partial least-squares discriminant analysis Q2 of 0.48 and a receiver-operating characteristic area under the curve of 0.88 (85% sensitivity and 75% specificity in cross validation). 15 of these 33 candidates were reliably annotated (Metabolomics Standards Initiative level 2).
KEYWORDS GC×GC · comprehensive gas chromatography · untargeted metabolomics · QC system · Crohn’s disease · inflammatory bowel disease
21
INTRODUCTION
Since its debut with Pauling in 19716 and the introduction of the specific term in 1998,1 metabolomics, the comprehensive study of the low-molecular weight metabolites of a biological sample, has considerably evolved to become a widespread discipline commonly employed to provide phenotypic insights in applications such as clinical medicine.35 Next to nuclear magnetic resonance (NMR), mass spectrometry (MS) appeared as one of the most powerful analytical platforms in the field, especially when combined with separation techniques such as liquid or gas chromatography (LC; GC).187 Comprehensive two-dimensional gas chromatography (GC×GC) has soon demonstrated high potential for the elucidation of biological samples.19,90,91 It has been subject to major enhancements and numerous studies during the last two decades,94 leading the way to a mature technique.95,96 Further coupling with high-speed MS analyzers such as time-of-flight (TOF) MS allowed higher resolution, sensitivity, and mass spectral quality.64 In comparison to single-dimensional (1D) GC−MS, this resulted in an increased number of detected peaks,95,98 up to 20 times-enhanced detection limits99 and more accurate and reliable results (less false positives in biomarker research98). Moreover, new high-resolution (HR) TOF-MS instruments not only strengthen compound annotation but also further improve the quantitation based on distinctive masses as well as the selectivity through deconvolution, which leads to an increase in the number of unique metabolites detected and a facilitated search for targeted compounds.100 In addition, many key aspects have been extensively investigated, such as quality assurance/quality control (QA/QC),101–103 sample preparation,104 separation, and detection,105 or identification.14 This is also the case for data (pre)processing,17,106,107 knowing that single GC−MS protocols are, to a large extent, transferable to GC×GC. In addition, specific resources and protocols have been developed and perfected over the years, such as software (GC Image (LLC, Lincoln, Nebraska, U.S.A.), ChromaTOF (LECO Corporation, Saint Joseph, Michigan, U.S.A.), ChromSquare (Shimadzu, Kyoto, Japan), and GC×GC-Analyzer (MsMetrix, Utrecht, Netherlands)), methods (PARAFAC108) and platforms (the more general MetaboAnalyst109 and MetPP110). Nevertheless, the technique is undermined by various issues: first, the general limitations of GC−MS, such as sample preparation,104,127 compound annotation,15 and thermal decomposition,128,129 which are still not fully addressed, and second, difficulties common to comprehensive technologies regarding the analytical stability and handling of large data sets, difficulties
22
that make the detection of the significant variables more challenging and less reliable and limit their use in routine laboratories.130 Also, in the larger picture, while many studies take appropriate care, there are still cases of untargeted analyses suffering from a lack of articulation. Indeed, when the various steps are considered separately, it likely leaves weak links in the chain that limit the overall quality of the global process and contribute to maintaining the gap with the clinic. This work aims to perform global profiling of serum samples with GC×GC−HRTOF-MS in a quantitative and qualitative manner, that is, through a coordinated workflow in which all steps are carefully designed and controlled, based on previous studies as well as general knowledge, and take advantage of using multiple approaches. As a proof of concept, we applied the method to serum samples and looked for potential biomarkers of Crohn’s disease endoscopic activity. Crohn’s disease (CD) is an inflammatory bowel disease (IBD) characterized by chronic inflammation of any part of the gastrointestinal tract with remission periods. Its negative impact on the quality of life of patients188 is amplified by a high and increasing prevalence.189 Moreover, current treatments are costly and may present severe side effects.190 Its diagnosis still largely relies on clinical evaluation, namely, invasive colonoscopy and histological evaluation of biopsy together with clinical and endoscopic activity scores. Therefore, the use in clinics of noninvasive companion biomarkers able to indicate patients with endoscopic activity would be useful. Besides, the altered metabolites correlated to endoscopic activity could contribute to a better understanding of the pathophysiology of the disease. To this date, several metabolic profiling studies have been conducted. Most often, CD has been analyzed along with ulcerative colitis (UC) to be differentiated from healthy controls.18,50,51,53,55,58,191 However, mouse models, either with interleukin-10 deficiency54,67 or with induced colitis,52,65 have also been investigated. The matrices of choice have been fecal extracts,50,55,57,66,68,70,191 serum,18,52,53,56,65,66,68 urine,51,52,54,56,58 and colonic mucosal tissues.59–611H NMR has been the most frequently applied analytical platform18,50–58 with its variant 1H magnetic resonance spectroscopy (MRS)59–61 before GC−MS67–70 and LC−MS.65,66 GC×GC, the instrumentation used in this work on human serum, is obviously able to detect the chemical classes observed in GC−MS that include most of the ones observed in NMR, with individual metabolite differences.71,72Those classes are mainly amino acids, organic/carboxylic acids, fatty acids, sugars, and sugar alcohols.71,73 LC−MS, depending on the ionization technique (usually electrospray ionization) and the acquisition mode (positive,
23
negative, or both), is able to detect more lipidic compounds,74 such as (lyso)phosphatidylcholines,65,76 di- and triglycerides, fatty acids,77 and phospholipids76,79,192 or carnitines and nucleotides.66
MATERIAL AND METHODS
Samples Patient recruitment and serum sample intakes were performed at the university hospital of Liège, Belgium. The project protocol received full approval of the institutional ethical reviewing board, and each patient provided a signed informed consent (no. BE70721423133). For all samples, the sample intake, processing, and storage procedures were standardized and followed our biobanking guidelines developed from proteomics studies and utilized also for clinical trials (Supporting Information, Section S1A). The CD patients (n = 35) were classified into three groups of endoscopic activity according to the related Crohn’s disease endoscopic index score (CDEIS) as follows: quiescent patients (n = 9) with CDEIS = 0, low endoscopic activity patients (n = 14) with 0 < CDEIS < 3, and high-endoscopic activity patients (n = 12) with CDEIS > 3. The controls (n = 33), qualified as “healthy” in the sense that they were negative for IBD or any other known cancer at the time of sample intake, were matched for gender and age. The clinical data of the patients are summarized in the Supporting Information (Section S1B). The internal QC samples consisted of 30 μL aliquots, made through one freeze−thaw cycle,149 of human serum samples distinct from the study samples and were collected using the same procedure.
Chemicals Hexane, chloroform, methanol absolute, pyridine, methoxyamine hydrochloride (MeOX), N-methyl-N-(trimethylsilyl)- trifluoroacetamide (MSTFA) + 1% 2,2,2-trifluoro-N-methyl-N-(trimethylsilyl)-acetamide, chlorotrimethylsilane (TMCS), N,O-bis(trimethylsilyl)trifluoroacetamide (BSTFA), N-tert-butyldimethylsilyl-N-methyltrifluoroacetamide (MTBSTFA), methyl chloroformate, alkane solutions (C8−C20, ∼40 mg/L in hexane), and standards glycine-2,2-d2, succinic acid-2,2,3,3- d4, fumaric acid-2,3-d2, and 4,4′-dibromooctafluorobiphenyl were all purchased from Sigma (Sigma-Aldrich Co. LLC., St. Louis, Missouri, U.S.A.). “Hole-shaped” vials (microliter caps DN11, 0.9 mL) were purchased from VWR (VWR International BVBA, Leuven, Belgium), and glass wool liners (Sky Liner precision and single taper) and capillary chromatographycolumns (Restek) were from Interscience (Louvain-la-Neuve, Belgium). The NIST certified reference material SRM 1950193 was purchased from the National Institute of Standards and Technology (Rockville, Maryland, U.S.A.) and stored at −80 °C
24
upon arrival. Fresh solutions of MeOX (30 mg/mL in pyridine) and standards (100 μg/mL either in Milli-Q water (Q-Gard 1, Merck KGaA, Darmstadt, Germany) or in hexane for pre- and post-extraction standards, respectively) were prepared every week.
Sample Preparation All samples were stored at −80 °C until use. After thawing at 4 °C for 1 h, 30 μL of each sample was put in hole-shaped vials to which 3 μL of glycine-2,2-d2 and succinic acid-2,2,3,3-d4 were added as isotopically labeled internal standards (IS). Metabolites were extracted (see optimization step for details) before cooling at −20 °C for 10 min and centrifugation at 9300 RCF for 10 min. Fumaric acid-2,3-d2 (3 μL) was then added before the samples were dried under a gentle N2 flow while heated at 40 °C. They were stored again at −80 °C until use. Before injection, the metabolites were made volatile with a MeOX and MSTFA two step derivatization protocol (see optimization step for details). The medium was homogenized after each step by 1 min of vortexing. It was recovered, and 3 μL of 4,4′-dibromooctafluorobiphenyl was finally added. All steps were performed manually. For security precautions, see the Supporting Information, Section S2.
GC×GC−HRTOF-MS The instrumentation consisted of a JMS-T100GCVV GC×GC−TOF-MS (Jeol Ltd., Tokyo, Japan) using an Agilent 6890 GC (Santa Clara, California, U.S.A.) coupled to a CTC autosampler (CTC Analytics AG, Zwingen, Switzerland). We used a set of capillary columns of 30 and 1 m, both 0.25 mm in i.d. and 0.25 μm in film thickness, to optimize the overall flow and compromise between peak capacity and sample loadability.99 A guard column (2 m, 0.25 mm) was placed after the injector, and 10 cm was cut after each step of routine maintenance of the instrument. After which, the system was reconditioned with five injections of a QC sample. SilTite μ- Unions (SGE Analytical Science) were used for the connections. The peaks were modulated through a ZX1 loop cryogenic modulator using liquid nitrogen (Zoex Corporation, Houston, U.S.A.). Helium served as a carrier gas in a constant flow mode. The GC oven was held at the initial temperature for 1 min (purge time was 1 min at 50 mL/min) and at the final temperature of 300 °C for 5 min. The ion source and transfer line temperatures were set to 250 °C. Ions were generated by electron ionization (EI) in the positive mode at 70 eV and 300 μA. The data were acquired at 25 Hz at m/z 50−700.
25
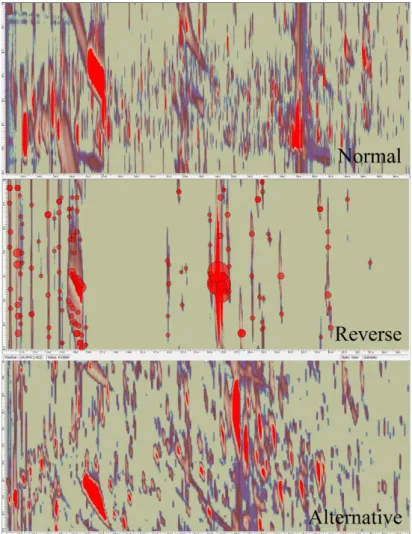
Method Optimization Two extraction solvents (methanol (3:1)17 and methanol/ chloroform/water (2.5:1:1:1)194) and four silylation agents (MSTFA, BSTFA, MTBSTFA, and methyl chloroformate195) were tested104 in triplicate. A Box−Behnken design of experiment (DoE, Unscrambler X, Camo, Oslo, Norway) helped determine the most appropriate196 volumes (for the derivatization reagents: 5−30 μL for 30 μL of serum), temperatures (20−100 °C), and durations (0.5−4 h). Details are provided in the Supporting Information, Section S3. Regarding separation and detection,197 we evaluated multiple stationary phases (normal Rxi-5/Rxi-17, inverse Rxi-17/Rxi-5, and alternative sets Rtx-200/Rxi-5198), flows (0.5, 1, and 1.5 mL/min), initial temperatures (40, 50, and 90 °C), temperature ramps (3, 5, 7, and 10 °C/min), modulation periods (PM = 2, 2.5, 3, 3.5, 4, 4.5, 5, 6, and 8 s), hot jet durations (at first, a fifth of the modulation period then 500, 700, and 900 ms for 3.5 s of PM), injection temperatures (200, 250, and 280 °C), liner designs (“single taper gooseneck” and “precision” 4 mm Sky liners with glass wool), and injection volumes and splits (1 and 2 μL in the splitless mode and 5 μL with split ratios of 5:1 and 10:1).
Method Validation The method was validated on internal QC samples and a certified reference material (NIST SRM 1950). Six QC samples were injected consecutively (intra-batch), and five of them were injected over five days (inter-batch). We monitored 19 metabolites representative of the matrix regarding the chemical classes, retention times in both dimensions (1tR and 2tR), and peak volumes (see the Supporting Information, Section S4). Four SRM 1950 samples were injected consecutively (intrabatch), and five were injected over five days (inter-batch). Twenty-eight metabolites (16 amino acids, 3 clinical markers, and 9 fatty acids, Supporting Information, Section S5) were properly annotated and followed.
QC System To define the control state of the system, nine QC samples were injected over two days after maintenance of the instrument.
Proof of Concept We analyzed 35 serum samples of three subgroups of Crohn’s disease patients: high
endoscopic activity (n = 12), low endoscopic activity (n = 14), and quiescence (n = 9), along with 33 healthy controls, 15 QC samples (one every five samples), and 4 SRM 1950 samples. Three process
26
blanks103 were injected before each QC. All analytical steps were randomized. Six samples, a single one and a batch of 5, had to be reinjected after rejection by the QC system.
Data Processing First, the raw data acquired were submitted to centroidization (Data Manager software, JEOL Ltd., Japan; .CDF and .GCI data formats). GC Image 2.5 software (LLC, Lincoln, Nebraska, U.S.A.) automatically performed process blank subtraction and baseline correction. In the proof-of-concept study where multiple chromatograms were to be processed together, they were aligned and created a composite template199,200 that included all detected features. The template was manually verified for artifacts, degradation zones, coelutions, and multiple peaks of single compounds (amino acids,201 sugars, and wraparounds that were removed, split, and merged).202 Then, it was applied to each individual chromatogram to generate consistent peak lists examined for transcription errors. Only metabolites present in at least half the samples of any class were kept. The remaining missing values were replaced by the lowest signal measured for the metabolite divided by two. The peak volumes were normalized to the internal standard giving the lowest relative standard deviation (RSD) in the QC samples.17 Outliers were sought by calculating robust z scores, according to the median absolute deviation of the variable in all concerned samples. For z scores over 50, the outlier was replaced by the closest value divided or multiplied by two (maximum or minimum outlier). Finally, the peak volumes were corrected203 for the analytical variation measured in the QC samples through a locally estimated scatterplot smoothing (LOESS) procedure.17 Only the metabolites with a corrected analytical variation (RSD) lower than 30% were kept13,17 with the idea of using “fewer but valid signals, rather than more inaccurate and noisy” ones.130 The statistical tests and methods applied in the following steps (scaling evaluation, biomarker research, bias control, and performance assessment) were conducted with MetaboAnalyst web resource,204 Excel add-in Tanagra205 and RapidMiner,206 and R programs.207
Annotation Relying only on a full mass spectrum comparison provides limited confidence. Therefore,
the most plausible results obtained this way (NIST14 and Wiley 9 libraries, unit mass resolution) were further tested by comparing the theoretical (NIST14, Wiley 9 libraries, ChemSpider, and NIST Webbook web resources) and experimental linear retention indices (LRIs).64 The latter were measured
27
with a standard mix of nalkanes(C8−C20) added to three of the study samples. As a third orthogonal property,15 the mass accuracy was calculated for the highest selective fragments available, usually molecular (M)+· or (M−CH3)+· radical ions. To do so, six study samples (two with low endoscopic activity, two with high endoscopic activity, and two healthy controls) were chosen for their high concentrations in the potential biomarkers. Their biological replicates were analyzed, according to the previously optimized sample preparation and separation conditions on Pegasus GC-HRT 4D (LECO Corporation, Saint Joseph, Michigan, U.S.A.; resolution of 25,000). The secondary oven’s temperature was 15 °C higher than that of the main one. Acceptance thresholds were set for the three types of information: match factor of > 70017 or > 600 with a probability of > 50%, ΔLRI < 25,122 and mass error < 1 ppm for any specific fragment. We finally assessed the biological plausibility of the annotated candidates with the Human Metabolome Database (HMDB208) and the Kyoto Encyclopedia of Genes and Genomes (KEGG209) as well as by conducting a manual literature review. Further interpretation and exploration of these results are beyond the scope of the present paper. Ideally, they should include a targeted confirmation of the variations observed, conducted on an independent set of patients. A powerful approach would be to integrate other omics data obtained on these specific biological samples.
RESULTS AND DISCUSSION
Method Optimization The parameters and the ranges to optimize were chosen based on previous studies. Due to the untargeted nature of the method, we aimed to maximize three factors: the whole chromatogram signal, the signal for the less reactive amino groups, and the number of resolved metabolites. High-quality chromatography was also sought in order for the following automated steps, particularly preprocessing,210 to be conducted reliably and minimize the need for manual correction. Mainly independent from each other, the sample preparation and separation were optimized separately but successively in order to maintain the articulation of the analytical process. In the experiments conducted, methanol (3:1) revealed to be the most efficient extraction solvent, confirming previous results17 (see the Supporting Information, Section S6A, for the detailed results). MSTFA was the most efficient derivatization agent, and its volume was the most influential parameter in the DoE. The global derivatization used 15 μL of MeOX and 10 μL of MSTFA with both reactions performed at 40 °C for 1
28
h. The stability of the response near the optimal values of temperature and duration increased the robustness of the process. Again in accordance with previously published results,127,211 the parameters interacted and compromised between the completion of the derivatization,13 solubilization104 and dilution of the dried metabolites, production of artifacts,104 and hydrolytic degradation212 of the adducts,13 overall leading to moderate optimum conditions. Despite the potential of reverse column sets to use the chromatographic space in specific applications,19,99 the best resolution was achieved with a classical nonpolar/semipolar set (Supporting Information, Section S6B). The (linear) temperature ramp was found to be the dominant separation factor with an optimum value of 3 °C/min. Such a low ramp is quite unusual and, to the best of our knowledge, has never been reported, possibly because it increases the analysis time. Nonetheless, we believe that it takes full advantage of the second dimension of separation. Indeed, producing low elution temperatures at the end of the first column allows the metabolites to spend more time in the second column and to separate better, overcoming the resulting peak broadening. Interestingly, the lower elution temperatures should also help reduce thermal degradation and thus increase the sensitivity. The data acquisition and the temperature ramp were stopped at 240 °C because no metabolite was eluting at higher temperatures. Over 240 °C, a ramp of 15 °C/min was applied, up to the final temperature of 300 °C. The other optimum parameters were a 1 mL/min flow, starting temperature of 50 °C, modulation period of 3.5 s coupled to a 700 ms hot jet, and 250 °C splitless injection of 1 μL- using a “precision” liner. The importance of optimizing an analytical method intended to perform untargeted analysis of complex matrices is already well documented.64 This was particularly the case here for the derivatization conditions, column set, and temperature ramp. Less influential factors should be considered as well because they can contribute to the high-quality chromatography desired, especially in a derivatized environment. However, since many parameters exhibit similar optimum values across various studies that were confirmed for the main part here, time and efforts can be saved by searching around these values or using them directly and controlling them in that they give satisfactory analytical performances.
29
Method Validation To determine the parameters to assess and how to do so, the bioanalytical method validation guidance draft published by the U.S. Food and Drug Administration213 was used as a reference. When necessary, it was completed by specific publications.
Accuracy, Precision, and Recovery The 2D peak volume accuracy compared, through z scores, the NIST certified or reference values of the 28 monitored metabolites to the corresponding measured values (corrected with the most chemically similar IS). As a result, the method was found to be limited to semiquantitation due to the lack of the exact response factors (Table 1 and Section S7 of the Supporting Information). However, for glycine, the only NIST metabolite that we used as an IS, the response factor was calculable and the zscores were <1 in both intra- and inter-batch evaluations (0.5 and 0.9, respectively). Therefore, absolute quantitation seems possible but at the cost of one IS per compound with proper calibration, which would be extremely difficult to achieve in global profiling.64
Table 1. Intra and inter-batch accuracy and precision values for selected metabolites assessed in the NIST SRM 1950.
Mean (µmol/L)
Accuracy z-score Precision RSD (%)
Intra-Batch Inter-Batch NIST Intra-Batch Inter-Batch
Phenylalanine 51.0 11.3 13.1 14 4.2 10.7 Methionine 22.3 7.7 6.4 8 14.8 20.2 Glycine 245.0 0.5 0.9 7 4.1 4.2 Tyrosine 57.3 25.0 26.3 5 4.7 11.2 Histidine 72.6 17.8 16.2 5 9.0 7.7 Glutamic acid 67.0 1.0 1.2 27 3.0 9.2 Uric acid 254.0 27.9 26.2 2 2.8 16.2 Dodecanoic acid 9.5 13.6 12.0 6 3.7 3.6 Myristic acid 80.1 4.1 3.9 21 3.4 4.3 Palmitic acid 2364.0 29.2 28.9 3 7.3 7.7 Heptadecanoic acid 17.6 23.9 23.3 4 9.4 7.8 Oleic. (Z)- acid 1614.0 9.6 9.5 10 3.4 9.9
The precision was assessed through the relative standard deviation in intra- and inter-batchmeasurements. The chromatographic separation was found to be stable and reproducible regarding the retention times, measured in the QC samples (Supporting Information, Section S4). Regarding the peak volumes, the RSD measured in the NIST samples was under 30% for all 28 metabolites monitored in both intra- and inter-batch evaluations. They were even under 10% for 24 and 18 metabolites. This is comparable to the NIST reported values,214 in fact, lower in 13 and 7 cases. It shows the stability of the
30
method that could nevertheless be further improved through the automation of the sample preparation. In the QC samples, the peak volume precision was lower, albeit still good, with 14 and 11 metabolites (out of 16 since the IS had no variation after normalization), having an RSD < 30%. GC−MS data reported previously215 found RSD values lower than 20% for all the 32 representative compounds tested and lower than 10% for most of them. The modulation system and the second chromatographic column therefore seem to be a source of additional variations, hence the need to correct and monitor the peak volumes, here through the use of a QC system and LOESS (partial) correction. It is particularly true for multiple batches since the precision was lower in inter-batch measurements. Homogenization issues due to manual aliquoting could explain the higher RSD in the QC samples compared to the NIST SRM, although the metabolites monitored were not the same. Such issues have been reported.215 It is of primary importance since the QC samples constitute the core of the global quality system on which the method relies. In addition, they should also be aliquots of all the study samples, which is a minor limitation of this study. Regarding the recovery, the differences between the response factors of the standards202 prevented the direct comparison of their signals, especially between the non-derivatized injection standard and the others, which is why negative recoveries were obtained in this case. If absolute values cannot be interpreted, their reproducibility is still meaningful.216 We found a maximum RSD of 15.6% for three different batches of SRM 1950 and QC samples (Supporting Information, Section S8), indicating the robustness of the optimized sample preparation.
Linearity, Range, and Sensitivity These parameters were evaluated using glycine-2,2-d2, succinic acid-2,2,3,3-d4, and fumaric acid-2,3-d2 added to QC samples at five different concentrations (process blank103 and 0.05, 0.25, 1.67, and 10 μg/ mL), each in six replicates. Selective m/z values representative of the IS (deuterated masses) were chosen and used in different types of regressions of increased complexity (unweighted and √S, S, S2, S3, and S4 weights) in order to take the uncertainty of measure into account. To assess these regressions, we avoided the R2 coefficient and preferred the sum of relative errors, the residual plots,217 the range of linearity, and the sensitivity. We found that using a weighted regression was more efficient for succinic and fumaric acids (S2 weights for both). However, the regression parameters of the second were only slightly changed (from y = 43,158x + 6964 to y = 44,021x + 9; see the Supporting Information, Section S9, for details). Glycine and fumaric acid were reproducibly
31
linear along the whole range tested. Succinic acid showed distinct behaviors below and above 0.25 ng/μL. The one below was used to assess the sensitivity. The limits of detection and quantification (LOD, LOQ) were calculated using the regression curves,218 process blank103 samples,219–221 and the RSD of real injections222 (Supporting Information, Section S10A). As a result, fumaric and succinic acids had consistently low LODs (approximately 2 and 5 pg on the column, respectively) and LOQs (6−9 and 16 pg on the column; Supporting Information, Section S10B, for details). Glycine, due to its higher blank signal, had a respective LOD and LOQ of 64 and 90 pg on the column. This was in good agreement with previous GC×GC studies,122,222 especially the one from Koek99 who used an S/N method (extrapolated S/N = 3) and various chromatographic columns settings and obtained LODs ranging from 0.5 to 4 pg on the column for fumaric and succinic acids and from 70 to 280 pg for glutamine (glycine was not assessed). Our results were also compared advantageously with GC−MS where a method optimized for extraction and derivatization reported an LOD of approximately 1−5 pmol on the column215 (100−500 pg injected on the column for an average molecular mass of 100 g/mol and 1 μL injection). In addition, we manually controlled the selectivity through the chromatographic and mass spectral resolutions of the metabolites, which was facilitated by the 2D chromatogram visualization offered by GC×GC. The stability of the derivatized compounds was maximized by limiting the storage time before injection to 2 h at −20 °C.104,127 Overall, despite the impossibility to reach optimal conditions for all metabolites,64 the method was found to be fit-for-purpose. Indeed, according to the results obtained for the metabolites assessed, it should allow the untargeted sensitive detection and semiquantitation (linear behavior) of a large range of metabolites of various chemical classes and concentrations in a stable, therefore reproducible, manner. To do so, the ISs have to be representative of the many metabolites present in the samples. Therefore, the method presented could be further improved by using a larger pool of (carefully selected) ISs. We would recommend to inject at least three ISs per major chemical class and one per minor one. One IS per intensity level (high, medium, or low) and one per retention window (1tR divided into three equal parts). One could also find it useful to implement some recently developed procedures that combine various ISs (CCMN223 and NOMIS224). Absolute quantification, which would require one IS per compound, seems out of reach for global profiling in the actual state of the field. Finally, the
32
method developed for the untargeted analysis of 30 μL of serum samples should be adaptable to other matrices common in metabolomics, such as plasma and urine.53,56
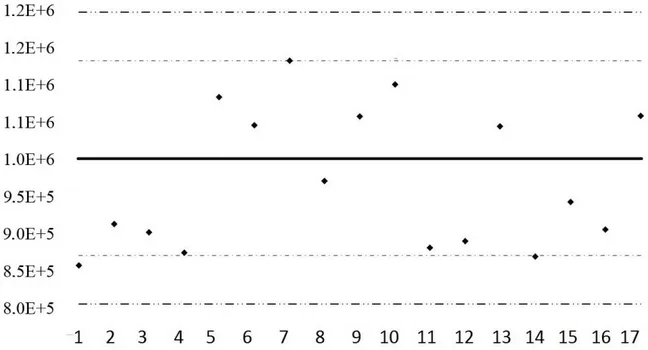
QC System A QC system repeats QC sample injections to monitor the stability of the performances over time, providing assurance of the quality102 of the data. It can also be used to increase it by correcting for the analytical variations through an LOESS procedure.17 Here, control charts were constructed for the 19 representative compounds defined at the validation step. Based on the validation results as well as on previous studies,73,122 the acceptable variations (around the mean value) for the retention times in both dimensions and normalized peak volumes were set to 2 times the modulation period, 5% of the PM, and 30% of the mean. The warning and action limits were drawn at 2 and 3 times these values. Finally, acceptance and rejection criteria were defined for individual injections and batches (Supporting Information, Section S11A). The resulting charts confirmed that the retention times and therefore the chromatographic separation were very stable. Indeed, 18 representative metabolites were well inside the warning limits. The only exception was the cysteine 1tR. Regarding the peak volumes, 11 and 1 metabolites (out of 16 since the 3 ISs were completely corrected by the normalization) had all their nine values inside the warning and action limits. For the four metabolites remaining, which violated at least once the action limits, the control charts were reconstructed with warning and action thresholds set to 2 and 3 times their measured standard deviations.225 This way, the system was considered under control as long as these metabolites behaved within their usual ranges of values, even if it was over the acceptable 30% threshold. From a methodological point of view, the results obtained with nine injections over two days seemed to define well enough the control state of the analytical system. Anyway, for studies analyzing large cohorts over long periods of time, it would be advisable to inject multiple batches (at least five) of multiple (at least three) daily samples distributed over at least two weeks. Performing maintenance actions in that time frame would allow to evaluate their influence on the system. A representative example of a QC chart is provided in Figure 1.