D4.5a - Design of interactive visualization of models and students data
GRAPPLE
D4.5a Version: 0.7
Design of interactive visualization of models and students data
Document Type Deliverable
Editor(s): Riccardo Mazza and Luca Mazzola (USI)
Author(s): Riccardo Mazza and Luca Mazzola (USI), Christian Glahn and Dominique Verpoorten (OUNL), Alexander Nussbaumer and Christina Steiner (UniGraz), Dominikus Heckmann (DFKI).
Work Package: WP4
Due Date: February 1, 2009
Delivery Date: <<Delivery Date>>
Version: 0.7
Version Date: Riccardo Mazza
Total number of pages: 55
Abstract: This document reports the design of the interactive visualizations of open student models that will be performed in GRAPPLE. The visualizations will be based on data stored in the domain model and student model, and aim at supporting learners to be more engaged in the learning process, and instructors in assisting the learners.
Keyword list: student modeling, model representation, interactivity, privacy, smart indicators, learning interaction cycle, pedagogical aspects
Disclaimer:
All information included in this document is subject to change without notice.
The Members of the GRAPPLE Consortium make no warranty of any kind with regard to this document, including, but not limited to, the implied warranties of merchantability and fitness for a particular purpose. The Members of the GRAPPLE Consortium shall not be held liable for errors contained herein or direct, indirect, special, incidental or consequential damages in connection with the furnishing, performance, or use of this material.
D4.5a - Design of interactive visualization of models and students data
Summary
The GRAPPLE Project (Generic Responsive Adaptive Personalized Learning Environment), aims at delivering to learners a technology-enhanced learning (TEL) environment that guides them through a learning experience, automatically adapting to personal preferences, prior knowledge, skills and competences, learning goals and the personal or social context in which the learning takes place. The system will include a user model infrastructure that keeps track of the learner's knowledge and skills acquired during the learning process. This learner’s knowledge will be made available to the students and instructors by means of interactive visualizations that will be performed in GRAPPLE. The visualizations will consider the student model, the domain model, and aim at helping instructors in assisting the learners and also may help learners to be more engaged in the learning process.
This deliverable reports the outcomes of the first phase of the Task 4.5 of the GRAPPLE project, and includes an analysis of the state of the art in the field of user modeling, the requirements analysis undertaken with potential users of the systems through a series of interviews and meetings, an initial description of user model (UM) and domain model (DM) components, which provide the input data for the visualizations, some possible scenario of usage to guide the following phases of the work, and the technical infrastructure.
This document will serve as basis for the following phases of production of Task 4.5 (namely, implementation, and evaluation and refinement) and as reference for the relations to other GRAPPLE modules.
D4.5a - Design of interactive visualization of models and students data
Authors
Person Email Partner code
Luca Mazzola [email protected] USI
Riccardo Mazza [email protected] USI
Christian Glahn Dominique Verpoorten
[email protected] [email protected]
OUNL
Dominikus Heckmann [email protected] DFKI
Alexander Nussbaumer Christina Steiner
D4.5a - Design of interactive visualization of models and students data
Table of Contents
SUMMARY ... 2 AUTHORS ... 3 TABLE OF CONTENTS ... 4 LIST OF FIGURES ... 6LIST OF ACRONYMS AND ABBREVIATIONS ... 8
TASK AND DELIVERABLE DESCRIPTION ... 9
1 INTRODUCTION ... 10
1.1 Objectives of the work ... 10
1.2 Objectives of this deliverable ... 11
2 RELATED WORK ... 13
2.1 User model representation ... 13
2.1.1 Learner Model... 13
2.1.2 Open Learner Model ... 13
2.1.3 Interactive Open Learner Model (IOLM) ... 14
2.1.4 Learner models opened to peers... 15
2.1.5 Group modeling ... 15
2.1.6 Open issues ... 15
2.2 Graphical representations of students tracking data ... 16
2.3 Smart indicators ... 16
3 REQUIREMENTS AND SOURCES OF DATA ... 19
3.1 Relevant findings from the requirement analysis ... 19
3.2 Relation to other GRAPPLE modules ... 20
3.2.1 Relation to Domain Model ... 20
3.2.2 Relation to User Model ... 21
3.2.3 Summary of data sources ... 23
4 CONCEPTUAL APPROACH AND RESEARCH ... 24
4.1 Conceptual approach ... 24
4.3 Privacy issues ... 26
4.4 Evaluation of visualization ... 27
5 SCENARIO OF USAGE ... 29
5.1 Scenario for learners ... 29
5.1.1 Case 1 – no effects ... 30
5.1.2 Case 2 – further study ... 30
5.1.3 Case 3 – quiz retake ... 30
5.1.4 Case 4 – peers ... 30
5.2 Scenarios for instructors ... 30
5.2.1 Case 1 – problematic concept ... 30
5.2.2 Case 2 – student “not aligned” ... 31
5.3 Scenarios for administrators ... 31
6 TECHNICAL INFRASTRUCTURE ... 32
6.1 Interface with other GRAPPLE components ... 32
6.2 Technical specifications ... 33
7 INITIAL IDEAS FOR THE DESIGN OF VISUALIZATION ... 34
8 CONCLUSIONS ... 36
REFERENCES ... 38
List of Figures
Figure 1: Example of a domain map ... 21 Figure 2: Public access, research purpose, short retention ... 26 Figure 3: Friends, commercial purpose, middle retention ... 27
List of Acronyms and Abbreviations
GRAPPLE Generic Responsive Adaptive Personalized Learning Environment
LMS Learning Management System
UM User Model
DM Domain Model
WP Work Package
LeMoRe Learner Modeling for Reflection
LM Leaner Model
OLM Open Learner Model
IOLM Interactive Open Learner Model
OGM Open Group Model
Task and Deliverable Description
T4.5 Design and implementation of methods and techniques for the interactive visualization of domain and user models and of performance data (USI, OUNL, UniGraz, DFKI)
We will explore graphical representations that enable the learner to interact with and explore their history towards gaining insights into their learning processes. The use of graphical representations allows to concentrate in a relatively small (screen) area large amounts of data, and use the human visual system and cognitive skills for a quick understanding and interpretation of data. To create these representations we will consider the domain model and the current student model and some smart indicators on learning interactions. Indicators help actors to organize, orientate and navigate through complex environments by providing contextual information relevant for the performance of learning tasks. We further investigate smart indicators to support learners to be more engaged in the learning process. The result of this task will be an integrated software environment that will make use of interactive visualization that can be used by the learner to explore their student and domain models.
D4.5a Design of interactive visualization of models and students data (USI, M12)
This deliverable will report the design of the interactive visualizations that are performed in GRAPPLE. Such interactive visualizations will be imbued with targeted information about metacognition, thus encouraging the learner to think about the process of learning towards enhancing their skills.
D4.5b Implementation of interactive visualization of models and students data (USI, M21)
This deliverable will describe (and include) the software that generates the interactive visualizations of models and students data.
D4.5c Evaluation and refinement of interactive visualization of models and students data (USI, M30)
This deliverable will report the evaluation of visualizations that will be carried out with a number of users, and we will investigate how learners interact with and explore visualizations of their learning history. Depending on the result of the evaluation, specific refinements to the software may be accomplished.
1 Introduction
1.1
Objectives of the work
The GRAPPLE project aims at building a technology-enhanced learning environment that adapts the content of a course to the students’ personal preferences, prior knowledge, skills and competences. To provide such advanced features, the GRAPPLE system will include a User Model infrastructure that keeps track of the learner's knowledge and skills acquired during the learning process. An active research discipline called “Open User Model” has demonstrated in several occasions that opening this “internal” knowledge representation of the user model may have numerous potential benefits to students, ranging from enhancing the learning process (Bull and Pain, 1995) (Self, 1990) and improving diagnosis in educational systems (Bull and Pain, 1995) (Morales, Pain, and Conlon 2001) (Self, 1990) (Tanimoto, 2005) to easing the difficulties in using systems in general (Maass, 1983).
The primary reason to open the model is to encourage reflection as a learning process (Bull, 1997). Reflection is a metacognitive skill in which students examine their own knowledge. This metacognitive skill is encouraged by allowing the student to inspect and, in some cases, to modify the student model. As the student views and/or interacts with the information about their knowledge state held by the tutoring system, he/she reflects on his/her model’s characteristics as described by the system, thus gaining a greater understanding of the domain, his/her current beliefs, and performance within the system (Bull and Nghiem, 2002).
Related to open student models is also the idea of opening up the learner model to the scrutiny of other peers. This requires a different approach, as users of a public model have different purposes than a user viewing his/her own model. Allowing the student to access other models provides many advantages. By comparing their own characteristics to others in a course, the learner may gain a greater understanding of his/her problems in the domain by directly comparing results to those of an expert or average student (Bull and Nghiem, 2002). This provides the opportunity for a student to compare their progress against that of their peers. Viewing a potential helper’s characteristics can aid in choosing the best helper from a list (Collins et al., 1997).
Student models can be also made available to tutors and instructors for inspection and tuning. This can be used by instructors to adapt their teaching to the individual (Kay, 1995; Zapata-Rivera and Greer, 2001; Bull, 1997), to better understand their students and help individuals with particular problems (Bull and Nghiem, 2002), and to control the progress of the class during the learning process (Mazza and Dimitrova, 2007).
In the GRAPPLE system we want to support the student with the acquisition of meta-cognitive skills, and the instructors with a tool to monitor the current status of knowledge of their learners. One of the main objectives of WP4 is hence to explore the usage of open student models in GRAPPLE. In order to “open” model to students, peers, and instructors, we will make use of graphical representations, supported by the last developments from Information Visualization (Mazza, 2009; Spence 2007). These representations will provide the learner’s individual progress through a structured domain of knowledge, showing the learner’s state (with a possible extension to represent the history) in relation with concepts and competencies. The use of Information Visualization to facilitate instructors in distance learning has been has been object of research in (Mazza and Dimitrova, 2007). Antonija Mitrovic and Brent Martin (Mitrovic and Martin, 2007) have shown how a very simple visual student model format, like the skill meter, built on top of a complex model, may be successful in supporting learning and metacognition, and facilitating the selection of appropriate problems, for university level learners. Our contribution to the GRAPPLE system is primarily focused on supporting students with some motivational impact related to the awareness of personal current state, secondly in enabling teaching staff to take care of remedial action or didactic modification before the actual emergence of problems, guided by suggestions extracted from these graphical representations. We will explore the usage of graphical representation of open student model and tracking data seems to be useful to this end.
To achieve this objective, we will implement a specific module in GRAPPLE that creates a sort of “user profile” based on data stored in other GRAPPLE modules. In particular, we collect data from the user model and from the domain model, model the state of knowledge using a set of indicators, and visualize this information alongside with comparative information of other students of the on-line class. Because students may compare such information to their own beliefs about their knowledge, this can be a powerful method of fostering reflection. The relation with other GRAPPLE modules is described in details in section 3.2.
Recent works have also tried to open models of groups for inspection and interaction. However, the research in this topic is still at an early stage, and lots of questions on modeling groups of students are still
unanswered (which characteristics should be used when modeling groups? Which of these characteristics can be opened to the group members? And how this might be achieved? When a model should be opened to a group? What aspects of a model can and should be opened? (Dimitrova, McCalla, Bull 2007). Despite the lack of well-established research on group models, in GRAPPLE we want to explore the process of modeling group characteristics, as we want to support the students with a feeling of being part of a community. Collecting data and representing some information about the reference group for a user could support this kind of task. A simple and pragmatic approach, such as defining simple group models composed by averaging the values of individual student models was already proposed in past works (Chen et al. 2007; Bull, Mabbott and Abu Issa 2007; Lazarinis and Retalis 2007) and can be adopted in GRAPPLE as well. Our main concern in the GRAPPLE system is to provide useful information for the user’s needs, designed specifically to what he/she wants to discover from the model, or to provide the opportunity for the user to find and choose the characteristics he/she would find the most helpful (Hansen and McCalla, 2003). To this aim, we will adopt a role-adapted approach, which will show the appropriate information according to the role of the users (student, peer, tutor, instructor). As students have different purposes and needs than peers and instructors, one of the challenges of our work is to provide the meaningful representation to the users of the different roles that use the GRAPPLE system. This aspect is explored in section 7.
The use of 'Smart Indicators' (Glahn, Specht & Koper 2007) is proposed as a way to aggregate user model information in a compact and intuitive way. An indicator is an object that draws our attention to ongoing relevant events only when it's really necessary: for example a charging/discharging/low-level battery light on a laptop is an indicator. This kind of indicators is classified as 'smart' because they try to be a high level aggregator of valuable information. Because learners naturally look for success indicators while learning (somewhere indicated as feedback) their importance in learning is stressed as element of support in the cognitive process. Smart indicators are described in section 2.3
Although we rely on existing works for our proposal, we need to face some problematic aspects, related to the privacy and security of the data, the trustiness perceived by learner about the system. These aspects are discussed in section 4.3.
Finally, the instructors and learners will use the proposed visualizations during their teaching and learning activities through the Learning Management Systems (LMS), hence part of the study will be dedicated on how to seemly integrate the graphical representations in the LMS.
1.2
Objectives of this deliverable
From the Technical Annex of the project proposal:“This deliverable will report the design of the interactive visualizations that are performed in GRAPPLE. Such interactive visualizations will be imbued with targeted information about metacognition, thus encouraging the learner to think about the process of learning towards enhancing their skills.”
Task T4.5 of Work Package 4 aims at opening the user model of the GRAPPLE system to students, peers, groups, tutors, and instructors of the learning environment by means of interactive graphical representations. The work will be carried out in 3 phases, as described in the Technical Annex of the project proposal:
1. Analysis of the requirements, study of the related works, and design of the open student module 2. Implementation of the open student module
3. Evaluation and refinement
Each of these phases will produce a specific deliverable. This document reports the outcomes of the first phase of the work.
This document starts with an analysis of the state of the art in the field of user modeling, with a particular attention to its application in the context of the Technology-enhanced Learning (section 2). Also, some initial considerations about the applicability in our project of already existing solutions are expressed. In particular, we will focus our attention to the works that support the meta-cognitive process, as our goal is to propose a solution able to offer this feature to the users into a fully integrated view. In this way, the learner should be encouraged to reflect about the process of learning and achieve and enhancement of the personal skills. In section 3 we will report some ideas that come from the requirements analysis undertaken in the past months, together with a description of user model (UM) and domain model (DM) components of the GRAPPLE system, which provide the input data for the visualizations.
Some possible scenarios are proposed in section 5 to guide the following phases and to investigate the feasibility and coherence of our ideas with other components of the GRAPPLE project.
The technical infrastructure is described in section 6.
In section 7 we deal with some initial ideas for the project of student’s profile visualizations and we conclude with some short recap of this document in the last chapter.
2 Related Work
As previously stated in section 1.1, our work is based on research in the fields of open user modeling, information visualization, and smart indicators. The following paragraphs will introduce these subjects, investigating the actual use, some considerations about a possible adoption in our project, their limitations, and some open issues.
2.1
User model representation
With the introduction of the new paradigm of personalized environments, the aspects of adaptation and personalization of computing systems to the users' characteristics, preferences, knowledge, and tasks is assuming a very central role. Strictly correlated to this aspect is the creation and update of the user model that contains the main reference data upon which the systems can offer a real customized experience. A long time research (almost 25 years) was conducted on profiling user for very different tasks. Obviously, this process could be done and assumes relevance only when it is based on data collected from the users. This data is stored in user model, it aims at providing the functionalities for sharing and reasoning about user data, delivered by an adaptive system.
The modeling process is quite complex and involves different steps: decision on and structuring the information to be collected, collecting raw data, scrubbing, extracting some practical rules or supporting evidences, storing the most useful and, if necessary, updating existing ones.
Nowadays, the applications of user modeling are so diffused that is not easy to indicate some examples as a reference. In fact, there are many different fields of application and environments that ranges from a simple collection of demographic or location data (for example, in many mobile devices) to a tentative fully representation of the human being inside the virtual space of the system.
2.1.1 Learner Model
In educational system, user model is commonly referred to as student model or learner model. Traditionally, the first approach to the problem was to keep the learner model internal to the system, unavailable for inspection to the user: this is due to the fact that the main objective connected to the modeling process was to enable systems to take into account users‘ knowledge, preferences, goals, motivations, affective state, etc.
To study advantages and limits of modeling learners in adaptive educational systems, some applications have adopted the strategy of including the student model as internal component of the educational systems, whereas other have developed the learner model as an external facility. Model approaches aim at developing the student model as an external component, as it can brings several advantages. The GRAPPLE project follows this approach.
In the following paragraphs we will describe some research directions and applications of learner models. We will describe them in a sort of temporal evolution of research approaches, from the open learner models to the most recent approaches of modeling the group of students, not only the individuals.
2.1.2 Open Learner Model
The research on learner models tried to face two main problematic aspects of profiling: the risk of inaccuracy of the estimated models and the dynamics of the evolution of students’ knowledge, strictly connect with the stability problem and the robustness of modeling process. Many researches in the field of artificial intelligence in education proposed methods to deal with these problems, but it was quickly realized that not all of the aspects of learning are captured in the user model and the information stored in the model can be unreliable. So, one of the direction proposed was allows learners to access their model, asking them to inspect, change the content in order to gain a more accurate model, and contribute to the part of the model that can’t be derived automatically, such as learner goals, emotional states, and so on.
An unexpected, but quite interesting, side effect of this process was the possibility for the users to inspect their model and using it as self-reflective tool and a learning resource to recap their status. In this way, the modeling process became meaningful and useful also to the students. A new research direction, the open learner models (OLM), enabled students to access their model, view information about their estimated knowledge, and reflect on their understanding.
The research field on open student models produced a plethora of approaches and methodologies, and it was very difficult to compare different systems. Researcher needed a systematic approach to analyze,
design, and describe the Open Learner Models. The lack of a framework to discuss open learner models become evident, and a recent work proposed a framework, that the authors called SMILI (Bull & Kay, 2007), which allows comparing the features of open learner models in different systems.
An interesting list of system that implement some open learner model is presented at the LeMoRe website. (http://www.eee.bham.ac.uk/bull/lemore/examples.html last accessed on 10/11/2008). In this list, we found of particular interest the Flexi-OLM system (Mabbott & Bull, 2004) and the SQL-Tutor approach (Mitrovic & Martin, 2002). In the first one the model is exposed to the user in seven different types of representations, allowing the student to select the most appropriate representation for a particular occasion. SQL-Tutor is aimed to expose a very simple representation of user model (the so called skillometers, a very intuitive bar-graph presentation of covered and learned subjects) and demonstrate that even very simple representations are useful to support students with self-reflection processes.
A new term, “scrutable user models”, was introduced by Judy Kay in 1999 (Kay 1999). The notion of scrutability is related to the possibility of the user to scrutinize the model to see, not only what information the system holds about him, but also the process used by the system to collect the data about the user and the inferences based on that data.
It must be noted that scrutability concerns inherently convey a complementary but different view on personalization, which stresses upon the learner's awareness of the personalization process he is committed to. Recent insistence on scrutability or “inspectable open learner models” (Ahn et al. 2007; Bull & Nghiem, 2002; Czarkowski & Kay; Kay, 1997; Kay, 2002; J Kay, 2006; R. Kay & Knaack, 2005; Zapata-Rivera & Greer, 2001) advocate for explicit communication to students of the pedagogical aspects framing the personalized learning experience designed for them by an adaptive learning technology. It posits that learning and ownership and autonomy development requests the sense of control of the learning environment. It also acknowledges the importance to reflect about oneself in a defined learning context.
2.1.3 Interactive Open Learner Model (IOLM)
Following this line, researchers interrogated themselves about the potential of allowing the user to interact directly and, in case, change his/her profile. The research concentrated on two different types of interaction in open learner models: inspection methods and interactive methods.
With inspection methods, the student can manipulate the representation of his/her profile, change the appearance, apply filters to the visualization and achieve in this way a more deep understanding of the model adapting the presentation of the external model to the individual preferences. The already cited Flexi-OLM system could be considered of this type.
Interactive methods allow the learners to interact with the internal representation of the model, change the data used by the system to represent the user itself. In this case, one big problematic aspect could be the verification of the real understanding that the user has of the model, and which data support the claim for changing the internal profile according to the user request. To solve this problem, some systems use a challenging process: they ask learner to solve a problem related to the particular aspect that should be changed and decide if this modification will be done based on the performance expressed in this process. These two approaches have different impacts on the creation of the profile because the two main processes able to create and evolve the model (the reasoning over the extracted information and the knowledge extraction on raw data collected from environment) need to be aware of the modifications that the learner could introduce in the current version of the profile.
Interesting works done in this field produced a big number of well know system, such as VisMod (Zapata-Rivera & Greer, 2004), STyLE-OLM (Dimitrova, 2003), MrCollins (Bull, Pain & Brna, 1995) and INSPIRE (Papanikolaou & Grigoriadou, 2008).
The first two offer more guided interaction with IOLM, with the possibility for student and teacher to annotate the Bayesian network used to represent the model (VisMod) and some dialogue games to support request of change made by students in the conceptual graph (STyLE-OLM); the others let the learner the freedom to inspect, change and argue for supporting evidence (MrCollins) and modify directly the model to guide the system, that provide you as a result with some information with the estimation process and the impact of this modification on the offered functionality (INSPIRE).
By making explicit to the student how the system collects the data about him/her and how the adaptations are performed based on profile, IOLM could deeply impact the learner's expected meta-cognition process. Being aware of this process, the students could engage and enable the self-reflection on the dynamics of the process of learning.
Also, from the point of view of teacher or tutor, OLMs seem to be useful because they can help in planning future learning events by assisting the learner in applying their strategic knowledge.
2.1.4 Learner models opened to peers
Most of open student models aim to open the learner model to the learner. They not consider that, almost always, other students are using the same system, are studying the same concepts, and are doing the same learning activities almost in the same time. Each student has a personal profile and is not able to see other's profile or some information extracted by aggregating related aspects in different profiles. The success of social and collaborative approaches in education led to investigate new approaches of aggregating individual student models in multi-user systems such as Learning Management Systems, Collaborative systems, and learning communities.
Opening models to peers and colleagues bring new problems, such as privacy, control over personal data, and trustiness of the system.
One possible approach to deal with some of these problems was presented in the UMPTEEN system (Bull, Mabbott & Abu-Issa, 2007), whose main characteristic is to distinguish between friendship network and
peers' group. Students can decide which part of their profile release in a named (or anonymous) form, and
who is authorized to access this data representation (peer models). Instead of allowing everyone to access an anonymous version of the peers data, UMPTEEN’s approach is very flexible and customizable. The UMPTEEN system was developed in order to investigate students' views about releasing their learner model more widely, and to observe how they use their own and peer models. It has been observed that opening the models to pees can foster collaboration (with friends) and competition (with peers).
2.1.5 Group modeling
Group modeling is a recent field of research, in which the students as a group are modeled instead of the single individual. They consider the characteristics of an identified group of students, and aim also at present the position and the relative distance of profiles, in order to allow students to compare themselves and understand their situation. Opening group models to the users may offer some advantages. It can help learner to reflect on their progress in the group context and understand the problems other face (Vassileva et al. 1999).
Group models have been used to support the collaboration between learners of the same group, and to foster the competition in a group of learners. Right now, only simple methods have been used to mine the group models. The most common is to use the average of individual values representing a particular aspect considered in the model.
Recent studies (Bull, Mabbot & Abu-Issa, 2007) have demonstrated that students take a different approach in releasing their models to others depending on the size of the group. In small groups, learners have a positive approach in releasing their profile, even in named form, and the process evolve toward the collaboration. In the opposite direction, when the group dimension is large, users are more sensible in releasing their model and fell less confident in release also their name: this approach causes a more competitive use of the other anonymous profile.
The same study reports a possible solution to foster collaboration inside a group. The learning environment should allow students to create two groups: peers and friends, and have to allow a named release to the second one: in this way, can be established a more balanced mix between competitive and constructive mood in the group relationship.
A quite complex system was presented in a recent paper (Rueda, Arruarte & Elorriaga, 2007): the DynMap+ is a learning/teaching tool to represent through conceptual maps individual and aggregated profiles, including different source for supporting evidences, several visual mechanism to represent data and the possibility to explore the evolution of the models during the different learning sessions.
2.1.6 Open issues
A large number of open issues have to be addressed before the open modeling process can be proposed as a useful resource for students for self-reflection. Security, privacy and trustiness of the system are some of these: the first one assures that personal data cannot be stolen, the second one takes care of the correct level of visibility for sensible data, and the third one represents the perceived reliability from the point of view of final users.
Another important aspect to explore is the how the student use the open models. This is important to understand the expected effects on the learner attitude towards system and learning activity/resources. Moreover, it is interesting to investigate the possibility to improve the effectiveness and efficency of open models by combining together the spontaneous access of the student to his/her model with the opportunity to automatically display the user model in a particular moment of the learning process.
It is well known that when we introduce a new feature or a new functionality in a learning environment, this attract the students’ interest only for limited initial amount of time. After that initial stage, only a real engagement could work as a catalyst of attention, so the question became: how to keep alive this interest? This is especially critical when the cognitive load needed to interact with this object is still high. Another issue is the value given by the students to the displayed information. The mere presence of such possible food for "meta-thought" is not a sufficient condition for having students or teachers make use of it. Incentives for a broader use of interactive visualizations should also be documented. One way to promote the usage of open student models, and to encourage the students to release their profile to peers and friend (either in anonymous or named form), is to learn how the open group models can be of some utility to support the social interactions in a learning environment.
2.2
Graphical representations of students tracking data
One of the tasks in which computer are more able than human beings is to collect, memorize, treat and classify big data collections. So, almost every computer-based system collects a very huge amount of data in the form of logs. This is done with many different objectives in mind, ranging from the possibility to mine interesting data in case of errors, to extract information about usage of functions. For example, user access data is collected by recommender systems to provide personalized suggestions in e-commerce applications (Dieberger, 1997; Wexelblat & Maes, 1999).
In the field of Technology Enhanced Learning, the tracking of students data could be achieved at different aggregation levels, depending on the granularity of user data stored in the system and on the technology adopted. Tracking student interactions have been used in several ways for enriching learning experiences and supporting learning processes (Farzan & Brusilovsky, 2005; Dron, Boyne, & Mitchell, 2001; Erickson & Kellogg, 2003; Glahn; Specht; & Koper, 2007; Drachsler, Hummel, & Koper, 2008; Dron, Boyne, & Mitchell, 2001).
When a representation of these data should be produced, a first problem that emerges is how to make meaningful information to 'pop-out' from the enormous amount of raw logs. One approach to solve this problem is to use data mining techniques with some domain specific rules, such as in (Hübscher, Puntambekar & Nye, 2007) or with some general webhouse (Zorrilla, Millan & Menasalvas, 2005), where the term refers to a web instantiation of the general data warehouse.
Normally the output of such a process is, at a first stage, a very complex and multidimensional space, aimed at extracting information and the correlations between data. The graphical representation of this multidimensional data is one of the key aspects, because the explicit visualization and analysis of the relevant relations between different data represented can provide the user with useful insights about his/her status.
By presenting the students’ data in a graphical format, we exploit the potential of the human visual system and, in particular, of perception, that allow us to detect almost instantly a great number of visual attributes, such as color, shape or length. In this way, a well-designed graphical representation can be a useful tool to present a complex set of data. By examining the representation, we can learn more about the data, make new discoveries, and gain insights about it.
One of the major problems of displaying data in graphical format is the effort required by the user to interpret the visualization and understand the data encoded with graphical attributes. Sometimes, a simple table is more effective than any visual representation of data. A graphical representation that works well for a particular type of users might not be suitable for another type of users. To overcome this problem, recent approaches are trying to adapt the presentation to the type of users. We think that this approach, of adopting the representation to the type of users, is worth to be explored in GRAPPLE as well.
Some interesting examples of system aimed at graphical representing student tracking data are CourseViz (Mazza & Dimitrova, 2007), GISMO (Mazza, 2006) (Mazza & Botturi, 2007) and Moodog (Zhang et al, 2007).
2.3
Smart indicators
As the previous section already stated, one problem related to visual representations of tracking data to learners is the complexity of the available information. This has also been identified for the visualization of student models in adaptive learning environments. For that reason is the majority of such information presentations implemented as additional components of an learning environment (Kay and others). At the same time, learners need various types of information in order to monitor the progress of the task while performing. Actors depend on this information in order to organise, orientate and navigate through complex environments by utilising contextual information (Butler & Winne, 1995; Weber, 2003).
2.4
The Learning Dashboard
It is plausible that part of the meta-cognitive activity consists in building a mental model of the learning context and of oneself inside, so that actions can be tuned to it. In that process, the learner must exert her understanding – and this is a meta-learning operation that can be performed for the action, in the action and on the action - on three types of learning aspects: situation related aspects (fixed components of the learning task), learner self-related aspects (learning behaviours and achievements) and social-related aspects (as Web 2.0 gains momentum, this social information increases in quantity and availability, inviting to a systematized observation of its potential for promoting meta-learning).
Making manifest to the learner the various components of a learning situation and supporting their articulation is an important but not a trivial task. At this point, we introduce the notion of "Learning Dashboard" (Verpoorten, 2004, p. 12; 2007), intended to support this cognitive work, needed for an appropriate self-monitoring. The Learning Dashboard is a cohesive display mirroring the current situation of the learner in the learning process. The below illustration gives a concrete example of this effort to condense and combine different types of personal information (See other commented illustrations in Appendix),.
The Learning Dashboard of the Tell Me More platform informs the learner not only about the available content but also mirrors his personal relationship to this content.
Dashboards can be used for the provision of information visualizations of different degree of complexity: "interactive visualization", namely visualizations the learner can act upon, "responsive visualization", that is interactions that react on user activity or, more simply, "mirroring visualization", i.e. that just present information about different components of the learning task and learner's actions within.
This demand for a process integrated information provisioning means that the visualization should be accessible to the user while using different tools in their environment. While using a tool, such as a content repository or discussion forum, tracking data or learner models are not within the primary focus of the learner. This challenges the information visualization because the provided information is peripheral to the learners primary goals of a task.
Indicators are one approach to provide meaningful contextual information as part of task activities. Indicators provide a simplified representation of the state of a complex system that can be understood without much training. For instance, the fuel needle of a car is an indicator that summarizes how full the tank is and how far one can drive. Such indicators focus the attention to important facts that one could miss or ignore otherwise. Indicators are mechanisms to provide simplified information that are valuable to a task. With some background knowledge people can understand the meaning of an indicator without the need of knowing about the details of the underlying creation process or mechanism.
An indicator system is defined as follows: An indicator system is a system that informs a user on a status, on
past activities or on events that have occurred in a context; and helps the user to orientate, organize or navigate in that context without recommending specific actions. (Glahn, Specht, & Koper, 2007)
Sample indicators are presented by Erickson et al. (1999), Erickson & Kellogg (2003), Kreijns (2004), and Glahn, Specht, & Koper (2007, 2008b, 2009). The idea shared by these simple visualizations is that they can get embedded in or at least aligned with the interfaces of the interaction context which they aim to support. However, while the indicators are not directly relevant for the interaction context, the presented information can be considered as peripheral to the primary goals of the learners.
Indicators play an important role in supporting learning in social environments. By providing contextual information, different indicators have been shown to stimulate social interaction between users (Erickson & Kellogg, 2003; Kreijns, 2004). This effect has been related to the social affordance of indicator visualisations (Kreijns, 2004). Social affordance describes the level of attracting social activity for an indicator. With respect to learning processes three types of activities can be distinguished: (1) awareness on peer activity (Erickson et al., 1999, Kreijns, 2004, Glahn, Specht, & Koper, 2009), (2) engagement in social collaboration (Ericksson & Kellogg, 2003) and learning activities (Glahn, Specht, & Koper, 2009), and (3) reflection on past activities (Glahn, Specht, & Koper, 2008b).
Recently, it was pointed out that social affordance is not built into indicators and where it is present, the effects can differ for the individual learners within a group (Glahn, Specht, & Koper, 2009). It was shown that some indicators have positive social affordance for some learners and negative social affordance for others; while other indicators can only attract social activity for a very limited time. The former case suggested that the kind of social affordance is dependent on a learner' context. The latter case suggests that the temporal context of an indicator influences the effectiveness of the presented information.
Most indicators implement a static approach of providing information to learners rather than adapting to the learning process (Glahn, Specht, & Koper, 2008a). These approaches are considered as static as they implement a fixed set of rules to collect, to aggregate and to indicate information to learners. The recent findings on context dependency of indicator perception suggest that such static approaches are most effective if they are used within homogeneous learner groups and pre-structured knowledge domains. In more complex environments static approaches may have no or even negative effects on the individual learning processes.
Smart indicators approach this problem by personalising and contextualizing the presented information to the context of the individual learner. A smart indicator can adapt the information aggregation, the information visualisation, or both depending on a learner's context. This means that a smart indicator does not only reflect the aspects of visualizing aggregated information but also contextual aspects of learning.
A smart indicator is therefore an indicator system that consists of three essential components that are built on top of a sensor network: a data aggregator, a adaptation controller, and an information visualizer (Glahn, Specht, & Koper, 2007). These components follow the general architecture for context adaptive systems proposed by Zimmermann, Specht, & Lorenz (2005). Therefore, smart indicators can be considered as a adaptive indicator system that uses pre-defined adaptation strategies to personalise and contextualise simple information visualisations to a learner's needs.
From the perspective of the GRAPPLE project there are three key challenges regarding smart indicators. The first challenge is to define flexible data aggregation across virtual learning environments and other social software. The second challenge is to define appropriate adaptation strategies for smart indicators for supporting individual learning. This requires a better understanding of the contextual factors of interpreting indicator information and how this relates to the motivation in learning. The third challenge are to define visualisations that are simple enough for embedding them into other application contexts but are still complex enough to contain valuable information for the learners.
3 Requirements and sources of data
3.1
Relevant findings from the requirement analysis
As part of the initial activities in the GRAPPLE project, a requirements elicitation and analysis was conducted, in Work Packages 9 and 10, through a series of interviews and meetings. The results of the interviews conducted with a series of end users involved in the academic and industrial settings are documented in D10.1 and D9.1.
This analysis was focused on capturing the key adaptivity requirements through the user interviews, rather than the requirements for the visualization of user model. This means there was no detailed questioning on preferences and needs with respect to visualization. However, some results from this analysis are still relevant to our work
From the analysis of open answers and interviewees’ comments documented in the interview summaries, it can be seen that the visualization of acquired knowledge and learning progress is considered to be important.
“Many considered the visualization of the various stages of learning and how they are adapted an interesting
prospect. One learner raised the question as to how he or she can know ‘if they haven't missed anything important?' Learners need a visual map of where they are and where they are going with important milestones clearly marked. The training providers and tutors also require visualization of the learners’ progress and the structure of the course as it currently stands. This is one of the concerns of WP4 – especially for the authoring stages.” (D9.1, p.30)
“The user model need not be a black box (e.g. the permanent record of a ‘school’) used only by an adaptive
learning system; it can be viewed in a more positive light as a learner’s portfolio. The learner should always be able to inspect its contents to some degree. The system should be able to point out weakness between what a learner thinks he or she knows (perhaps through voluntary questionnaires) and what they appear to know from tests and exercises. It can help them identify their strengths and weaknesses. It could also point out the discrepancies (if any) between an optimal learning path and a preferred learning path as indicated by the learner. To a lesser degree, it may be used to match learners with their peers who are strong in areas they are weak in and vice versa.” (D9.1, p.31)
These findings are in line with results from the quantitative and content analysis of the stakeholders’ responses regarding adaptation criteria, which showed that the user characteristics deemed most important for adaptation are learning goal/task and learner knowledge. These are actually the main user model variables in direct relation to the learning task. Not only an adaptation to those variables but in addition also an appropriate visualization can be assumed to be supportive and effective for the user and the learning process in an adaptive system.
In order to realize a successful tailoring of the learning process to those variables, in addition to the adaptation process itself appropriate visualizations of the respective information appears desirable. Thus, suitable visualizations are desired and assumed to have a supportive and effective for the user and for learning with an adaptive system – and as the above excerpts from the requirements elicitation show users are also aware of this.
Hence, these results from the requirements analysis, pose to us the following requirements:
• The visualization has to make clear what are the main parts/concepts of the course. Important milestones, in terms of learning objectives, should be also represented
• Learners should be able to inspect the content of user model to see what is his/her current status, how they are progressing with respect to the learning objectives defined by the teacher.
• Any discrepancies between learning objectives and the current status of knowledge of the learner inferred by the student model should be clearly reported by the visualization. This could help the learner in identifying his/her strengths and weaknesses and to promote metacognition.
• Tutors and instructors need to access this information to see the learners’ progress and the structure of the course as it currently stands.
• Peer student models should be provided. This will help students to find peers who are strong in areas they are weak in and vice versa.
3.2
Relation to other GRAPPLE modules
We identified two kind of relationship with other GRAPPLE components: the dependencies that our WP has (inner) and the functionalities that we should offer to other part of the project (outer).
In terms of the first one, there is the necessity of retrieving data from DM and UM, which provide the data sources for our representations. The data from these modules will be accessed most probably through the GRAPPLE Event Bus system, described in the deliverable D7.1a (Initial specification of the operational infrastructure). The data exchanged will follow common format defined in the deliverable D7.2a (Data models and related documentation).
Regarding the functionalities sides, there isn’t any component (or work package) that directly depends on our work. However, in order to have a whole, integrated GRAPPLE system where all user interfaces are seemly integrated in a coherent and single look-and-feel, it is desirable that all user interfaces follow the same style, approach and, if possible, implementation technology. So there’s a tight relationship between our work and other GRAPPLE authoring components (GRAPPLE Authoring Tool) defined in Deliverable D3.1.
In the rest of this section, we will focus on the two GRAPPLE components on which we most depend: the domain model and the user model. Their description is important to learn which user and domain data is available to our purposes.
3.2.1 Relation to Domain Model
A domain model (DM) is a formal representation of a knowledge domain or subject matter. A domain model defines how knowledge is semantically structured. The need for structuring knowledge results from the fact that this enables computer application to access and process knowledge.
The DM does not represent actual hyper-documents or learning objects, but is rather the underlying representation of the domain to which content object can be related. This means, the DM represents the domain on a conceptual level, and is defined completely independent from actual content objects. Content objects can be related to the domain model through meta-data in the content objects which refer to concepts and concepts can relate to content objects through specific attributes.
In GRAPPLE the domain model is defined through two base elements: concepts and relationships between concepts (similar to concepts maps). A concept is a unit of knowledge, it has attributes that precisely define a concept, and it is related to content resources (learning objects).
The attributes of a concept are: • Name: title of the Concept
• Identifier: it identifies the single concepts
• Description: it describes the scope of the concepts
• Keywords: they are words used in a reference work to link to other concepts
In order to related concepts to content objects, meta-data of concepts are defined. Multiple objects can be related to a single concept, where for each resource objects the following information is given:
• Name: name of single resource
• Location: it indicates the path where the resource is available. If the Domain Map is available to all the community, the resources are stored in a Content Repository
• UsageType: any resource can be used in a different context such as introduction, image, body text, conclusion, ..
• Standard LOM metadata: they are the standard LOM metadata available for any resource
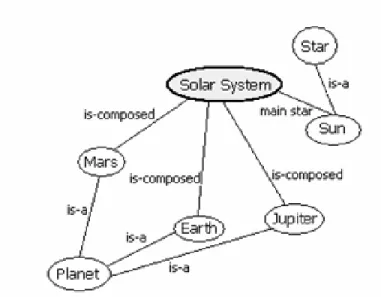
A relationship defines how two concepts are connected on a semantic level. First, relationships can be of a hierarchical nature. For example the "is-a" relationship can structure the concepts in a hierarchical way by defining sub-concepts of concepts. Second, concepts can be organised as graph by connecting concepts with semantic relationships, as it is done in concept maps. In the GRAPPLE DM definition both types of relationships can be used at the same time. Figure 1 gives an example of a DM.
Figure 1: Example of a domain map
A domain map is a concrete instance of a domain model and describes a specific knowledge domain. It is created by a single author and has the following attributes:
• Name: title of the Domain Map
• CreationDate: creation date of the Domain Map • Author of the Domain Map
• Shared/Local: this flag indicates if this Domain Map has been made available to all the authors in the authoring community
• Description: it describes the scope of the Domain Maps
• Keywords: they are words used in a reference work to link to other Domain Maps
• Identifier: it identifies the single Domain Map. The identifier is extremely important when the Domain Map is shared among all the authoring community.
Domain Maps are stored in the Domain Model Repository, which is a storage in the Domain Model Component. This repository is available as Web service and can be accessed in a standardised way as it is common practice for Web services. The retrieved data (the domain maps) are available in a standardized form, the IMS Vocabulary Definition Exchange (VDEX) language. Detailed information about the structure of the DM data can be found in Deliverable D3.2(a-c). The visualisation tools and components only need to retrieve DM data from the DM repository, it does not need to write back or update these data.
In contrast to DMs, Concept Relationship Types (CRT) and Conceptual Adaptation Models (CAM) are used to define adaptation strategies based on pedagogical strategies. However, DMs do not express pedagogical meaning, but only meaning on knowledge domains and their structures.
Regarding information and knowledge visualisation the elements, attributes, and structures as described above can be used for visualisation purposes. The obvious way to visualise this structure would be to draw it as two-dimensional graph as depicted in Figure 1. However, visualisation is not restricted to this form, but there are other possibilities. Concepts and relationships can also be depicted in different ways (as long as it makes sense to the user). Furthermore concept model information can be combined with other data, such as information from the user model.
The information provided in this section and more information on domain models in GRAPPLE can be found in Deliverable D3.1a and in the future in Deliverable D3.1b and Deliverable D3.1c.
3.2.2 Relation to User Model
The purpose of interactive visualization of user models are introspection, self-reflection and metacognition. The visualization task is highly dependent from the format of the user model data. In GRAPPLE, a flexible approach to represent user model data is under development in WP2 and WP6. The core insight that becomes apparent is that there will be a decoupled view to the three concepts of:
1. Datatypes 2. Syntax 3. Semantics
The focus on the visualization task itself is to find appropriate representations of different datatypes. One important datatype family will for example be the ones that show the students knowledge level. These ranges could be “low-medium-high”, “school-marks” as different as they are in the different countries, or the “percentage of success” as number between zero and one hundred.
The difficult task for our WP4 is that these datatypes are not necessarily known in advance, since GRAPPLE claims to become a “generic” learning environment. However, we will start with the visualization of datatypes and dataranges that are known.
The user models are based on the newly introduced notion of GrappleStatements. Examples of such GrappleStatements in pure textual form are:
S1 := Mary likes chemistry
S4 := Mary prefers learning style A to learning style B S6 := Mary does not like mathematics
S7 := Mary is colour-blind S8 := Peter likes mathematics
S9 := Peter is a good Java programmer (claimed by Mary)
S10 := Peter knows the concept of object oriented programming (learned with the AHA!) S12 := Peter knows the Theorem of Pythagoras (learned with Moodle, last year)
S13 := Mary does not like chemistry very much (claimed by Peter, yesterday) Further examples of GrappleStatements with meta information about the mainpart:
In deliverable D6.1a) a user model is defined as “a set of selected GrappleStatements about a user”. In our example, one possible user model for Mary could be:
M1 (Mary) : = { S1, S4, S6, S7 } and one possible user model for Peter could be:
M2 (Peter) := { S8, S9, S10 }
The interesting and challenging issue of this definition of a user model is somehow hidden in the term “selected”. Not all statements about a user need to be part of a user model. That is especially necessary for contradicting statements. A decision has to be made at the time when the user model is constructed. Which “selected” statements belong to a user model is decided in a possibly complex algorithm by the user modeling framework UMF. The decision can be context-aware, user-adaptive, privacy-enhanced, history-aware etc. The visualization tool has to handle this problem in some way or the other. Here, further discussion is needed.
The syntax of GrappleStatements is the following
with the used namespace: gc = "http//www.grapple-project.org/grapple-core/
<gc:statement [type=”domain-overlay”] id=”UID”> <gc:user> UID(i.e user:Peter) </gc:user>
<gc:predicate> UID (i.e. gc:hasKnowledge) </gc:predicate>
<gc:concept> UID (i.e. domain:SentenceOfPythagoras) </gc:concept>
[ <gc:level> 0.70(Number between 0 and 1) </gc:level> ]
[ <gc:creator> UID (denoting the creator of mainpart) </gc:creator>
[ <gc:created> xsd:dateTime (timepoint, denoting the initial creation time </gc:created> [ <gc:access> { private | public | UID-List } </gc:access> ]
[ <gc:temporal> underspecified - temporal constraints <gc:temporal> ] [ <gc:spatial> underspecified - spatial constraints <gc:spatial> ]
[ <gc:evidence> underspecified - description of the evidence </gc:evidence> ]
[ <gc:rating> underspecified"if the statement has been rated by a community" </gc:rating> ] <gc:statement>
A detailed description of the XML/RDF schema can be found in deliverable D2.1. Important for the visualization task is, that apart from the main part of the information like user, predicate, concept, level, there are also slots for meta part information like creator, access and rating. The privacy handling is discussed separately in section 4.3.
The semantics of the denoted concepts could be realized by linking the names of the concepts, like the “SentenceOfPythagoras” directly to the definition within domain model as discussed in the preceding section. A very interesting challenge for the visualization task is the visualization of changing data in general and the change of user model data at a special glance. User model data like the level of knowledge about a certain topic change over time, when certain courses have been taken.
3.2.3 Summary of data sources
The visualization module is highly dependent from data that comes from DM and UM. We don’t have enough details on domain and user models, which both are still in development phase. However, here we can sum up the most important elements that we can take from these components and use as basis for our visualizations. These are:
• Concepts, these are necessary to represent what are the main parts/concepts of the course.
• Relationships, these are necessary to make the student aware of how concepts are organised and how they are connected with semantic relationships
• Grapple statements, these are necessary to see how the student knowledge is evolving over the time and for the privacy issues.
4 Conceptual Approach and Research
4.1
Conceptual approach
The objectives of the work to be done have been outlined in Section 1.1. GRAPPLE's internal models which are needed for performing the adaptation strategy are opened up to the users (learners, peers, and tutors). This strategy also known as Open Learner Model is an active area of research that has shown several benefits for learners and teachers. An overview on related work regarding Open Learner Models is presented in Section 2.
The basic idea is to design and develop visualization components, which reveals information on domain and learner explicitly to users. Data of the respective models are graphically depicted and allow the users to directly inspect this information. However, the users should not only get some information, but they should benefit from these visualizations. For this aim detailed elaboration and research is needed, which is described in the paragraphs and sections below. Though several conclusions can be drawn from related work regarding OLM and information visualization, there is still need for research for several reasons: (1) OLM research is not finished, but an open research discipline with open research questions. (2) There should be room for new ideas integrated and developed in the GRAPPLE project. (3) The GRAPPLE data models are being newly developed and therefore they could be different from existing ones.
In Section 3 the models are presented, which are intended to be opened up to the user. These models are: (1) the Domain Model, which represents domain knowledge on a conceptual level, and (2) User Models, which characterize the learner regarding competences and goals. Domain Model information can be presented to the learner in order to provide the learner with some kind of knowledge map which helps to get an overview on the domain. The user model contains information about the learner (such as competences and goals), which can be shown explicitly. At this point a research question arises which data actually should be shown. Obviously it will not be suitable to present all data of a model or all data of all models at once, since this would lead to a visual data clutter. So the model data have to be filtered in a meaningful way. Furthermore, since user model refers to domain model (for example a learner has learned a specific concept), it has to be taken into account that data of more than one model has to be shown in a combined way.
In addition to filtering data of the models to be shown, the level of detail (or aggregation level) has to be elaborated. Data can be shown as they are, or they can be aggregated to a lower level of detail, which, however, can deliver more meaningful information. Furthermore, a higher aggregation level helps reducing data clutter in the visualization.
Basically, opening up is done by visualizing the respective information, which leads to another research question. Appropriate techniques and methods have to be investigated how to visualize the respective information. In the research discipline of information visualization a lot of techniques are researched how to visualize data depending on their structure. For example, data can be structured as graph or as tree. Visualizations can be based on existing techniques or (if necessary) new techniques can be investigated. Also, visualization should be interactive, to allow the users to filter out unnecessary elements, manipulate the graphical representation (such as zooming or panning), change some visual or data parameters, and so on.
An important requirement is the fact that there are different roles of users: learners may want to get information about their learning process. Peers may want to get information about other learners in order to compare their progress with the progress of groups. Tutors, instructors, and teachers may want to get information about the learners and group of learners.
Another important characteristic of the visualization components is the time dimension when and how long the visualization should be present for a user. Visualizations can be present the whole time so that users always can observe its content, for example they can observe learning progress. On the other hand, visualizations also can be presented to the user in specific situations, due to the occurrence of certain events in the system. A third possibility is that the user controls the presence by directly opening and closing the visualization.
The reason for developing visualization components and opening up data models is to provide users with certain benefits. An analysis which benefits can be achieved is given in the next section (Section 4.2). It is not intended that each visualization component achieves all of the listed benefits, but the components are designed to achieve certain benefits. In other words, the development of visualization components are driven by a previously defined set of required benefits. This lead to another research question: How can a