HAL Id: hal-01893858
https://hal.archives-ouvertes.fr/hal-01893858
Submitted on 7 May 2021
HAL is a multi-disciplinary open access
archive for the deposit and dissemination of
sci-entific research documents, whether they are
pub-lished or not. The documents may come from
teaching and research institutions in France or
abroad, or from public or private research centers.
L’archive ouverte pluridisciplinaire HAL, est
destinée au dépôt et à la diffusion de documents
scientifiques de niveau recherche, publiés ou non,
émanant des établissements d’enseignement et de
recherche français ou étrangers, des laboratoires
publics ou privés.
Distributed under a Creative Commons Attribution| 4.0 International License
elevated partial pressure of CO2 under nitrogen
limitation
A. Sciandra, Jérome Harlay, Dominique Lefèvre, Rodolphe Lemée, Peguy
Rimmelin, Michel Denis, Jean-Pierre Gattuso
To cite this version:
A. Sciandra, Jérome Harlay, Dominique Lefèvre, Rodolphe Lemée, Peguy Rimmelin, et al.. Response
of coccolithophorid Emiliania huxleyi to elevated partial pressure of CO2 under nitrogen limitation.
Marine Ecology Progress Series, Inter Research, 2003, 261 (4), pp.111 - 122. �10.3354/meps261111�.
�hal-01893858�
INTRODUCTION
The depression of marine calcification by elevated pCO2was first demonstrated in tropical coralline algae
(Agegian 1985) and has subsequently been identified in other photosynthetic and calcifying organisms (reviewed by Gattuso et al. 1999a) and communities (Langdon et al. 2000, Leclercq et al. 2000, 2002). Although benthic calcification represents a significant component of the oceanic precipitation of calcium car-bonate, the extent and significance of this response
were unknown until recently, when it was shown that calcification of coccolithophorids, the major group of marine calcifying organisms, is also inhibited at ele-vated pCO2 (Zondervan et al. 2001).
Calcification is a source of CO2to the water column
(Ware et al. 1992, Frankignoulle et al. 1994). It therefore increases the sea–air CO2gradient and counteracts the
uptake of CO2by the ocean. The biogeochemical
signif-icance of elevated pCO2 on the future global carbon
cycle remains uncertain for several reasons. Firstly, the magnitude of the decrease in calcification is highly
vari-© Inter-Research 2003 · www.int-res.com *Email: sciandra@obs-vlfr.fr
Response of coccolithophorid
Emiliania huxleyi
to elevated partial pressure of CO
2
under
nitrogen limitation
Antoine Sciandra
1,*, Jérome Harlay
2, Dominique Lefèvre
3, Rodolphe Lemée
1,
Peguy Rimmelin
3, Michel Denis
3, Jean-Pierre Gattuso
11Laboratoire d’Océanographie, Université Mixte de Recherche (UMR) 7093, Centre National de la Recherche
Scientifique-Université Pierre et Marie Curie (CNRS-UPMC), BP 28, 06234 Villefranche-sur-mer Cedex, France
2Service d’Océanographie Chimique et Géochimie des Eaux, Université Libre de Bruxelles, Campus Plaine, CP 208,
Boulevard du Triomphe, 1050 Brussels, Belgium
3Laboratoire d’Océanographie et de Biogéochimie, Centre d'Océanologie de Marseille, Université Mixte de Recherche
(UMR) 6535, Centre National de la Recherche Scientifique (CNRS)-Université de la Méditerranée, Case 901, 13288 Marseille Cedex 9, France
ABSTRACT: Precipitation of calcium carbonate by phytoplankton in the photic oceanic layer is an important process regulating the carbon cycling and the exchange of CO2at the ocean-atmosphere
interface. Previous experiments have demonstrated that, under nutrient-sufficient conditions, dou-bling the partial pressure of CO2(pCO2) in seawater — a likely scenario for the end of the century —
can significantly decrease both the rate of calcification by coccolithophorids and the ratio of inorganic to organic carbon production. The present work investigates the effects of high pCO2on calcification
by the coccolithophore Emiliania huxleyi (Strain TW1) grown under nitrogen-limiting conditions, a situation that can also prevail in the ocean. Nitrogen limitation was achieved in NO3-limited
contin-uous cultures renewed at the rate of 0.5 d–1 and exposed to a saturating light level. pCO 2 was
increased from 400 to 700 ppm and controlled by bubbling CO2-rich or CO2-free air into the cultures.
The pCO2shift has a rapid effect on cell physiology that occurs within 2 cell divisions subsequent to
the perturbation. Net calcification rate (C ) decreased by 25% and, in contrast to previous studies with N-replete cultures, gross community production (GCP) and dark community respiration (DCR) also decreased. These results suggest that increasing pCO2 has no noticeable effect on the
calcifica-tion/photosynthesis ratio (C /P) when cells of E. huxleyi are NO3-limited.
KEY WORDS: Calcification · Carbon fixation · Coccolith · Emiliania huxleyi · Nitrate · Alkalinity · CO2 Resale or republication not permitted without written consent of the publisher
able and depends upon whether organisms or commu-nities are considered (Gattuso et al. 1999, Zondervan et al. 2001, Leclercq et al. 2002, Reynaud et al. in press). Some of this variability may result from an inadequate control of experimental conditions, particularly of the chemistry of the carbonate system. Second, the interac-tions on global scale between changes in pCO2 and
changes in other environmental parameters, such as temperature, have received very little attention and have the potential to explain some of the variability discussed above (Reynaud et al. in press). Third, most experiments have investigated acute responses but have not provided information on acclimation over short (daily) time scales. Fourth, the effect of this response on air–ocean CO2
fluxes not only depends on its magnitude but also on other factors that are equally difficult to estimate, such as changes in seawater buffering capacity (Frankignoulle et al. 1994), the sedimentation rate of planktonic CaCO3
particles (Buitenhuis et al. 2001), the effect of grazing by zooplankton (Harris 1994), and the response of the net photosynthetic uptake of CO2 (Zondervan et al. 2001,
Leclercq et al. 2002, Reynaud et al. in press). These un-certainties hamper the prediction of the effect of marine calcification on future air–ocean CO2fluxes, and, not
surprisingly, the 2 attempts made so far have reached conflicting conclusions. Gattuso et al. (1999a) suggested that the release of CO2to the atmosphere due to
calcifi-cation may not change significantly in the future, whereas Zondervan et al. (2001) suggested that it could increase significantly (see also Elderfield 2002).
Among all the substrates involved in primary produc-tion, dissolved inorganic carbon (DIC) is by far the most abundant (2 mmol C l–1). For this reason, it was regarded
for a long time as non-limiting for primary production (Lalli & Parsons 1994). By measuring the carbon specific growth rate of various phytoplanktonic species, includ-ing Emiliana huxleyi, at different DIC levels and con-stant pH, Clark & Flynn (2000) found that neither the rate nor the extent of primary productivity are significantly limited by the DIC concentration prevailing in the quasi-steady state conditions associated with oligotrophic ar-eas. However, it is now well recognized that most marine species have developed enzymatic processes allowing them to accumulate intracellular DIC at levels that greatly exceed the external concentration (Raven & Johnston 1991). These carbon-concentrating mecha-nisms (CCM), which involve the active transport of bi-carbonate and CO2through the cellular membrane,
al-low phytoplankton to use bicarbonate and CO2 as
sources of carbon for photosynthesis. Among the phyto-plankton species, the calcifying strains of E. huxleyi have a particular relation with the DIC substrate because the production of calcium carbonate during calcification (C ) is supposed to produce intracellular CO2 that can be
fixed during photosynthesis (P). According to the scheme
suggested by Nimer & Merrett (1995), calcification can produce extra CO2if its rate exceeds that of
photosyn-thesis (Paasche 1964). Theoretically, the magnitude of CO2generation is thus a function of the C /P ratio, which
can vary between 2 (Eq. 1) and 1 (Eq. 2) according to the following reactions (which do not take into account the buffering capacity of seawater):
4HCO3–+ 2Ca2+—>2CaCO3+ ‘CHOH’ + CO2+ O2+ H2O (1)
2HCO3–+ Ca2+—>CaCO3+ ‘CHOH’ + O2 (2)
Eqs. (1) and (2) remain hypothetical, since, as shown in numerous experimental studies, the C/P ratio can vary between 0 and more than 2 (Paasche 2002).
The aim of the present study was to build on the pre-vious work of Riebesell et al. (2000) and Zondervan et al. (2001) by investigating the response of the coccol-ithophore Emiliania huxleyi to changes in pCO2under
nitrogen-limited conditions. In contrast to these previ-ous experiments, we chose to use continuprevi-ous culture systems which, although technically more difficult to implement, allow the maintenance of phytoplankton in the required steady conditions of nutrient limitation. Continuous cultures also allow intensive and frequent sampling during prolonged time periods without sig-nificant variation in the volume, allowing accurate assessment of the acclimation properties of phyto-plankton without adversely affecting the culture envi-ronment. Moreover, the possibility for growth and bio-mass to reach steady states greatly facilitates the control in real-time of pH and pCO2 within narrow
ranges. We ran 2 identical NO3-limited chemostats of
E. huxleyi in parallel. A dual control was available, as the cultures were initially maintained at the same pCO2, with one of them subsequently subjected to the
level of pCO2expected in the year 2100. In contrast to
the classical pH regulation obtained by the addition of strong bases or acids, the seawater carbonate chem-istry was manipulated by injecting various gas mix-tures into the culture vessel. This experimental set-up was designed to provide information on 3 of the uncer-tainties mentioned above, specifically the physiologi-cal response under precise control of the culture condi-tions, the time response of acclimation observed over a prolonged time after perturbation, and the response of primary production. This experiment, carried out under nitrogen limitation, extends the knowledge of the pCO2effect on calcification to physiological
condi-tions that also prevail in the ocean.
MATERIALS AND METHODS
Experimental design.The coccolithophore Emiliania huxleyi (Strain TW1) was provided by the Marine Biol-ogy and BiotechnolBiol-ogy Laboratory of Caen University
(France). It was maintained in batch culture for 2 mo in conical flasks in 50 ml of K/2 medium (Keller et al. 1987). The flasks were placed in a growth chamber at a tem-perature of 17 ± 0.1°C under 14L:10D irradiance. Light was provided by fluorescent lamps giving a photon flux density (400 to 700 nm) of 170 µmol photon m–2s–1.
We grew 2 chemostat cultures of the same strain under identical nutrient, temperature light and pCO2
conditions until they had reached the same steady state; one culture was then subjected to an increase in pCO2(designated LH, i.e. for low to high pCO2), while
the other remained in unchanged conditions (desig-nated LL, i.e. constant low pCO2). This experimental
set-up enabled comparison of the LH culture before and after the CO2shift as well as comparison with the
control (LL) culture at the same date and time.
The 2 culture vessels consisted of water-jacketed 10 l cylinders (filled to 9.5 l) connected to a circulating water bath maintained at constant temperature (17 ± 0.5°C). The growth medium was prepared using 0.22 µm Millipore-filtered and autoclaved (105°C for 30 min) natural seawater and nutrient enrichments according to the K/2 formulation without ammonium. The medium was prepared in batches of 100 l (5 Nal-gen tanks of 20 l connected together). After cooling and sterile addition of nutrients, the medium was transferred to the culture vessels through a 0.22 µm sterile filter (SpiralCap, Gelman). The nitrate concen-tration (NO3), the limiting nutrient in fresh media,
var-ied from 14.0 to 15.5 µM among batches. Phosphate concentration was 5 µM. The chemostat cultures were operated at a constant dilution rate (0.5 d–1) that was
periodically checked by weighing the incoming medium. The culture volume was large enough to min-imize perturbation caused by intensive sampling. Chemostats were not refilled with fresh medium immediately after sampling, and the dilution rate was temporally increased by 6% 4 times per day, resulting in a daily averaged dilution rate increase of only 1.7%. Both cultures were subject to continuous gentle stir-ring and bubbling to insure homogeneity.
The cultures were grown under continuous light. Light was provided by an array of six 50 cm U-shaped, dimmable fluorescent tubes (OSRAM, DULUX®L,
2G11, 55W/12-950, LUMILUX DE LUXE, daylight) on each side of the set of 2 culture containers. The spectral characteristics of these tubes are given in Bruyant et al. (2001). The photosynthetic photon flux density was measured by immersing the spherical collector (QSL-100, Biospherical Instruments) in the center of the cul-ture vessel. Irradiance was 570 and 580 µmol photons m–2s–1, in the LH and LL cultures, respectively.
Care was taken to avoid bacterial contamination of the cultures. However, axenicity could not be main-tained, essentially because the pH electrodes had to be
removed from the chemostats each day for calibration. Nevertheless, the abundance of free and attached bac-teria, counted daily by DAPI direct counts, remained similar to the cell abundance of Emiliana huxleyi (< 7× 10⁸cell l–1), suggesting that bacterial carbon and
activity were negligible compared to those of E. hux-leyi. Indeed, no significant respiration was measured in culture filtrate (2 µm Nuclepore filter).
Nutrient and particle measurements. High-frequency monitoring of the chemostat cultures was performed throughout the experiment to obtain quasi real-time information on cell concentration and cell size distribution (hourly), and concentrations of nitrate (NO3) and nitrite (NO2) (twice a day). This information
was essential to ensure that both cultures reached sim-ilar steady states before the pCO2shift since, at steady
state, the growth rate was equal to the dilution rate. The concentrations of nitrate and nitrite were measured with a Technicon Auto-analyzer and an automated data-acquisition system (Malara & Sciandra 1991).
Cell concentration and size distribution were mea-sured with an optical particle counter using the princi-ple of light blockage (Hiac/Royco, Pacific Scientific Instruments). The instrument was calibrated with latex microspheres of 12 different sizes ranging from 1.7 to 250 µm. Comparative measurements of size and num-bers made with the Coulter counter agreed reasonably with the Hiac counter for most of the phytoplankton species tested in our laboratory. Flow cytometer counts at different times during the experiments (n = 53) did not differ by more than 8% from simultaneous counts with the Hiac counter. This small difference could have been due to the presence of a small proportion of large free coccoliths which because of their scattering prop-erties may have been counted as coccolithophorids. Another source of variation is the presence of dead cells. Since the Hiac counter counts all particles which have a refractive index significantly different from that of seawater, it cannot differentiate between dead and live particles. Because of to their external coccosphere, dead empty coccolithophorids can retain their original shape longer than other phytoplanktonic cells, and thus their contribution to the entire population can bias cell counts. Nevertheless, these sources of error should not be significant, since the Hiac counts were gener-ally slightly lower than the flow cytometer counts.
Prior to counting and sizing of Emiliana huxleyi, the cultures were diluted with an automated, computer-controlled system consisting of peristaltic pumps, sole-noid valves, and a syringe (Bernard et al. 1996). The co-efficient of variation for these replicates was less than 3%, and the data were subsequently averaged. The mean cell volume (V ) was calculated for the 1.6 to 7.0 µm size classes, the lower detection limit of the Hiac sensor and the upper size of E. huxleyi, respectively.
Alkalinity and pCO2control.Triplicate 20 ml samples were collected every day at 8:00 h in both chemostats as well as in the culture medium for determination of total alkalinity (TA). They were immediately filtered onto glass-fiber filters (Whatman GF/C) and analyzed. TA was determined potentiometrically using the Gran method with a glass combination electrode (Orion 8102SC) calibrated on the National Bureau of Standards (US). pH scale and 0.10 N hydrochloric acid (Merck 109060). The precision of the measurements was as-sessed against a standard provided by A. G. Dickson (University of California, San Diego). The average of 8 replicate titrations was 2.9 µmol kg–1higher than the
nominal TA of the standard (2189.56 ± 0.004 vs 2186.62 ± 0.36 mol kg–1; mean ± 95% confidence limits).
The pCO2in the chemostats was controlled using a
pH-stat approach: pH was regulated by adjusting the delivery of 3 gases (air, pure CO2 and CO2-free air
obtained by passing air through a scrubber filled with soda lime) into the cultures using solenoid valves. Because TA varied in the cultures, depending on the magnitude of the rates of calcification, the desired pH was determined daily. It was calculated using TA and the desired pCO2 as described by Zeebe &
Wolf-Gladrow (2001). The pH was measured at 1 s intervals using glass combination electrodes (Orion 8102SC) calibrated daily using the Seawater scale buffers Tris and 2-aminopyridine (Dickson 1993). It varied from 7.82 in the LH culture after the pCO2increase to 8.02 in
both cultures before time zero (t0) (Table 1).
Tempera-ture was also measured at 1 s intervals with Pt100 platinum resistance sensors.
When the measured pH was lower or higher than that desired, CO2-free air or a mixture of air and pure
CO2was bubbled into the chemostats to raise or lower
the pH, respectively. All calculations related to the sea-water carbonate system were made according to Dick-son & Goyet (1994). The accuracy of the pCO2 control
was ±12 to ± 41 µat (1 SD; Table 1). pCO2increased by
72% in the LH culture, with no overlap of the standard deviations. A CO2control was run for both chemostats
during most of Phase 1 of the experiment. An electrical interference scrambled the pH signals in both cultures during the early part of Phase 2 and could not be sup-pressed at the time. The pCO2control system of the LH
culture was therefore left in operation while ambient air was bubbled through the LL culture, whose control system was switched off. The pH in the LL culture was then measured several times a day by shifting the pH electrode from the LH to the LL culture. This technical problem did not affect the experiment, as pCO2values
in the LL culture before and after t0 were similar
(Fig. 1), with overlapping SD.
Particulate organic and inorganic carbon and nitro-gen. The concentrations of particulate carbon (PC), and nitrogen (PN), were determined every day or twice a day on triplicate samples. We filtered 50 ml onto precombusted glass-fiber filters (Whatman GF/F); these were then dried at 60°C and analyzed with a LECO 900 CHN analyzer. Particulate organic carbon (POC) was measured with the CHN analyzer using acidified samples (1 h above HCl fumes). The repli-cates typically agreed to within 5%. Particulate inor-ganic carbon (PIC) contained in free and attached coc-coliths was calculated by the difference between PC and POC.
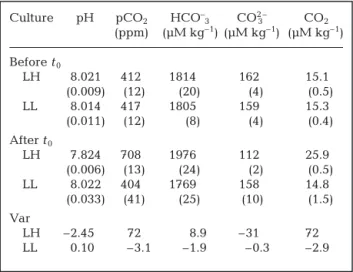
Culture pH pCO2 HCO–3 CO23– CO2
(ppm) (µM kg–1) (µM kg–1) (µM kg–1) Before t0 LH 8.021 412 1814 162 15.1 (0.009) (12) (20) (4) (0.5) LL 8.014 417 1805 159 15.3 (0.011) (12) (8) (4) (0.4) After t0 LH 7.824 708 1976 112 25.9 (0.006) (13) (24) (2) (0.5) LL 8.022 404 1769 158 14.8 (0.033) (41) (25) (10) (1.5) Var LH –2.45 72 –8.9 –31 72 LL –0.10 –3.1 –1.9 –0.3 –2.9
Table 1. Emiliania huxleyi. Mean (SD) values of the dissolved
inorganic carbon system components for the 2 cultures LH (low to high pCO2) and LL (continuously low pCO2), before
and after shift in partial pressure of CO2 (pCO2) in the LH
culture at t0(time zero). Var: percentage variation between
and after t0
Fig. 1. Control of partial pressure of CO2(pCO2) in LH and LL
(low to high pCO2) and LL (continuously low pCO2)
chemostats. At time zero (t0) pCO2was increased in LH
cul-ture and maintained constant around 707 ppm, but was left unchanged in LL culture
Calcification and carbon fixation. Net calcification was measured by 2 independent techniques: budget-ing the change in TA and the change of PIC in the chemostats. The evolution of TA in continuous cultures results from physical exchanges and biological pro-cesses. Addition of the enriched medium to the chemo-stat and its subsequent removal are termed positive and negative exchange, respectively. Precipitation and dissolution of CaCO3 are termed sink and source,
respectively, with a ∆CaCO3:∆TA ratio of –1 mol:
2 equiv. An uptake of 1 mol nitrate and 1 mol phos-phate increases TA by 2 mol. The change in TA due to nutrient uptake was negligible compared to that for calcification and CaCO3 dissolution (Brewer &
Gold-man 1976). The significant fluxes in TA can thus be combined by the following equation to derive the instantaneous resulting alkalinity change:
(3) where D (d–1) and TA
i(µequiv. l–1) are the dilution rate
(ratio of flow rate to volume of the culture) and the TA of the culture medium, respectively. (TAivaried from 2537 to 2607 µequiv. l–1); TA and n (cell l–1) are TA in
the chemostat and the algal concentration, respec-tively; and C is the net cell calcification rate (pg C cell–1
d–1). Rearranging Eq. (3), the mean cell calcification
rate can be calculated as:
(4) Eq. (4) can be approximated by its discretized expres-sion calculated for a significant time interval, ∆t:
(5) where TA(0) and n(0) are the values of TA and n at the beginning of the time interval ∆t, respectively; ∆TA and C are the difference in TA and the average rate of– net cellular calcification calculated during this time interval, respectively; TA was measured daily (∆t = 1 d) in the renewal medium and in the 2 cultures. C can be– considered as a good approximation of C if the system is linear during ∆t, i.e. if
and if n(t) ≈ n(0)
and if the dilution rate D and the TA in the enrichment medium, (TAi), remain stable during ∆t.
The PIC concentration in the chemostats increased and decreased respectively in response to net calcifi-cation and dilution:
(6)
At steady state, the values of PIC and n are thus suf-ficient to determine the cellular calcification rate C:
(7) PIC is the carbon concentration of attached and detached coccoliths. To obtain an unbiased estimation of C from Eq. (7), it is necessary that free coccoliths are efficiently retained, which was the case with the GF/F filters.
Similarly, the net cellular synthesis of POC in the chemostats, P (pg C cell–1 d–1), can be calculated at
steady state as:
(8)
Gross (GCP) and net community production (NCP) and dark community respiration (DCR).Cultures were siphoned from chemostat vessels into 12 borosilicate glass bottles through silicon tubing, overflowing each sample bottle by twice its volume. Four 25 ml dissolved oxygen sample bottles were fixed immediately with Winkler reagents for measurement of O2concentrations
at t0; 4 dissolved oxygen sample bottles were incubated
in the light, and a further 4 bottles were incubated in the dark. Samples were fixed after either 4 or 11 h of incu-bation and stored under water pending analysis (within 24 h). Dissolved oxygen concentration was measured with an automated whole-bottle Winkler titration system using a photometric endpoint (Williams & Jenkinson 1982). NCP was calculated as the 24 h change in dis-solved oxygen in the light bottle; DCR was calculated as the 24 h change of dissolved oxygen in the dark bottles; GCP was calculated as the sum of NCP and DCR. All rates are reported in pmol O2cell–1d–1.
RESULTS
Chemostat culture of Emiliana huxleyi
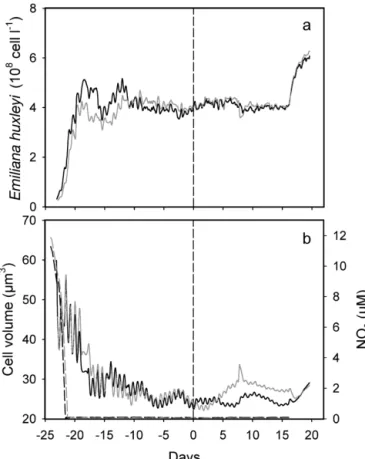
During the initial phase of the experiment, cells grew exponentially at a mean rate of 1.07 and 1.10 d–1in the LH and LL cultures (Fig. 2a), respectively. The contin-uous mode began in the chemostats with a dilution rate of 0.5 d–1when NO
3became exhausted. Cell density
reached identical steady states (around 4 × 10⁸cell l–1)
in the 2 cultures 10 d before the shift of pCO2in the LH
chemostat. At the end of the experiment (Day 16), the supply of fresh medium was interrupted and the cul-tures were grown in batch mode. This induced an immediate and similar increase in the cell density in both chemostats.
The increase of pCO2 in the LH culture had no
noticeable effect on the cell concentration compared to
P D n = POC C D n = PIC dPIC dt = Cn−DPIC ∆ ∆ TA dTA d t ≈ t C n D i t ( ) ( ( )) – = 1 − 0 TA TA0 TA ∆ ∆ C n D i t = 1 (TA −TA) –dTA d dTA dt = D(TAi−TA)−Cn
that of the control LL culture. During the steady state observed before and after the pCO2 shift, the mean
generation time was 1.39 d in both chemostats (i.e.
ln(2)/0.5). Cell density and mean cell volume (Fig. 2b) exhibited significant short-term oscillations through-out the experiment, suggesting that the algal popula-tion remained partly synchronized despite the continu-ous-light conditions of the 2 chemostats.
Superimposed on these short-term oscillations was a decreasing trend in the cell volume observed after NO3
exhaustion in the 2 cultures (Fig. 2b). This agrees with the findings of Riegman et al. (2000), who reported a strong decrease in cell volume under nitrate limitation. The populations displayed identical evolutions of cell volume prior to the pCO2 shift, but the trends
subse-quently diverged, with significantly lower cell volumes in the LH culture. This difference disappeared as soon as regulation of pCO2 and dilution were voluntarily
stopped at Day 16.
Net primary production and respiration
Total particulate nitrogen in the 2 chemostats was stable throughout the experiment, but exceedeed the nitrate concentration in the renewal medium by 10%. This difference could be due to constant errors in the dosage of particulate organic nitrogen (PON) and DIN or to other sources of nitrogen present in small quanti-ties in the natural seawater used for medium prepara-tion. Some clones of Emiliana huxleyi have been shown to be able to use other nitrogen compounds such as amino acids (Ietswaart et al. 1994) and urea (Palenik & Henson 1997). However, given the small difference between PON and DIN and given the high C/N ratio measured (Table 2), one can reasonably con-sider that cells were effectively nitrogen-limited. Fig. 2. Emiliania huxleyi. Time change in (a) cell
concentra-tion, and (b) mean cell volume (continuous lines) and NO3
con-centration (dashed lines) in LL (grey lines) and LH (black lines) chemostats before and after pCO2shift in LH culture at Day 0
Culture pCO2(ppm) n (108l–1) V (µm3) CPOC(pg cell–1) CPIC(pg cell–1) CPON(pg cell–1) C/N (at.) C/P
Before t0 LH 412 3.89 24.64 5.09 4.45 0.57 10.50 0.87 (13) (0.09) (1.21) (0.15) (0.27) (0.04) (0.61) (0.05) LL 417 4.05 25.58 5.27 4.60 0.59 10.48 0.87 (12) (0.08) (1.20) (0.10) (0.15) (0.07) (1.06) (0.04) After t0 LH 708 4.03 24.92 4.37 3.92 0.55 9.25 0.90 (13) (0.18) (0.92) (0.23) (0.36) (0.01) (0.55) (0.11) LL 404 4.10 28.13 5.34 4.71 0.54 11.52 0.89 (41) (0.14) (0.94) (0.32) (0.24) (0.03) (0.86) (0.09) Var LH –0.72 0.04 0.01 –0.14 –0.12 –0.03 –0.12 0.03 LL –0.03 0.01 0.10 –0.01 –0.02 –0.08 –0.10 0.01
Table 2. Emiliania huxleyi. Mean (SD) pCO2, cell concentration (n), mean cell volume (V ), organic (CPOC) and inorganic (CPIC) cell
carbon, cell nitrogen (CPON), particulate organic carbon to particulate nitrogen ratio (C/N), and calcification to photosynthesis
ra-tio (C/P) before and after pCO2shift in LH and LL cultures. Mean values before and after time 0 (t0) were calculated from all
mea-surements before t0, and from last 8 measurements after t0, respectively, all of which were representative of a steady state (see
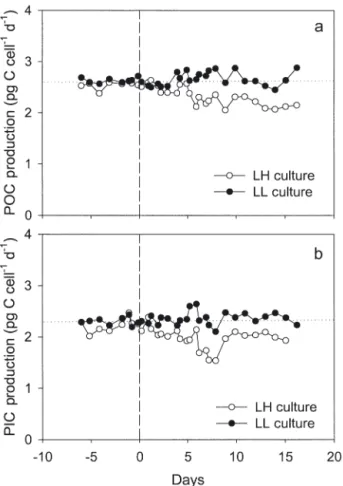
The mean cell content of organic carbon measured in this experiment (Table 2) agrees with other data for Emiliana huxleyi (Paasche 1998, 1999). Production of organic carbon P remained stable in the control LL cul-ture throughout the experiment, and was very close to the values in the LH culture before the pCO2increase
(Fig. 3a & Table 3). In contrast, a significant decrease in particulate carbon production occurred consecutively with the pCO2increase in the LH culture. Since the cell
abundances were very similar and constant in both the LH and LL cultures, the changes in organic and inor-ganic carbon production expressed as unit of culture volume (data not shown) exhibited a pattern similar to those expressed as cell unit.
GCP remained at around 0.26 ± 0.02 pmol O2cell–1
d–1 in both chemostats (Table 3). A decrease of 8.4%
was observed after the pCO2shift in the LH chemostat.
A decrease of 24% was observed for DCR, with a mean specific rate of 0.08 ± 0.02 pmol O2cell–1d–1.
Conse-quently, NCP increased by 16.4%, with a mean specific rate of 0.18 ± 0.02 pmol O2cell–1d–1. The NCP fluxes
af-ter the pCO2shift in the 2 chemostats were significantly
different, essentially due to the decrease in DCR fluxes in the LH chemostat. The average ratio of GCP/DCR, an index of the net efficiency of the cells to fix carbon into the organic pool, was 3.1 ± 0.7, which is higher than previously reported for batch cultures (1.6: Grande et al. 1989, and 2.6: Eppley & Sloan 1965). This ratio in-dicates that nearly 68% of the inorganic carbon fixed by the cell through photosynthesis was converted into organic biomass, the remaining 32% being released into the inorganic carbon pool. The apparent PQ value, which is the molar ratio of NCP(O2) to NCP(C)
deter-mined by the POC variation, is 0.83 ± 0.11. This appar-ent PQ value is low compared to the value of 1.2 to 1.4 reported under NO3supply (Eppley & Sloan 1965, Laws
1991). A limitation of the production rate GCP(O2) by
30% due to nitrogen limitation during the batch-incu-bation could explain the low apparent PQ.
TA and calcification rate
TA was very stable in the enrichment medium, except in the last batch used from Day 5 onwards
Fig. 3. Emiliania huxleyi. Net cellular production of (a)
orga-nic and (b) inorgaorga-nic carbon in LH and LL cultures, before and after pCO2shift in LH culture at Day 0
Parameter Before t0 After t0 t-test
C (Eq. 5) LH 2.31 (0.25) 1.76 (0.12) p < 0.0002 LL 2.35 (0.19) 2.38 (0.08) p > 0.17 t-test p > 0.7 p < 0.0001 C (Eq. 7) LH 2.22 (0.13) 2.02 (0.06) p < 0.002 LL 2.30 (0.08) 2.38 (0.08) p > 0.03 t-test p > 0.08 p < 0.0001 P (Eq. 8) LH 2.55 (0.07) 2.17 (0.10) p < 0.0001 LL 2.63 (0.05) 2.65 (0.15) p > 0.4 t-test p > 0.03 p < 0.0001 GCP LH 0.28 (0.00) 0.25 (0.02) p > 0.2 LL 0.26 (0.02) 0.26 (0.02) p > 0.7 t-test p > 0.2 p > 0.2 NCP LH 0.16 (0.05) 0.18 (0.02) p > 0.3 LL 0.17 (0.05) 0.19 (0.01) p > 0.5 t-test p > 0.8 p < 0.02 DCR LH 0.10 (0.04) 0.08 (0.01) p > 0.05 LL 0.09 (0.03) 0.07 (0.01) p > 0.1 t-test p > 0.7 p > 0.3
Table 3. Emiliania huxleyi. Mean (SD) calcification (C ),
pro-duction of particulate organic carbon (P), (pg C cell–1 d–1)
gross community production (GCP), net community produc-tion (NCP) and dark community producproduc-tion (DCR) rates (pmol O2 cell–1d–1) before and after t0in the LH and LL cultures.
Student‘s t-tests indicate probability that values before and
(Fig. 4a). The slightly lower TA measured in this batch can be explained by the change of seawater supply used for its preparation (the stock of seawater used to prepare the previous batches had been exhausted). The marked difference in TA levels between the enrichment medium and the 2 cultures indicates net calcification. Prior to t0, a very small difference in TA
could be observed between the 2 cultures. This had completely disappeared by the time of the pCO2shift,
suggesting that growth conditions were very similar for the 2 populations of Emiliana huxleyi until that time. Following the pCO2change, the TA in Chemostat
LH increased significantly compared to the control culture LL.
We used the chemostat property that any dosed quantities can be converted into fluxes to estimate the calcification rate, by budgeting alkalinity in the renewal medium and in the cultures day by day (Eq. 5). Interestingly, this simple procedure allows the estima-tion of cellular calcificaestima-tion without manipulating cells, excepted for counting. Some noise around the average
tendencies (Fig. 4b) could have been due to the rela-tively low levels of cell calcification (1.5 to 3.2 pg C cell–1 d–1), to the variations in effective dilution rate
resulting from intensive sampling, and/or to the replacement of batches of medium. Nevertheless, it is obvious that the effects of doubling pCO2 on calcite
precipitation took place 2 d (i.e. 1 or 2 generation times) after the pCO2 shift, and stabilized 7 to 8 d
thereafter.
The decrease of calcification (C ) in the LH culture was significant not only compared to the rate mea-sured before the shift in the same chemostat, but also compared to the rate measured in the control culture LL (Table 3). In contrast, there was no significant dif-ference in C before and after t0in the control culture
LL. Assuming that the last 8 data points for LH and LL in Fig. 4b are representative of a steady-state activity, the increase in pCO2 induced a 25% decrease in the
rate of net calcification. The average rates of net calci-fication calculated from PIC measurements (see Eq. 7) agree qualitatively with the rates estimated from TA budget (Eq. 5), but the decrease in C estimated by the PIC measurement method (Eq. 7) was only 11% in the perturbed LH culture.
DISCUSSION
Since the pioneer work of Paasche (1964), the effects of DIC composition on calcification and growth have been studied in exponential or stationary batch cul-tures. Our experiment is the first to investigate the effect of an increase of pCO2on the calcification of
N-limited cells of Emiliana huxleyi in continuous cul-tures. Our approach also differs from the previous studies in that the pCO2was not regulated by adding
base or acid to the cultures, but by bubbling CO2
-enriched or free air into the culture to regulate the pH at values calculated from measured alkalinity. Finally, measurements acquired in a long-term chemostat experiment reinforced the significance of the differ-ences observed between high and low pCO2
condi-tions.
One of the most surprising observations was the presence of persistent cell-size oscillations in cultures maintained in steady conditions of light, temperature and nutrient supply. Such a phenomenon has occasion-ally been observed using our culturing system in con-tinuous cultures of Thalassiosira pseudonana and Dunaliella tertiolecta grown under similar conditions. It is remarkable that these oscillations (visible by means of the automated system of particle acquisition) continued throughout the entire experiment, except when dilution was interrupted on Day 16. Although slightly less obvious, oscillations in cell number were Fig. 4. Emiliania huxleyi. Time variation in (a) total alkalinity
(TA) in renewal medium (Reservoir) and in LH and LL chemostats, and (b) calcification rate measured from Eq. (5). Solid vertical lines indicate the times when medium batches
also observed. When examined in detail, oscillations of size and concentration were out of phase, suggesting that they resulted from synchronization of cell division. Fourier analysis revealed that the predominant periods were similar in the 2 cultures: 14.6 and 15.1 h for the LH and LL cultures, respectively, and were very close to the light period of the 14L:10D cycle used for the batch cultures that served as inoculum for the chemostats. It is also interesting that the characteristic period of 15 h was almost half the generation time (33 h) of Emiliana huxleyi in this experiment. Synchro-nization of cell population under constant growth-nutrient limitation continuous cultures has been sug-gested by theoretical investigations (Pascual & Caswell 1997), and was explained by the fact that nutrient assimilation and division are consecutive processes in the cell cycle, the latter process taking place after the completion of the former (Vaulot et al. 1987).
The effects of nitrate on growth and calcification of Emiliana huxleyi have been investigated in several studies. Nimer & Merrett (1993) reported that very high levels of NO3(>100 µM) can inhibit calcification
and photosynthetic carbon fixation in highly calcifying strains. Merrett et al. (1993) demonstrated an absolute requirement of NO3for calcification, which may simply
reflect the coupling between growth and calcification and the necessity of nitrogen for growth. A similar enhancement was recorded by Balch et al. (1992) in natural blooms as well as in laboratory batch cultures enriched by moderate NO3concentrations. Using NO3
-limited continuous cultures, Paasche (1998) showed that nitrogen limitation decreases the cellular organic carbon, the calcium content, and the size of coccoliths, but that it increases the number of coccoliths per cell, with a higher Ca/POC ratio at lower growth rates. In batch culture experiments, Berry et al. (2002) indicated that calcification is stimulated by decreased N concen-tration, and that, under low nutrients, increasing DIC can increase the rate of calcification, this effect being more pronounced at high pH (low pCO2). Under low
nutrient conditions, the absolute rate of photosynthesis was, as expected, significantly reduced. However, the increased C /P ratio in low N cultures reflected increased absolute rates of calcification, and not simply inhibition of photosynthesis. Our results show that the transition from unlimited batch to limited continuous-culturing mode was paralleled by an important decrease in the mean cell volume in both cultures (Fig. 2b), probably concomitant with a decrease in the car-bon content (unfortunately not measured during the batch mode of this experiment).
The ratio of the PIC to POC production (or C /P ratio) has been shown to vary between 0 to 1.7 for non-calci-fying and highly calcinon-calci-fying strains, respectively, with a modal value around 1 (see review by Paasche 2002).
The nature of these variations is not always easy to ex-plain, since they involve multiple causes (strain origin, nutrient limitation, growth conditions, experimental ar-tifacts) which may act separately or in combination. One of these causes is also the variation in DIC system-speciation which has been intensively studied by Buitenhuis et al. (1999). Riebesell et al. (2000) have shown that the C /P ratio in N-sufficient cultures of Emiliana huxleyi is decreased by 20% when pCO2is
in-creased from 100 to 750 ppm by acid addition. Their Fig. 1 indicates that the reduction in the C /P ratio was due both to a stimulation of POC production and an in-hibition of PIC production, although the former did not seem significant for pCO2 ranging between 400 and
700 ppm. Their data (obtained in a subarctic North Pa-cific zone dominated by coccolithophorids) showed a similar effect of pCO2on the C /P ratio of natural
com-munities but, in contrast with their laboratory experi-ment, they noted a marked (although non-significant) decrease in organic carbon production with increasing levels of pCO2. In similar laboratory experiments
con-ducted at various light intensities and non-limiting nu-trient levels, Zondervan et al. (2002) observed similar responses of E. huxleyi to an augmentation of pCO2,
with systematic opposite variation in PIC and POC pro-duction, except at the lower irradiance used.
In agreement with the studies cited above, our data show that net cell calcification can be significantly and rapidly reduced following an increase of the pCO2in
the medium. However, in contrast with the previous reports, in our study this effect was not accompanied by a significant decrease in the PIC/POC ratio, since POC production decreased roughly in proportion to PIC production. Considering that all experimental con-ditions were similar, the main difference between our study and the previous experiments lies in the fact that growth was nitrogen-limited in our study.
The question arises as to why an increase in pCO2
results in a decrease in the net photosynthetically fixed carbon only when cells are nitrogen-limited. Inorganic carbon uptake, carbon fixation and respiration may be involved. Regarding respiration, several authors have reported that this can be affected in Emiliana huxleyi under pH conditions that differ from the ‘standard’ value of 8.0 (Paasche 1964). In the present experiment, the respiration rates were not significantly different between the control LL culture (pH = 8.02) and the pCO2-increased HL culture (pH = 7.82), and was not significantly lower in the LH culture after CO2
-enrichment.
Sources of DIC for growth by calcifying strains of Emiliana huxleyi are CO2 and HCO3–. Despite the
probable existence of a functional carbon-concentrat-ing mechanism (CCM) (Nimer & Merrett 1996, Rost et al. 2003), the apparent affinity of E. huxleyi for DIC
remains low, so that photosynthesis in this species is considered by many authors to be non-carbon-satu-rated under conditions of pCO2commonly found in the ocean. Despite the lack of evidence for a protein asso-ciated with an active transport of CO2 and HCO3–
across the plasmalemma, external and internal carbo-nate anhydrase (CA) activities, generally associated with the CCM, have been detected in various strains of E. huxleyi (Nimer et al. 1994b, Elzenga et al. 2000, Rost et al. 2003). These activities are generally weak com-pared with activities in other species. The respective contributions of CO2and HCO3–to photosynthesis are
controversial, depending on the uncertain importance of calcification as a source of H+and CO2for
photosyn-thesis. Based on the assumption that the CO2 and
HCO3– uptake systems are regulated independently
from each other, and that changes in pH have no sig-nificant effect on uptake kinetics, Rost et al. (2003) recently estimated that, at pCO2higher than 360 ppm, CO2remains the major substrate for carbon uptake in
E. huxleyi. These findings are in contrast to those of Buitenhuis et al. (1999), who showed that CO2supports
a modest rate of photosynthesis, whereas HCO3–is the
major substrate for photosynthesis via the intracellular production of CO2by calcification (HCO3–+ H+—>CO2
+ H2O —> CH2O + O2). In this scheme, HCO3–
con-tributes significantly to the regeneration of CO2in the
vicinity of RUBISCO, by providing H+via calcification
in the coccolith-forming vesicle that (associated in the chloroplast with another HCO3– by a CA enzyme)
yields CO2. Both the CCM and calcification are CO2
down-regulated. Rost et al. (2003) showed that the DIC half-saturation constant for photosynthetic O2
evolu-tion may be decreased to some extent by increasing pCO2during growth. Similarly, the observed decrease
in calcification after an increase in CO2has been
inter-preted as a greater ability of the cells to directly use external diffusing CO2 for photosynthesis. Whatever
the processes involved in DIC incorporation, they are not independent of nitrogen status. For instance, the activities of DIC transporters or other proteins involved in the CCM may decrease if nitrogen is limiting their synthesis (Beardall & Giordano 2002). Similarly, calcifi-cation implicates active transport of H+, HCO
3– and
Ca2+ through cell and coccolith vesicle membranes;
this entails energy and enzymatic mobilization, while nitrogen is also required for the synthesis of the coc-colith matrix material including glucoproteins (Ram-bourg 1967, Klaveness 1976). On the other hand, the improvement of the efficiency of N utilization by CCMs is a well-established concept for several micro-algae (Beardall et al. 1998), provided that the nitrogen allocated to the CCM components does not offset the nitrogen saved through the CCM (Raven et al. 1985). Increasing pCO2 from 412 to 708 ppm in our
experi-ment changed the DIC speciation: CO2 and HCO3–
increased by 72 and 9% in the culture, respectively, whereas CO32 – decreased by 31%. The fact that the
redistribution of the potential carbon substrates for growth (CO2 and HCO3–) in the seawater could be
responsible for a globally less efficient carbon uptake under conditions of nitrogen limitation is, in the frame-work of this study, a speculative question that requires further experiments on the energy costs involved in calcification and CCM (Anning et al. 1996). In this con-text, it can be hypothesized that if nitrogen limitation has a relatively greater depressive effect on CCM than on calcification, then carbon fixation would become more dependent on the CCM and should decrease in response to the decline in calcification driven by ele-vated pCO2.
Besides carbon uptake and respiration, another pos-sible cause for the observed decrease in net produc-tion is the lowering of internal pH, indirectly related to the fixation of carbon itself. Many species of marine phytoplankton restrict intracellular pH between 7 and 7.4 by ion-transport mechanisms and a high buffering capacity of the cytosol and, under N-replete condi-tions, these species show enhanced growth at ele-vated CO2 concentrations (Beardall & Raven 1981).
Fixation of carbon is ultimately under the control of RUBISCO activity, with a cell carboxylating capacity depending on the amount of this enzyme in the chloroplasts. Rubisco can contain up to 1/10th of the total nitrogen in a cell, and since it is a major reservoir of nitrogen in cells, it is not surprising that nitrogen limitation leads to a significant reduction in Rubisco and the reallocation of nitrogen resources. One of the direct consequences of a restricted carboxylase activ-ity should be the accumulation of CO2 not fixed by
Rubisco. Should nitrogen-limited cells be unable to utilize the extra CO2produced at high ambient pCO2,
passive diffusion of CO2 across the plasmalemma
could result in acidification of the cytosol. This acidifi-cation should be larger in the HL than in the LL cul-ture, given the higher concentration of CO2reached
in the former after the pCO2shift. Nimer et al. (1994a)
noticed that, at a constant external pH of 8.3, the internal pH of a highly calcifying strain of Emiliana huxleyi decreased from 6.77 to 6.38 when the volume ratio of CO2/air bubbled was increased from 0.03 to
0.1%. Parallel to this effect, Nimer et al. (1994a) pro-vided evidence for the negative effect of high pCO2
on the growth rate and yield of E. huxleyi, which they partially attributed to the decrease in internal pH. This inhibition of growth rate by a high pCO2
treat-ment could be related to the inability of E. huxleyi to generate sufficient OH–to neutralize the H+produced
by calcification (Nimer & Merrett 1993) and thus counteract the acidification of the cytosol.
Emiliana huxleyi has a very high affinity for phos-phates (Egge & Heimdal 1994, Riegman et al. 2000) and a relatively low requirement for Fe (Brand et al. 1983, Muggli & Harrison 1996). It follows that nitrate, in addition to the DIC substrate, may control organic production. Our results show that, under conditions of nitrogen limitation in continuous cultures, the effect of pCO2 increase on the C /P ratio differs from that
observed in nutrient-replete cultures. This experiment was performed at only a moderate growth limitation of 0.5 d–1. Further experiments, performed in a
light –dark cycle, should be conducted to appreciate the differential effects of nitrogen limitation on the relationship between pCO2and the C /P ratio.
Acknowledgements. This experiment was supported by a
grant of the PROOF program (PROcessus biogéochimiques dans l’Océan et Flux) to the DOREMI project. J. H. was sup-ported by the Belgian Federal Office for Scientific, Technical and Cultural Affairs (Contract no. EV/11/5A), for which we are grateful. Thanks are due to B. Delille and M. Frank-ignoulle for their invaluable assistance with preparation of the pH buffers and the loan of a pH-meter, to E. Le Floc’h for her help with preparation of the experimental device and for maintaining the strain of Emiliana huxleyi, and to A.
Maixan-deau for her help with the respiration measurements. E. Rochelle-Newall, B. Dellile and P. Chang provided helpful comments on a draft version of this paper. We are also grate-ful to 2 anonymous reviewers for their helpgrate-ful comments on the manuscript.
LITERATURE CITED
Agegian CR (1985) The biogeochemical ecology of Porolithon gardineri (Foslie). PhD thesis, University of Hawaii,
Hono-lulu, HA
Anning T, Nimer N, Merrett MJ, Brownlee C (1996) Costs and benefits of calcification in coccolithophorids. J Mar Syst 9: 45–56
Balch WM, Holligan PM, Kilpatrick KA (1992) Calcification, photosynthesis and growth of the bloom-forming cocco-lithophore, Emiliania huxleyi. Cont Shelf Res 12:
1353–1374
Beardall J, Giordano M (2002) Ecological implications of microalgal and cyanobacterial CCMs and their regulation. Funct Plant Biol 29:335–347
Beardall J, Raven JA (1981) Transport of inorganic carbon and the ‘CO2-concentrating mechanism’ in Chlorella emersonii (Chlorophyceae). J Phycol 17:134–141
Beardall J, Johnston A, Raven J (1998) Environmental regula-tion of CO2-concentrating mechanisms in microalgae. Can
J Bot 76:1010–1017
Bernard O, Malara G, Sciandra A (1996) The effects of a con-trolled fluctuating nutrient environment on continuous cultures of phytoplankton monitored by a computer. J Exp Mar Biol Ecol 197:263–278
Berry L, Taylor AR, Lucken U, Ryan KP, Brownlee C (2002) Calcification and inorganic carbon acquisition in cocco-lithophores. Funct Plant Biol 29:1–11
Brand LE, Sunda WG, Guillard RRL (1983) Limitation of marine phytoplankton reproductive rates by zinc, man-ganese, and iron. Limnol Oceanogr 28:1182–1198
Brewer PG, Goldman JC (1976) Alkalinity changes gener-ated by phytoplankton growth. Limnol Oceanogr 21: 108–117
Bruyant F, Babin M, Sciandra A, Marie D and 8 others (2001) An axenic cyclostat of Prochlorococcus PCC 9511 with a
simulator of natural light regimes. J Appl Phycol 13: 135–142
Buitenhuis ET, de Baar HJW, Veldhuis MJW (1999) Photosyn-thesis and calcification by Emiliania huxleyi
(Prymnesio-phyceae) as a function of inorganic carbon species. J Phycol 35:949–959
Buitenhuis ET, van der Wal P, de Baar HJW (2001) Blooms of
Emiliania huxleyi are sinks of atmospheric carbon dioxide:
a field and mesocosm study derived simulation. Global Biogeochem. Cycles 15:577–587
Clark DR, Flynn KJ (2000) The relationship between the dis-solved inorganic carbon concentration and growth rate in marine phytoplankton. Proc R Soc Lond Ser B Biol Sci 267: 953–959
Dickson AG (1993) pH buffers for seawater media based on the total hydrogen ion concentration scale. Deep-Sea Res 40:107–118
Dickson AG, Goyet C (1994) Handbook of methods for the analysis of the various parameters of the carbon dioxide system in seawater (Version 2). DOE (US Department of Energy) ORNL/CDIAC-74, Carbon Dioxide Information and Analysis Center, Oak Ridge, TN
Egge JK, Heimdal BR (1994) Blooms of phytoplankton includ-ing Emiliania huxleyi (Haptophyta). Effects of nutrient
supply on different N:P ratios. Sarsia 79:333–348
Elderfield H (2002) Climate change: carbonate mysteries. Sci-ence 2969:1618–1619
Elzenga JTM, Prins HBA, Stefels J (2000) The role of extra-cellular carbonic anhydrase activity in inorganic carbon utilization of Phaeocystis globosa (Prymnesiophyceae): a
comparison with other marine algae using the isotopic dis-equilibrium technique. Limnol Oceanogr 45:372–380 Eppley RW, Sloan PR (1965) Carbon balance experiments
with marine phytoplankton. J Fish Res Board Can 22: 1083–1097
Frankignoulle M, Canon C, Gattuso JP (1994) Marine calcifi-cation as a source of carbon dioxide: positive feedback of increasing atmospheric CO2. Limnol Oceanogr 39:
458–462
Gattuso JP, Allemand D, Frankignoulle M (1999) Photosyn-thesis and calcification at cellular, organismal and com-munity levels in coral reefs: a review on interactions and control by carbonate chemistry. Am Zool 39:160–183 Grande KD, Marra J, Langdon C, Heinemann K, Bender ML
(1989) Rates of respiration in the light measured in marine phytoplankton using an 18O isotope-labelling technique.
J Exp Mar Biol Ecol 129:95–120
Harris RP (1994) Zooplankton grazing on the coccolithophore
Emiliania huxleyi and its role in inorganic carbon flux.
Mar Biol 119:431–439
Ietswaart T, Schneider PJ, Prins RA (1994) Utilization of organic nitrogen sources by two phytoplankton species and a bacterial isolate in pure and mixed cultures. Appl Environ Microbiol 60:1554–1560
Keller MD, Selvin R, Claus W, Guillard RRL (1987) Media for the culture of oceanic ultraphytoplankton. J Phycol 23: 633–638
Klaveness D (1976) Emiliania huxleyi (Lohmann) Hay &
Mohler. III. Mineral deposition and the origin of the matrix during coccolith formation. Protistologica 12:217–224 Lalli CM, Parsons TR (1994) Biological oceanography: an
Langdon C, Takahashi T, Marubini F, Atkinson M and 5 oth-ers (2000) Effect of calcium carbonate saturation state on the rate of calcification of an experimental coral reef. Global Biogeochem Cycles 14:639–654
Laws EA (1991) Photosynthetic quotients, new production and net community production in the open ocean. Deep-Sea Res 38:143–167
Leclercq N, Gattuso JP, Jaubert J (2000) CO2 partial pressure controls the calcification rate of a coral community. Global Change Biol 6:329–334
Leclercq N, Gattuso JP, Jaubert J (2002) Primary production, respiration, and calcification of a coral reef mesocosm under increased CO2 partial pressure. Limnol Oceanogr 47:558–564
Malara G, Sciandra A (1991) A multiparameter phytoplank-tonic culture system driven by microcomputer. J Appl Phycol 3:235–241
Merrett MJ, Dong LF, Nimer NA (1993) Nitrate availability and calcite production in Emiliania huxleyi Lohmann. Eur
J Phycol 28:243–246
Muggli DL, Harrison PJ (1996) Effects of nitrogen source on the physiology and metal nutrition of Emiliania huxleyi
grown under different iron and light conditions. Mar Ecol Prog Ser 130:255–267
Nimer NA, Merrett MJ (1993) Calcification rate in Emiliania huxleyi Lohmann in response to light, nitrate and
avail-ability of inorganic carbon. New Phytol 123:673–677 Nimer NA, Merrett MJ (1995) Calcification rate in relation to
carbon dioxide release, photosynthetic carbon fixation and oxygen evolution in Emiliania huxleyi. Bull Inst
Oceanogr 14:37–42
Nimer NA, Merrett MJ (1996) The development of a CO2-concentrating mechanism in Emiliania huxleyi. New
Phy-tol 133:383–389
Nimer NA, Brownlee C, Merrett MJ (1994a) Carbon dioxide availability, intracellular pH and growth rate of the coccol-ithophore Emiliania huxleyi. Mar Ecol Prog Ser 109:
257–262
Nimer NA, Guan Q, Merrett MJ (1994b) Extracellular and intracellular carbonic-anhydrase in relation to culture age in a high-calcifying strain of Emiliania huxleyi Lohmann.
New Phytol 126:601–607
Paasche E (1964) A tracer study of the inorganic carbon uptake during coccolith formation and photosynthesis in the coc-colithophorid Coccolithus huxleyi. Physiol Plant 3:1–82
Paasche E (1998) Roles of nitrogen and phosphorus in coccol-ith formation in Emiliania huxleyi (Prymnesiophyceae).
Eur J Phycol 33:33–42
Paasche E (1999) Reduced coccolith calcite production under light-limited growth: a comparative study of three clones of Emiliania huxleyi (Prymnesiophyceae). Phycologia 38:
508–516
Paasche E (2002) A review of the coccolithophorid Emiliania huxleyi (Prymnesiophyceae), with particular reference
to growth, coccolith formation, and calcification–photo-synthesis interactions. Phycologia 40:503–529
Palenik B, Henson SE (1997) The use of amides and other organic nitrogen sources by the phytoplankton Emiliania huxleyi. Limnol Oceanogr 42:1544–1551
Pascual M, Caswell H (1997) From the cell cycle to population cycles in phytoplankton–nutrient interactions. Ecology 78: 897–912
Rambourg A (1967) Détection des glycoprotéines en micro-scopie électronique: coloration de la surface cellulaire et de l'appareil de Golgi par un mélange acide chromique-phos-photungstique. CR Hebd Séances Acad Sci 265:1426–1428 Raven JA, Johnston AM (1991) Mechanisms of inorganic-car-bon acquisition in marine phytoplankton and their impli-cations for the use of other resources. Limnol Oceanogr 36: 1701–1414
Raven JA, Osborne A, Johnston AM (1985) Uptake of CO2by
aquatic vegetation. Plant Cell Environ 8:417–425 Reynaud S, Leclercq N, Romaine-Lioud S, Ferrier-Pagès C,
Jaubert J, Gattuso JP (in press) Interacting effects of CO2
partial pressure and temperature on photosynthesis and calcification in a scleractinian coral. Global Change Biol 9 Riebesell U, Zondervan I, Rost B, Tortell PD, Zeebe RE, Morel FMM (2000) Reduced calcification of marine plankton in response to increased atmospheric CO2. Nature 407:
364–367
Riegman R, Stolte W, Noordeloos AAM, Slezak D (2000) Nutrient uptake and alkaline phosphatase (EC 3:1:3:1) activity of Emiliania huxleyi (Prymnesiophyceae) during
growth under N and P limitation in continuous cultures. J Phycol 36:87–96
Rost B, Riebesell U, Burkhardt S, Sultemeyer D (2003) Carbon acquisition of bloom-forming marine phytoplankton. Limnol Oceanogr 48:55–67
Vaulot D, RJ O, Merkel S, Chisholm SW (1987) Cell-cycle response to nutrient starvation in two phytoplankton species, Thalassiosira weissflogii and Hymenomonas carterae. Mar Biol 95:625–630
Ware JR, Smith SV, Reaka-Kudla ML (1992) Coral reefs: sources or sinks of atmospheric CO2? Coral Reefs 11:127–130
Williams PJ, LeB, Jenkinson NW (1982) A transportable microprocessor-controlled precise Winkler titration suit-able for field station and shipboard use. Limnol Oceanogr 27:576–585
Zeebe RE, Wolf-Gladrow DA (2001) CO2in seawater:
equilib-rium, kinetics, isotopes. Elsevier, Amsterdam
Zondervan I, Zeebe RE, Rost B, Riebesell U (2001) Decreasing marine biogenic calcification: a negative feedback on ris-ing atmospheric pCO2. Global Biogeochem Cycles 15:
507–516
Zondervan I, Rost B, Riebesell U (2002) Effect of CO2 concen-tration on the PIC/POC ratio in the coccolithophore
Emiliania huxleyi grown under light-limiting conditions
and different daylengths. J Exp Mar Biol Ecol 272:55–70
Editorial responsibility: Otto Kinne (Editor), Oldendorf/Luhe, Germany
Submitted: January 8, 2003; Accepted: July 17, 2003 Proofs received from author(s): September 29, 2003