HAL Id: hal-00728214
https://hal.archives-ouvertes.fr/hal-00728214
Submitted on 5 Sep 2012
HAL is a multi-disciplinary open access
archive for the deposit and dissemination of
sci-entific research documents, whether they are
pub-lished or not. The documents may come from
teaching and research institutions in France or
abroad, or from public or private research centers.
L’archive ouverte pluridisciplinaire HAL, est
destinée au dépôt et à la diffusion de documents
scientifiques de niveau recherche, publiés ou non,
émanant des établissements d’enseignement et de
recherche français ou étrangers, des laboratoires
publics ou privés.
A New Histogram-based Descriptor for Images Retrieval
from databases
Kidiyo Kpalma, Cong Bai, Miloud Chikr El-Mezouar, Kamel Belloulata,
Nasreddine Taleb, Lakhdar Belhallouche, Djamal Boukerroui
To cite this version:
Kidiyo Kpalma, Cong Bai, Miloud Chikr El-Mezouar, Kamel Belloulata, Nasreddine Taleb, et al.. A
New Histogram-based Descriptor for Images Retrieval from databases. International Workshop on
Next Generation Intelligent Medical Decision Support Systems (MedDecSup 2012), Jul 2012, Sofia,
Bulgaria. �hal-00728214�
A New Histogram-based Descriptor for Images
Retrieval from databases
Kidiyo KPALMA1,a, Cong BAIa, Miloud CHIKR EL MEZOUARa,b Kamel BELLOULATAb, Nasreddine TALEBb, Lakhdar BELHALLOUCHEb
Djamal BOUKERROUIc
aUEB - INSA, IETR, UMR 6164, F-35708 Rennes, France bRCAM – Université de Sidi Bel Abbès, Algeria cHeudiasyc UMR 7253 UTC, F-60205 Compiègne, France
Abstract. In this paper, we propose a new approach for designing
histogram-based descriptors. For demonstration purpose, we generate a descriptor histogram-based on the histogram of differential-turning angle scale space (d-TASS) function and its derived data. We then compare the proposed histogram-based descriptor with the traditional histogram descriptors in terms of retrieval performance from image databases. Experiments on three shapes databases demonstrate the efficiency and the effectiveness of the new technique: the proposed technique of histogram-based descriptor outperforms the traditional one. These experiments showed also that the proposed histogram-based descriptor using d-TASS function and the derived features performs well compared with the state-of-the-art. When applied to texture images retrieval, the proposed approach yields higher performance than the traditional histogram-based descriptors. From these results, we believe that the proposed histogram-based descriptor should perform efficiently for medical images retrieval so we will focus on this aspect in the future work.
Index Terms—pattern recognition, image description, image retrieval, texture
image, differential-turning angle scale space, turning angle scale space, bull's eye performance.
1 Introduction
With the extraordinary growth of image databases due to the development of digital systems, automatic image retrieval within large databases becomes necessary. To make them more efficient and more easy to use, retrieval systems must be based preferably on images content.
In the present study, we use the d-TASS (differential-Turning Angle Scale Space) function and two related measurements to generate their corresponding histograms
1
from which the shape descriptor is built. The d-TASS function introduced in [4] and [5] is known to yield characteristic properties and to be invariant under translation, rotation and scale change.
The rest of the paper is organized as follows: after a brief description of the d-TASS construction and the definition of the related features, in section 2, the proposed descriptor is presented in section 3. Section 4 presents some experimental results and compares the proposed and the traditional histogram-based descriptor generation. We also present some comparison of the proposed approach and some existing techniques of the state of the art. Finally, section 5 gives some discussions and concludes the paper.
2 Description of the features
As presented in [5], the input contour is defined by a set of N points ordered counter clockwise in the plane. Given a starting point P0, the points are numbered from P0 to PN-1. The vector V originating at Pn n and oriented towards Pn+1 makes an angle θ n
with the x-axis. This angle is called the turning angle. Figure 1, illustrates the principle. From this angle, we define the differential turning angle (d-TA) function ϕ : n
1 − − = n n n θ θ ϕ (1) Pn Pn-2 Pn-1 Pn+1 Pn+2 n Vr 1 − n Vr 2 − n Vr ϕn 1 − k Vr k Vr Pk Pk-1 ϕk θn θn-1
Fig.1: Illustration of the differential-turning angle
The d-TA function yields an expression of the curvature of the contour thus its zero-crossing corresponds to that obtained from curvature analysis [12] and [13].
2.1 Generation of the d-TASS function
By definition, the d-TASS function is generated, by progressively smoothening the contour with a Gaussian filter [4], [5] and [6]. Given a Gaussian kernel with a standard deviation σ0, a progressive filtering is performed by iterating the operation so that the filtering scale σs=σ0 s is reached after s iterations. In this study, a Gaussian kernel of
size 3 (g=[0.25, 0.50, 0.25]) corresponding to σ0= 2/π is used. After each iteration, the d-TA function is computed. Thus, given a range of scales (a range of iterations), one obtains the d-TASS function.
From the d-TA function, three essential points are derived to give the d-TASS map [5]. These essential points are:
• α-points corresponding to local minimums of the d-TA function, • β-points corresponding to local maximums of the d-TA function, • γ-points corresponding to zero-crossings of the d-TA function. 2.2 Derived features
Generating the d-TASS function and the corresponding map is done according to the following procedure. The input contour is resampled to generate 360 equidistant points [4] and [5] ordered counter clockwise. From this input sequence, the d-TA function is computed to generate corresponding essential points. In this study, we focus on the γ-points only because they will be used to set the stop condition of the iteration process. Like in the case of curvature scale space (CSS) [12], the stop condition is that there is no more γ-point at the current scale.
At each scale σs (iteration s), γ-points are detected and the following desired features are computed:
• an area function: area of the triangle defined by the current point Pn, the following one Pn+1 and the mid-point PM between two consecutive γ-points (see Fig.2.b).
• a distance function: distance between the current contour point Pn and the mid-point PM (see Fig.2.c)
Pk+1 a) b) c) P0 Pσ Pσ,1 Pσ,2 Pσ,3 Pσ,4 Pσ,5 Pn+1 Pn Pk Pk+1 P0 Pn Pσ,6 Pσ,1 Pσ,2 Pσ,3 Pσ,4 Pσ,5 P0 PM PM2 PM1 PM2 Pk
Fig.2: a: original contour and the illustration of b) the area function and c) the distance function.
These measures are characteristic of the contour segment. By iterating the process for a range of scales (until the stop condition), we obtain the area scale space function (ASSF) and the distance scale space function (DSSF), respectively, for the area
function and the distance function. Figure 3 illustrates the three corresponding functions for the contour shown in Fig.2.a. The superimposed red curves represent the map of γ-points. On this figure, the x-axis represents the curvilinear abscissa and the y-axis the scale (or the iteration number).
a) b) c)
Fig.3: Illustration of a) d-TASS function, b) ASSF function and c) DSSF function.
3 Definition of the proposed descriptor
As said before, the proposed shape descriptor is based on the histograms of the d-TASS function and the related ASSF and DSSF functions. The idea of the proposed technique of histogram generation is based on the approach used in [1] and in [7]. The histogram of the whole database is generated to produce a reference histogram from which we calculate decision levels that enable us to generate descriptors. Commonly and particularly in [7], histogram descriptors are designed by simply uniformly quantizing the feature of interest (say the image grey scale) and then counting the number of elements having the same value and then taking the number of desired bins. This approach has proved to provide efficient results.
The proposed technique is borrowed from image coding or image restoration where histogram equalization is applied. In image processing, it is shown that this adaptive quantification can help to reduce the bit rate and to enhance signal-to-noise ratio. Starting from this observation, we propose to design the histogram-based descriptor by defining the histogram bins like in the case of adaptive quantization.
First, the reference histogram of the database is generated and normalize to sum to the unity. Then the adaptive quantization is designed such a way that the "probability" to get a value between any two consecutive decision levels is equal. Knowing the desired number K of bins, this probability equals PK=1/K. This enables to generate decision levels that are then used to define the descriptor for the query. Finally, for each individual histogram, use the generated decision levels and sum up the bins between two consecutive levels. This leads to the descriptor for the contour under study. Figure 4, illustrates the principle and indicates the decision levels; it also shows an example of generated histogram bins.
The proposed descriptor is thus defined by the concatenation of individual descriptors, corresponding to the three features, as follows:
V=[HdTASS HASSF HDSSF] (2)
where HdTASS, HASSF are HDSSF are the respective generated histograms descriptors of d-TASS, ASSF and DSSF functions. Thus the length of the generated descriptor V is D=3K 0 1 00 150 2 00 25 0 0 0 .1 5 a) 50 0 50 1 00 150 2 00 25 0 0 0.1 b) c)
loc at ion of decision levels
1 2 3 4 5 6 7
Fig.4: a) Reference histogram of the whole database, b) histogram of a contour ("bonefishes"),
and c) its 7-bins' proposed histogram.
4 Evaluation of the proposed descriptor
To evaluate the ability of the proposed descriptor to discriminate objects, we have conducted experiments of image retrieval from database of planar objects. In order to compare our results with those from other methods, the experiments are done on three well-known databases that are the kimia99 dataset [8], the multiview curve dataset (MCD) [10], [11] and that extracted from the SQUID marine animals [12]. The performance of the descriptors is evaluated using the Precision-Recall curve averaged over the whole database and particularly we present the bull's eye performance (BEP). The similarity measure is based on Manhattan distance. As proposed in [12], some global parameters like eccentricity, aspect ratio and circularity are taken into account. Based on this, a two-steps hierarchical procedure is performed: given a global parameter g, a threshold thg is set so that all models giving max(g ,g ) thg 1
g g M Q M Q− ≤ < are discarded from the retrieval procedure, where gQ and gM are the parameter corresponding, respectively, to query Q and model M.
Then we define the similarity measure between the query and a model, represented by their respective descriptor vectors VQ and VM, as follows:
∑
∑
= − + = − = D 1 i M Q G 1 i M Q(i) g (i) V(i) V(i) g ) M , Q ( Sim α β (3)where G is the number of global parameters (7 in this case), α and β are the weights applied, respectively, to global parameters distance and to that of the histogram descriptor.
4.1 Performance assessment
Precision and Recall are two parameters commonly used to assess the performance of a retrieval system. They are given by relations (4) and (5)
Retrieved # Relevant) (Retrieved # Precision= (4) Relevant # Relevant) (Retrieved # Recall= (5)
The BEP indicates the percentage of the retrieved relevant contours after we have retrieved twice the number of relevant contours in the database: this corresponds to the Recall for the twice the number of relevant contours in the database. It provides an objective measurement of the efficiency of a retrieval system: the higher it is, the better is the system.
Results presented in the next sections correspond to the average values all over the database by using each contour of the database as a query.
4.2 Test sets
The evaluation is done on three databases. The first one is proposed by Klein and Kimia [8]. It consists of shapes gathered from different sources to form 9 different categories. Each category contains 11 shapes leading to variations in form, occlusion, articulation, missing parts... This gives a total of 99 shapes. Figure 5 illustrates this dataset. As our method utilizes contour-based analysis, an edge detector is applied to each of these elements to extract the corresponding contours.
Fig.5: Content of the kimia99 dataset
The second dataset is the multiview curve dataset (MCD) [14]. It consists of 40 classes drawn from the MPEG-7 Core Experiment Shape-1. Each class contains 14 contours corresponding to different perspective distortions of the original one. Figure 6 shows a sample set taken from this database.
bell01 bell08 bell05 bell09 bell02 bell12 bell03 bell07 bell10 bell14 bell04 bell06 bell11 bell13
apple01 apple08 apple09 apple02 apple11 apple04 apple12 apple05 apple10 apple03 apple13 apple07 apple14 apple06
butterfly01 butterfly08butterfly12butterfly05butterfly02 butterfly09 butterfly03 butterfly10 butterfly04 butterfly11 butterfly13 butterfly06 butterfly07 butterfly14
insect01 insect08 insect10 insect03 insect05 insect12 insect13 insect09 insect02 insect06 insect14 insect07 insect04 insect11
bat01 bat08 bat02 bat09 bat10 bat03 bat04 bat14 bat11 bat07 bat12 bat05 bat13 bat06
bone01 bone08 bone09 bone02 bone14 bone07 bone10 bone03 bone05 bone12 bone11 bone04 bone06 bone13
brick01 brick08 brick04 brick11 brick09 brick02 brick07 brick06 brick14 brick13 brick10 brick03 brick05 brick12
camel01 camel08 camel14 camel07 camel13 camel06 camel10 camel03 camel02 camel09 camel11 camel04 camel12 camel05
Fig.6: A sample set of MCD database contours
The MCD dataset presents realistic perspective transformations that one can encounter while creating images of real objects. Indeed, in the construction process, the authors [10] have printed the 40 original contours on white paper and for each one, they took images from 7 different view angles using a digital camera and then contours are extracted. By adding random rotations and reflections to these samples, the number of samples in each class is doubled to 14, leading to a total of 560 shapes in the database. The third dataset is the SQUID subset used by F. Mokhtarian and M. Bober in [9] and by F. Mokhtarian et al. in [12]. It consists of 17 classes containing from 6 to 8 shapes selected from the SQUID marine animals database [15] represented on Fig.7, containing 131 shapes. Class 00 Class 01 Class 02 Class 03 Class 04 Class 05 Class 06 Class 07 Class 08 Class 09 Class 10 Class 11 Class 12 Class 13 Class 14 Class 15 Class 16
The evaluation on this database is done by using the same procedure as proposed in [9]. Similar to the concept of Recall, the procedure is as follows:
1. for a given class, use each of the contours as the query and determine the first 15 most similar outputs. Count the number of retrieved relevant contours and compute the ratio of this number to the number of relevant contours in the class. The mean value of this ratio all over the class is the performance measure for the concerned class (see individual columns in table III).
2. repeat 1. for all the classes in the dataset. The overall performance is then obtained by averaging the performance provided by the 17 classes. Column 'Overall' in table III, gives that overall performance for the four involved methods. 4.3 Experimental results
In the experiments we have evaluated the effect of the length of the descriptor. This led us to observe that, for both histogram generation techniques, the performance varies a lot at the beginning and then establishes from a limit length above which there is no gain in performance.
4.3.1 Comparison of the two histograms techniques
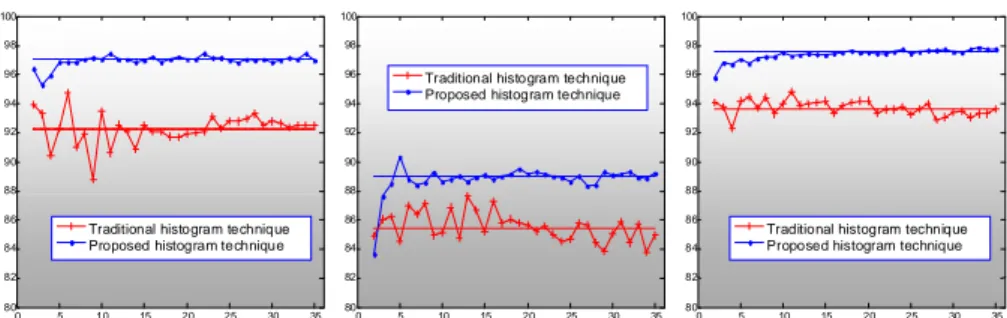
Figure 8 demonstrates the BEP performance computed for a range of the number of bins. This figure shows a performance gap between both techniques of histogram-based descriptor generation. This gap is observed all over the three tested databases.
0 5 10 15 20 25 30 35 80 82 84 86 88 90 92 94 96 98 100 0 5 10 15 20 25 30 35 80 82 84 86 88 90 92 94 96 98 100 0 5 10 15 20 25 30 35 80 82 84 86 88 90 92 94 96 98 100
Traditional histogram technique Proposed histogram technique
Traditional histogram technique Proposed histogram technique
Traditional histogram technique Proposed histogram technique
Fig.8: BEP vs. number of bins for a) kimia99 b) SQUID and c) MCD databases
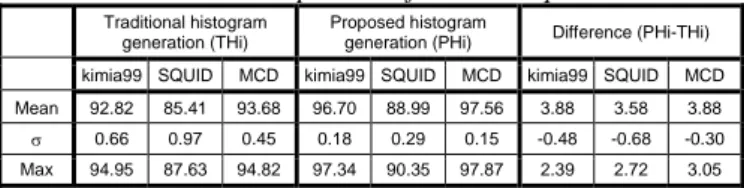
Table I summarizes the retrieval results from the three databases. We present the mean, the standard deviation and the maximal values of BEP over the number of bins used. On the right of the table, we give the differences of those respective values between the two techniques: the value obtained from the new technique minus that of the traditional technique. From this table, it appears clearly that the proposed technique gives the best performance with more than 3.58% mean BEP improvement. Notice also that the proposed technique gives more stable descriptor since the BEP values vary the least: we obtain negative difference values indicating standard deviation reduction (of more that 0.30).
Table I: Comparison of the techniques.
Traditional histogram generation (THi)
Proposed histogram
generation (PHi) Difference (PHi-THi)
kimia99 SQUID MCD kimia99 SQUID MCD kimia99 SQUID MCD
Mean 92.82 85.41 93.68 96.70 88.99 97.56 3.88 3.58 3.88
σ 0.66 0.97 0.45 0.18 0.29 0.15 -0.48 -0.68 -0.30
Max 94.95 87.63 94.82 97.34 90.35 97.87 2.39 2.72 3.05
4.3.2 Comparison of the proposed approach with other approaches
In this subsection, we evaluate the proposed approach and compare it with some existing methods by applying it to appropriate databases.
A - Kimia99 dataset: in this experiment, we retrieve the top 15 most similar for each query. Figure 9 shows an example of this retrieval. The left column represents the query contour. As each category (or class) is composed of 11 contours, there are 10 relevant contours for each query: hence columns 1~10 represent the first top 10. This figure shows that, in most cases, most of the contours from the query category are among the first 10 retrieved contours. In general, the whole class is retrieved after 15 retrievals except for the 8th category (row 8) that misses one shape. The BEP performance for this database is of 97.43% for 11 bins (leading to a 33-length descriptor). In a recent survey, Chandan Singh and Pooja [2] compared their methods with others and showed that their proposal outperforms the best on this dataset. Their proposed descriptor (ZM+HLTC) is hybrid and consists of two kinds of features: 1) local features extracted from the contour by using Hough transform and 2) global (region-based) features extracted from the region of the shape by using Zernike moments (ZM). Query 1 2 3 4 5 6 7 8 9 10 11 12 13 14 15 1 2 3 4 5 6 7 8 9
Fig.9: Results of retrieval from kimia99 database
The BEP obtained is 99.55%: this performance is very challenging. The comparison reported in [2] is done with methods using local, global or hybrid descriptors. Table II
shows the performance of involved methods: as can be observed, the proposed method ranks second just after the challenging ZM+HLTC method. As our descriptor uses only local features, we can reasonably believe that we could improve our performance to meet the latter if we integrate global features.
Table II: Comparison of average BEP with other methods applied to kimia99.
FD local WLD local CPDH local MI global GFD global ZMD global TCS hybrid QLS hybrid ZM+HLTC hybrid Proposed local 84.29 74.39 90.05 8.74 87.93 92.68 84.29 82.81 99.55 97.43 B - SQUID dataset: the following table shows the retrieval results from the SQUID database. For comparison purpose, we use results from the well-known curvature scale space (CSS) descriptor, the Fourier descriptor (FD) and the moment invariants (MI) reported in [9]. Columns 1~17 indicate the mean success retrieval rate for each class and the column "Overall" indicates the mean success retrieval rate over the whole database. As can be seen on this table, the proposed approach outperforms the FD and MI descriptors and ranks first (ex aequo with CSS method).
Table III: Comparison of retrieval rate with other methods applied to SQUID dataset
Class N° 1 2 3 4 5 6 7 8 9 10 11 12 13 14 15 16 17 Overall CSS 89 86 81 95 100 100 91 98 75 92 81 100 94 89 100 95 69 91 Proposed 88 91 96 100 100 97 93 98 75 97 74 96 92 85 91 99 68 91 FD 100 84 100 75 78 42 80 100 36 98 13 70 78 98 73 97 48 75 Des cri pt or s MI 34 78 91 100 88 41 72 86 47 53 23 91 53 45 72 73 58 65
C - MCD dataset: Figure 10 shows the Precision vs. Recall graphs obtained from the MCD database. Compared to the results reported in recent studies [3] and [11], the proposed approach performs very well. The Recall-Precision graph indicates more than 91.86% Recall for more than 92% Precision for the proposed approach. This outperforms the reported performance that are 86% Recall for 85% Precision for Helmholtz curve descriptor (HCD) [11] and 90% Recall for 90% Precision obtained by Ekombo et al. with the invariant Fourier descriptor [3].
0 10 20 30 40 50 60 70 80 90 100 30 40 50 60 70 80 90 100 HCD (Zulian 2004) FDn (Ekombo 2009) Proposed method Recall Pr ec is io n
5 Conclusion
The subject of this study is the description of planar objects based on the analysis of their contours. For this purpose, we introduced two contributions: 1) first, we proposed a new descriptor based on the histograms of three features derived from the turning angle scale space analysis of the contours and 2) we adopted another technique for histogram descriptor generation as opposed to traditional histogram-based descriptors. The proposed technique of histogram generation jointly with the new features provides an efficient and effective descriptor that outperforms the traditional histogram descriptor. Applied to three databases, the proposed technique gave more than 3.58% improvement of the bull's eye performance regarding the traditional histogram descriptors.
Initially designed for d-TASS-based descriptor for shape retrieval, the novel technique of histogram-based descriptor construction is successfully applied for texture retrieval. These encouraging results suggest a potential application (using an appropriate set of features: DCT, ...) of the novel proposed histogram technique on medical images retrieval.
Finally, as demonstrated by experimental results, the proposed descriptor allows reaching state-of-the-art performance. Since this descriptor is based only on contour information, we believe that the descriptor can be improved by combining it with a region-based feature.
From the previous observations, the future developments of this study will be of two main types: the first will be to generate a hybrid descriptor by combining contour-based and region-contour-based features in order to improve the shape descriptor and the second will be to extend the proposed histogram generation technique to medical images description for their retrieval from databases.
Acknowledgements: This work was partially supported by the Franco-Algerian cooperation program PHC TASSILI grants. Entitled "Système Conjoint de Compression et d’Indexation Basé-Objet pour la Vidéo (SCCIBOV)", the project gathers members of Institut National des Sciences Appliquées (INSA) de Rennes, Université de Technologie de Compiègne (UTC), the University of Sidi Bel Abbès and the University of Mascara.
References
[1] Bai, C., Kpalma K., and Ronsin, J., A new descriptor based on 2D DCT for image retrieval, International Conference on Computer Vision Theory and Applications (VISAPP), pp. 714-717, February 24-26, 2012, Roma, Italy
[2] Chandan Singh, Pooja, Improving image retrieval using combined features of Hough transform and Zernike moments, Elsevier, Optics and Lasers in Engineering, Vol. 49,
No.12, pp 1384-1396, 2011
[3] Ekombo, P. L. E., Ennahnahi, N., Oumsis, M., and Meknassi, M., Application of affine invariant Fourier descriptor to shape-based image retrieval, International Journal of Computer Science and Network Security (IJCSNS), Vol.9, No.7, pp. 240-247, 2009 [4] Kpalma, K., Yang, M. and Ronsin, J., Planar shapes descriptors based on the turning angle
scalogram, 5th International Conference on Image Analysis and Recognition (ICIAR), Povoa de Varzim, Portugal, June 25-27, pp. 547-556, Proceedings, Lecture Notes in Computer Science, Vol.5112, Springer, ISBN 978-3-540-69811-1, 2008
[5] Kpalma, K., and Ronsin, J., Turning Angle Based Representation for Planar Objects, Electronics Letters / IEE Electronics Letters, Vol.43, No.10, pp. 561-563, 2007
[6] Kpalma, K., and Ronsin, J., Multiscale contour description for pattern recognition, Pattern Recognition Letters, Vol.27, No.13, pp. 1545-1559, 1 October 2006
[7] Zhong D., Defée I. DCT histogram optimization for image database retrieval, Pattern Recognition Letters, Vol. 26, pp. 2272-2281, 2005.
[8] Klein, S.T.B., P.N., Kimia, B.B. Recognition of shapes by editing their shock graphs. IEEE Trans. Pattern Anal. Machine Intell. Vol.26, No.5, pp. 550-571, 2004.
[9] Zhang, D., and Lu, G. Review of shape representation and description techniques, Pattern Recognition, Vol. 37, pp. 1–19, 2004.
[10] Zuliani, M., Bhagavathy, S., Manjunath, B., and Kenney, C. S., Affine-invariant curve matching, in IEEE International Conference on Image Processing (ICIP), October 2004. [11] Zuliani, M., Kenney, C., Bhagavathy, S., Manjunath, B. S., Drums and Curve Descriptors,
British Machine Vision Conference (BMVC), September 2004.
[12] Mokhtarian, F., and Bober, M., Curvature Scale Space Representation: Theory, Applications and MPEG-7 Standardization. Kluwer Academic Publishers, 2003.
[13] Mokhtarian F. and A. K Mackworth. A Theory of Multiscale, Curvature-Based Shape Representation for Planar Curves, in IEEE Transactions on Pattern Analysis and Machine Intelligence, Vol. 14, N°. 8, pp. 789 – 805, 1992
[14] http://vision.ece.ucsb.edu/~zuliani/Research/MCD/MCD.shtml, visited November 25, 2010 [15] http://www.ee.surrey.ac.uk/CVSSP/demos/css/demo.html, visited November 25, 2010