HAL Id: hal-01796841
https://hal.archives-ouvertes.fr/hal-01796841
Submitted on 5 Mar 2019HAL is a multi-disciplinary open access
archive for the deposit and dissemination of sci-entific research documents, whether they are pub-lished or not. The documents may come from teaching and research institutions in France or abroad, or from public or private research centers.
L’archive ouverte pluridisciplinaire HAL, est destinée au dépôt et à la diffusion de documents scientifiques de niveau recherche, publiés ou non, émanant des établissements d’enseignement et de recherche français ou étrangers, des laboratoires publics ou privés.
Experimental and numerical infrared heating of
thermoplastic sheet during thermoforming process
Sylvia Andrieu, Fabrice Schmidt, Yannick Le Maoult
To cite this version:
Sylvia Andrieu, Fabrice Schmidt, Yannick Le Maoult. Experimental and numerical infrared heating of thermoplastic sheet during thermoforming process. Polymer Processing Society 20th anniversary celebration, Jun 2004, Akron (Ohio), United States. 9 p. �hal-01796841�
Experimental and numerical infrared heating of thermoplastic sheet
during thermoforming process
Paper No: 162
Sylvia Andrieu, Fabrice Schmidt, Yannick le Maoult,
Ecole des Mines d’Albi Carmaux, Campus Jarlard, 81000 Albi (France)
Abstract
Thermoforming includes a heating stage of thermoplastic sheets by infrared lamps. The temperature distribution on the surface and through the thickness of the sheet conditions the distribution thicknesses of the thermoformed part. Our objective is to understand the heat transfers between the infrared heaters and the thermoplastic sheets.
For that we developed an infrared heating device which makes it possible to carry out temperature measurements of a sheet during the heating with an infrared oven. An AGEMA 880 LW infrared camera allows measuring the back surface (non-directly exposed to the radiation) temperature distribution of the sheet. An indication of temperature discrepancy through the thickness is given by a RAYTEK Thermalert TX pyrometer. Two infrared ovens (halogen and ceramics lamps) were studied characteristics of infrared ranges (short and long wavelengths respectively) on a polymer representative of the thermoforming market (white PS 3mm-thickness sheets).
These experimental measurements allow validating the numerical models. A method of radiative transfer based on ray tracing is used to calculate the irradiance with lamp reflectors. The Rosseland approximation is used to take into account the optical properties of the polymers that were measured using infrared spectrometry. The transient heat balance equation (including 3D radiative diffusion) is solved.
1.
Introduction
Thermoforming is an industrial process that involves a heating step before forming [1]. During this stage, the thermoplastic sheet is warmed up to forming temperature. The range of forming temperatures varies from polymer to polymer [2]. Basically, the range is large with amorphous polymers like polystyrene and narrow with crystalline polymers like polypropylene. The thermoforming machines are generally equipped with ceramic heaters that function in the long-wavelength infrared (?max~ 3 µm). In our study, we use also halogen
lamps that are short-wavelength infrared (?max~ 1.2 µm).
The aim of our study is to understand the radiative transfers between infrared heaters and thermoplastic sheets. We want to measure sheet temperature in order to obtain a better temperature distribution over the sheet surface and through the thickness. We want to study thin-gage and heavy-gage thermoplastic sheet. So it is important to obtain an indication of the temperature gradient throughout the sheet. A numerical method of radiative transfer based on ray tracing has been developed to compute the view factors between the oven and a thermoplastic sheet. The Rosseland approximation is used to take into account the optical properties of the polymers which were measured by infrared spectrometry. The transient heat balance equation is solved using PLASTIRAD software based on a control volume method. Comparisons between experimental and numerical results allow validation of numerical model.
In this paper, we will present the experimental infrared heating device, the characterization of the infrared ovens, the thermal and optical characterizations of the polymer, the heating measurements and the results of the numerical simulations.
2.
Experimental infrared heating set-up
The infrared heating set-up (fig. 1) has been developed in order to study the interaction between the infrared radiation and polymers during the heating conditioning step of the thermoforming process. Thermoforming machines do not allow measurement of the sheet temperature during the heating except in specific location using a pyrometer. The infrared device described below makes these measurements possible. In addition, this device could be used as an optimisation tool of temperature distribution: each lamp is power-regulated.
The infrared heating device consists of an aluminium structure (1) that supports an infrared oven (2) power-regulated by an electrical power box (3). A metallic frame (4) clamps the thermoplastic sheet (5). The aluminium structure has been designed in order to change the distance between the sheet and the oven. For the experiment, in this paper, the distance is fixed to 15 cm. A polished aluminium mirror (6) is adjusted at 45° under the sheet to measure the sheet temperature on the surface that is not directly exposed to the infrared radiation (“back surface”) using an infrared camera (7) (880 LW AGEMA). A pyrometer (8) has been placed to measure the local sheet temperature on the “front surface”. Local back and front temperature measurements allow to measure temperature gradients through the thermoplastic sheet thickness.
Figure 1- Infrared heating set-up
3.
Characterization of infrared ovens
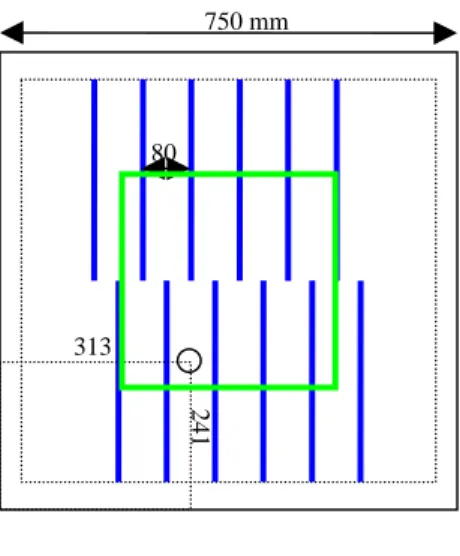
A halogen oven is constituted of twelve 500W-halogen lamps (13169Z CLEAR Philips 500W-230V). A ceramic oven is constituted of ten 600W-ceramic lamps (Elstein HTS/1 600W-230V). The interval between halogen lamps is 80 mm; it has been optimised using numerical simulations performed with the PLASTIRAD software.
As sketched in figure 2, the lamps positions in front of the 350 mm x 350 mm thermoplastic sheet are given. In addition, the location of the oven hole (in order to measure locally the temperature using a pyrometer) is noticed.
1 2 4 5 3 6 7 8
a. halogen oven b. ceramic oven Figure 2 - Infrared Ovens
The oven irradiance cartography has been measured using a XY bench. This experimental set-up permits to measure the irradiance of a heat source using a thermopile MEDTHERM 64 that functions from 0.6 up to 15 µm. The measures are performed at 15 cm of the oven. In the following irradiance cartography (W/m2), 1681 points have been measured in 800 mm x 800 mm surface around the oven.
1 3 5 7 9 1 1 1 3 1 5 1 7 1 9 2 1 2 3 2 5 2 7S1 S3 S5 S7 S9 S11 S13 S15 S17 S19 S21 S23 S25 S27 10000-12500 7500-10000 5000-7500 2500-5000 0-2500 1 4 7 10 13 16 19 22 25 28 31 34 37 40 S1 S4 S7 S10 S13 S16 S19 S22 S25 S28 S31 S34 S37 S40 10000-12500 7500-10000 5000-7500 2500-5000 0-2500
a. halogen oven b. ceramic oven
Figure 3 - Irradiance cartographies
In a 350 mm x 350 mm surface around the oven corresponding to the sheet dimensions, the cartography irradiance for the two ovens is given in the table below:
Oven Ceramic Halogen
Electrical power 6000 6000
Power receive by the 35cm*35cm surface (W)
1221 (20.3%) 1246 (20.8%)
Mean irradiance (W/m2) 9421 9612
Table 1- Mean irradiances 750 mm 80 313 2 4 1 600 mm 240 3 0 0 120 Irradiance W/m2 Irradiance W/m2
The values of irradiances are very similar in both cases. Our goal is to model the interaction between the infrared radiation and the halogen lamps. For that purpose, we have to measure the thermal and optical properties of the polymer.
4.
Thermal and optical properties of PS sheets
a. Thermal properties
In order to obtain reproducible results, we have to extrude thermoplastic sheets. The extrusion machine used is an OMV D120. The prescribed flow rate to extrude is 150 kg/h because of the small quantities of polymer. The HIPS used is a mix between EMPERA 251 and EMPERA 622 with 2% of white pigments in weight. The specific mass is 1040 kg/m3 and the thermal conductivity is 0.18 W/m/K. We used 3mm-thickness thermoplastic sheets. The forming temperature range is between 127°C and 182°C.
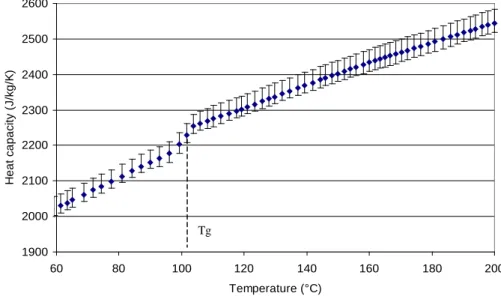
The heat capacity Cp is an important parameter for solving the heat balance equation. For
that, DSC measurements have been performed using a classic 10°C/mn heating speed. The heat capacity versus temperature is plotted in the figure below:
1900 2000 2100 2200 2300 2400 2500 2600 60 80 100 120 140 160 180 200 Temperature (°C) H e a t c a p a c it y ( J /k g /K )
Figure 4- PS heat capacity
We can notice that the glass transition temperature is close to 100°C. The glass transition is characteristic of an important increase of the heat capacity Cp. The numerical simulations have to take into account CP variation for the accuracy of the model.
b. Optical properties
An infrared spectrometer Perkin-Elmer (FT-IR) that functions in the 1.3-25 µm wavelengths range has been used to measure optical properties. Two modes have been employed the transmission and specular reflection methods [3]. The measurements have been performed at ambient temperature. The mean reflection coefficient r(T) is calculated using the data versus wavelength.
∫ ∫ = Äë (T)dë 0 ë L Äë (T)dë 0 ë L ë r r(T) (1)
L0λ is the spectral intensity of a black body. The mean reflection coefficient is low about 3% in the 1.3-25 µm wavelengths range. According to the Wien law displacement, we have to proceed to measurements in lower wavelengths. We used a near infrared spectrometer functioning in the 0.4 to 1.1 µm wavelengths range to complete the previous measures. In this wavelengths range mean reflection coefficient is about 80%. In the range from 1.1 to 1.3 µm, we consider a linear interpolation. According to this, the HIPS mean absorption coefficient is 27% for the halogen lamp and 3% for the ceramic lamp.
The transmission method gives the spectral transmission coefficient Tλ at ambient temperature. The mean transmission coefficient T is calculated using previous method. The value obtained (0.1 %) is characteristic of an optical thick polymer.
The thermoplastic sheets have been cut using a microtome (HM 355 MICROM). The thickness sample is between 10 and 100 µm. The relation between the spectral transmission coefficient Tλand the transmissivity τλcould be simplified to:
λ λ λ τ λ rr T + − = 1 1 (2)
If we assume the transmissivity follows the Beer-Lambert law, then: d
e κλ λ
τ = − (3)
And then we obtain:
λ λ κ λ d C T = + −ln (4)
For each wavelength, the data are well-fit by a straight line and the spectral absorption coefficient could be deduced simply using the slope of each straight line. Using this methodology, the absorption coefficient κλbecomes independent of the thickness sample.
The polymer spectral emissivity is obtained using the energy balance as follow: 1 = + +τλ αλ λ r (5)
At wavelength thermal equilibrium, the emissivity is equal to the absorptivity ε =λ αλ. In the 8-12 µm range corresponding to the infrared camera and pyrometer the emissivity of the polymer is ε=0.96. This value is used to calibrate the infrared camera during experimental measurements [4].
5.
Infrared heating
The two infrared ovens have been used to heat 3mm-thickness PS sheets. When the temperature measured by pyrometer (front surface) is 160°C, the heating is stopped. Using ceramics lamps it is impossible to reach the forming temperature due to the rapid increase of the front surface temperature. But forming state is possible using halogen lamps.
The difference between the two kinds of heaters is due to the reflectivity variation. The reflectivity value is greater for the wavelengths range characteristics of halogen lamps (27%) in comparison with ceramic lamps (3%)
20 70 120 170 0 50 100 150 200 250 Time (s) T e m p é ra tu re ( °C )
IRL (pyrometer) IRL (camera) IRC (pyrometer) IRC (camera) Figure 5- Experimental temperature mesurements .
These measurements will permit to validate the numerical model described in following section.
6.
Numerical simulations
a. Ray tracing method
We developed a ray tracing method to take into account the effect of lamp reflectors. This method is very accurate to model the radiation [5]. In this section, we present the irradiance computed using ray tracing method in the case of halogen oven.
The lamp power [6] is calculated using the classical Stefan-Boltzmann law
w S w T w
q=ε σ 4 where εw is the average emissivity, TW the temperature and SW the surface of
the tungsten wire, σ is the Stefan-Boltzmann constant. We obtain 473W for a lamp of electrical power of 500W. The difference is due to loss by so-called “Joule effect”. The cylindrical surface of the lamp is meshed. The number of nodes per lamp is 4800. 3481 rays are emitted from each node like lambertian source. A diffuse reflection (3481 ray per node) has been taken into account for the plane reflector with a reflection coefficient of 80% given by the supplier.
The mean, minimum and maximum irradiance computed in a 350 mm x 350 mm thermoplastic sheet are summarized in the table below:
Mean irradiance (W/m2) Minimum irradiance (W/m2) Maximum irradiance (W/m2) 9592 7676 10989 Computed irradiance/ Relative error (%)/ 0.2 12.7 1.2
Table 2- Computed intensity versus experimental data
The mean and the maximum irradiance computed by ray tracing method are close to experimental data. But the relative error is maximum for surface edges because the oven edges are not taken into account.
b. Rosseland approximation
The Rosseland approximation [7,8] is used to take into account the optical properties inside the polymer. This method avoids long calculations time like those obtained using ray tracing method. This approximation permits to solve heat balance equation in a conduction approach for an optically thick medium. The radiative conductivity (or Rosseland conductivity) is: 3 ) ( 3 16 T T Ross K Ross k = σ (6)
The Rosseland absorption coefficient is obtained versus temperature by integration over the frequency ( ν =c/λ): ∫ ∞ × ∫ ∞ = 0 ) , ( 1 0 ) , ( ) ( 1 ) ( 1 ν ν ν ν ν κ d dT T dB d dT T dB T Ross K (7)
The Rosseland coefficient and the conductivity are computed using the absorption coefficient obtained by infrared spectral measurements. For the PS, the Rosseland conductivity range is between 0.0006 up to 0.0018 for 20°C to 170°C. This conductivity is low in comparison to the thermal conductivity (0.18 W/m/K). This is characteristic of an optically thick polymer. The Rosseland approximation is included into the PLASTIRAD software [9,10] based on a control volume method to solve the 3D heat balance equation.
c. Control volume method
The source terme computed by ray tracing is used as a boundary condition. A convection coefficient of 8W/m2/K is applied at the sheet surfaces. We used the heat capacity measured by DSC. The reflection coefficient used is 27% according to the spectral measurements in the near and average infrared.
20 40 60 80 100 120 140 160 180 0 50 100 150 200 Time (s) T e m p e ra tu re ( °C )
Back surface (exp) Front surface (exp) Back surface (num) Front surface (num) Figure 6 - Comparison experimental / numerical data
The maximum difference between experimental and numerical result is about 10°C. But we obtain an accurate forming point (same pyrometer and camera temperature measurements). The experimental data give 131°C for 174 s and the numerical simulations 132°C for 177 s.
7.
Conclusion
The experimental infrared heating set-up has been developed in order to study and model the heating during the thermoforming process. Surface temperature measurements have been successfully performed using an infrared camera and a pyrometer.
A ray tracing method has been developed to compute the irradiance of an infrared oven. This method allows taking into account the lamp reflectors. The agreement is fair between the computation and the irradiance measurements performed by mean of a XY bench and a thermopile. The Rosseland approximation is valid because of the optically thick property of the white HIPS. This approximation has been included in PLASTIRAD. This sofware, based on a control volume method, compute the temperature for 3D geometry. The forming point is in agreement with data measurements performed by the experimental infrared heating set-up. A sensibility analysis demonstrates that the reflectivity parameter is preponderant. Measurements in the 1 to 2 µm wavelengths range that is poor technically will be very interesting.
The thermal procedure developed in this work will be used in a global step of optimisation and notably in the case of heating under constraint.
8.
Acknowledgements
The authors would like to thank our industrial partners Philips Lighting and EDF R&D Companies for technical support and funding. They thank also their EMAC collaborators Georges Nepsinsky, Ludivine Moga, Guilhem Bocquet and Jean-Michel Mouys. The DSC
measurements have been performed at ENIT school engineers (Tarbes France). Thanks to Michel Boutoleau.
9.
References
[1] Gruenwald G., Thermoforming, a plastics processing guide, Lancaster, (1987) [2] Throne J. L., Technology of thermoforming, Hanser/Gardner Publications, (1996) [3] Spruiell J.E, Polym. Eng. Sc., vol 34, n°2, (1994)
[4] Techniques de l’ingénieur, R 2740, D. Pajani et P. Bremond (in french)
[5] Wen Cai, phD of Ecole des Mines de Paris, Doctorat en énergétique, (1992) (in french) [6] La transmission de la chaleur, André B. De Vriendt, Volume 1, Tome 1, Gaëtan Morin
Editeur, (1984) (in french)
[7] Modest M.F., Radiative heat transfert, McGraw-Hill, Inc, (1993)
[8] Lentes F and Siedow N, Glass Science and technology 72 (6) 188-196 (1999) [9] Monteix Serge, phD of Ecole des Mines de Paris, (2001) (in french)
[10]Schmidt F., Maoult Y.L., Monteix S.,[ J. Mater. Process. Technol. ], vol. 143-14, pp. 225 – 231 (2003)
This document was created with Win2PDF available at http://www.daneprairie.com. The unregistered version of Win2PDF is for evaluation or non-commercial use only.