HAL Id: hal-02649125
https://hal.archives-ouvertes.fr/hal-02649125
Submitted on 25 Nov 2020
HAL is a multi-disciplinary open access
archive for the deposit and dissemination of sci-entific research documents, whether they are pub-lished or not. The documents may come from teaching and research institutions in France or abroad, or from public or private research centers.
L’archive ouverte pluridisciplinaire HAL, est destinée au dépôt et à la diffusion de documents scientifiques de niveau recherche, publiés ou non, émanant des établissements d’enseignement et de recherche français ou étrangers, des laboratoires publics ou privés.
E. Pichot, M. Olivon, A. Perraud, O. Joubert, A. Le Gal La Salle
To cite this version:
E. Pichot, M. Olivon, A. Perraud, O. Joubert, A. Le Gal La Salle. Electrochemical Study of the Versatility of a Solid Cell Working both as Fuel Cell and Electrolysis Modes. Fuel Cells, Wiley-VCH Verlag, 2020, 8th Fundamentals & Development of Fuel Cells Conference FDFC2019, 20 (3), pp.332-341. �10.1002/fuce.201900066�. �hal-02649125�
For Peer Review
Electrochemical study of the versatility of a solid cell working both as fuel cell and electrolysis modes
Journal: Fuel Cells
Manuscript ID fuce.201900066.R1 Wiley - Manuscript type: Original Research Paper
Date Submitted by the Author: n/a
Complete List of Authors: Le Gal La Salle, Annie; Centre National de la Recherche Scientifique Pichot, Erwan; Centre National de la Recherche Scientifique
Olivon, Maxime; Centre National de la Recherche Scientifique Perraud, Alexandre; Centre National de la Recherche Scientifique Joubert, Olivier
For Peer Review
Electrochemical study of the versatility of a solid cell working
both as fuel cell and electrolysis modes
E. Pichot1, M. Olivon1, A. Perraud1, O. Joubert1 and A. Le Gal La Salle1,*
1Institut des Matériaux Jean Rouxel (IMN), CNRS-Université de Nantes UMR6502, 2 rue de
la Houssinière, BP 32229, 44322 Nantes Cedex 3, France
[*]Corresponding author: [email protected]
Abstract
A Ni/Yttria-stabilized zirconia (YSZ) cell with a (La0.60Sr0.40)0.95Co0.20Fe0.80O3- cathode is
tested both in fuel cell and electrolysis modes. In fuel cell mode under dry air and wet H2, the
cell is operated between the Open Circuit Voltage and 0.4 V and reaches 330 mW cm-2 at
850°C for 157 mL min-1 H
2 supply. The influence of temperature and air or hydrogen flow
rate is studied, and impedance measurements show that below 0.8 V the electrolyte becomes the more resistive part of the cell. Nevertheless, fuel utilization yields are higher under oxygen or hydrogen depletion. If it is possible at 750°C to work at low voltage during several hours in the entire voltage range, the voltage decrease must be limited at 850°C. The cell can also be operated under wet air. The same cell can be operated in electrolysis mode, and a power density of 340 mW cm-2 can obtained at 0.3V/OCV under 100 mL min-1 wet (3% H
2O)
5% H2-95% Ar mixture on the fuel side and dry or wet 100 mL min-1 air flow on the air side.
Nevertheless, bubbling air providing the air electrode in salt water has an irreversible detrimental effect on the cell.
Keywords: Solid Oxide Fuel Cell, Solid Oxide Electrolysis Cell, Electrochemical Impedance spectroscopy, Ni-YSZ, LSCF. 3 4 5 6 7 8 9 10 11 12 13 14 15 16 17 18 19 20 21 22 23 24 25 26 27 28 29 30 31 32 33 34 35 36 37 38 39 40 41 42 43 44 45 46 47 48 49 50 51 52 53 54 55 56 57 58 59 60
For Peer Review
1 IntroductionEnergy transition involves the use of a mix of renewable energy resources. Nevertheless, these resources are intermittent, and storage technologies must be developed in order to balance the energy supply and demand. Hydrogen, which can be produced from electrolysis of water using renewable energy, and can also be converted in electricity without noxious gases by a fuel cell, seems a promising energy carrier [1,2].Solid oxide fuel cells (SOFCs), working at high temperatures, are of great interest due to their high energy efficiency and their robustness, even when they are fuel with gaseous mixtures of carbon-containing components [3-5]. The reverse of SOFCs, i.e. solid oxide electrolyzer cells (SOECs), has gained much attention lately due to its advantages over low-temperature electrolysis for its excellent efficiency in hydrogen production [6-8], and possibility of co-electrolysis of H2O
with CO2 [9-11].Some publications report also the possible electrolysis of seawater, which is
a worldwide spread and low-cost resource [12-14].
Moreover, in order to still lower production costs [15], it is also interesting to have the same cell operating both in electrolysis and in fuel cell modes. Such cells have been reported, but their long-term stability seems to be strongly dependent on operation conditions, whose study must be continued [16-18]. Among the different air-electrode compounds, La1-xSrxCo1-yFeyO 3- (LSCF) perovskites remain widely studied in fuel cell mode, but also as cathode materials
for SOEC [19-25]. Even if the degradation of nickel/yttria-stabilized zirconia cermet, which is commonly used as fuel electrode material, has also been reported [26,27], it seems also that its long-term stability can be increased by reversibly cycling between electrolysis and fuel-cell modes [16,20,28]. Nevertheless conflicting results require further studies realized under different operation conditions. This paper presents therefore a systematic study, based on electrochemical impedance spectroscopy, of the operation, both in electrolysis and fuel-cell modes, and performed at different voltages or under different gases supply conditions, of a complete solid oxide electrochemical cell associating LSCF as the air electrode and Ni/YSZ
3 4 5 6 7 8 9 10 11 12 13 14 15 16 17 18 19 20 21 22 23 24 25 26 27 28 29 30 31 32 33 34 35 36 37 38 39 40 41 42 43 44 45 46 47 48 49 50 51 52 53 54 55 56 57 58 59 60
For Peer Review
as the fuel electrode. In the aim of coupling such system with renewables marine energies in harbor facilities, prospective studies under marine atmosphere are also carried out.
2 Experimental 2.1 Cells
SOFC unit cells are commercial (5 cm or 2.5 diameter) circular shaped planar anode-supported 2R-Cell™ from the swiss company Fiaxell schematized in Figure 1 [29,30]. They are composed of materials commonly entering SOFC composition, i.e. an optimized Ni/Yttria-stabilized zirconia (YSZ) anode [31,32], an YSZ electrolyte covered by a gadolinium-doped ceria layer GDC [33] containing a small amount of cobalt oxide as sintering aid, and a (La0.60Sr0.40)0.95Co0.20Fe0.80O3- cathode.
2.2 Cell testing setup
The experimental open-flange setup (Figure 2) [29,30,34] provided by the swiss company Fiaxell is particularly suitable for versatile cells working alternatively in fuel cell and electrolyzer modes. It contains an oven and an inconel support in order to maintain the cell in the furnace. The current collection is provided by a nickel contact (a) on the fuel side and a gold grid (b) on the air side, connected to four wires. Three of them are used to collect the current (c) and the fourth one to read the cell potential (d). Two alumina felts (e) are placed on each collection grid avoid any current leakage. This cell assembly is firmly squeezed between the two inconel flanges (f) and (g) using spring loaded rods (h) inserted in the tubes (i) maintaining fuel and air flowing close to the electrodes, on each side of the cell (j). The cell temperature is measured by a K-type thermocouple inserted in a small inconel tube (k) in contact to the upper alumina felt at the air side. At the fuel side, the H2-containing mixture,
after bubbling in water at room temperature (pH2O=0.3 atm), is fed (red arrows in the Figure
3 4 5 6 7 8 9 10 11 12 13 14 15 16 17 18 19 20 21 22 23 24 25 26 27 28 29 30 31 32 33 34 35 36 37 38 39 40 41 42 43 44 45 46 47 48 49 50 51 52 53 54 55 56 57 58 59 60
For Peer Review
2) to the cell through the tube on the bottom flange (l). The coherence between results obtained in previous studies [35-38] when N2 or Ar is used as diluting gas suggests that
results do not depend on the nature of diluting gas, and in this study, argon was used as the diluting gas. Then, as water is produced or brought at the fuel electrode both in fuel cell or electrolysis modes, all experiments are realized with wet fuel mixtures. The air, provided by the laboratory network, after filtering and degreasing, under atmospheric pressure, comes by the top (m and yellow arrows). In order to study the influence of humidity or saline humidity, some experiments were realized with air bubbling in water or salt water at room temperature (pH2O=0.3 atm). The excess of fuel burns with air at the edges of the cell, in the alumina
felts.
The fuel cells are submitted to the following temperature program: ramp 120 °C h-1 until the
temperature reaches 620 °C at the thermocouple, under air. Then at the 620 °C stage, 200 mL min-1 of a Ar 95% - H
2 5% mixture is provided during 15 hours. This step is necessary to
activate the anode, i.e. induce the reduction of NiO to Ni, and also remove trace amounts of pore-formers used in the anode preparation. The final measurement temperature is reached after a 120 °C h-1 ramp at the same gas flow, and the cell is fueled with the chosen gas
mixture.
2.3 Polarization curves
The current collectors, made of discs of gold grid connected to the air electrode and of nickel grid connected to the fuel electrode, are linked to the external current and voltage circuits for electrical measurements. Polarization curves are obtained by the Versastat device (Princeton Applied Research) and the associated software VersaStudio in linear square wave voltammetry mode at the 1 mV s-1 scan rate, provided by Ametek France.
Power density versus current density curves are then deduced thanks to Ohm law. From the polarization curves the Area-Specific Resistance (ASR), expressed in Ω cm², can be
3 4 5 6 7 8 9 10 11 12 13 14 15 16 17 18 19 20 21 22 23 24 25 26 27 28 29 30 31 32 33 34 35 36 37 38 39 40 41 42 43 44 45 46 47 48 49 50 51 52 53 54 55 56 57 58 59 60
For Peer Review
calculated at Open Circuit Voltage (OCV) or at any point of the curve thanks to the slope of the curve around this point.
2.4 Electrochemical impedance spectroscopy
Electrochemical impedance spectroscopy was performed at the OCV using a Versastat device and the associated software VersaStudio, in potentiostatic EIS mode, start frequency 10,000 Hz, end frequency 0.1 Hz and 20 mV or 10 mV as amplitude of the perturbation signal. This later value has been optimized for each measurement in order to get the best signal to noise ratio without any loss of the transfer function linearity [39,40]. The impedance data were analysed using ZView2-Software [41].
3 Results and Discussion
3.1 Characterization of cells working on fuel cell mode under dry air 3.1.1 Influence of the temperature and of the voltage
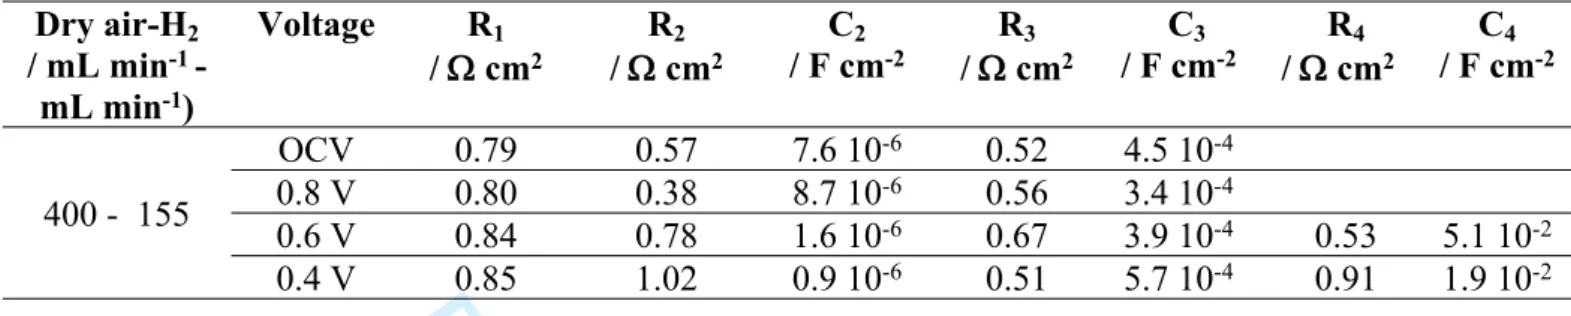
Figure 3A shows the voltage (a) and power density (b) versus current density characteristics of the cells recorded at 10 mV s-1 under wet (3% H
2O) 69% H2-31% Ar mixture (i.e.
corresponding to a H2 flow of 157 mL min-1) on the fuel side and dry air (400 mL min-1) on
the air side, and at 850 °C. The same curves obtained in the same conditions but at 750°C are shown on curves (c) and (d). As expected from Nernst equation, the Open Circuit Voltage (OCV) is higher when the temperature is smaller, whereas the slope of the curve at the origin is higher, leading finally to a crossing of the curves. Consequently, the higher the temperature, the higher the maximal power density (330 mW cm-2 at 850°C and 175 mW cm-2 at 750°C),
as observed in [20,22,35,37,42,43]. As already observed in previous studies [30,35,37,38], the use of redox-tolerant Fiaxell cells allows to decrease the voltage drastically, here at 0.4V.
3 4 5 6 7 8 9 10 11 12 13 14 15 16 17 18 19 20 21 22 23 24 25 26 27 28 29 30 31 32 33 34 35 36 37 38 39 40 41 42 43 44 45 46 47 48 49 50 51 52 53 54 55 56 57 58 59 60
For Peer Review
Curve a of Figure 3B presents the impedance diagram obtained at OCV and at 850 °C under wet (3% H2O) 69% H2-31% Ar mixture (i.e. corresponding to a H2 flow of 157 mL min-1) on
the fuel side and air (400 mL min-1) on the air side. It presents two depressed semi-circles, and
can be fitted by the electrical equivalent circuit L + R1 + (R2//CPE2) + (R3//CPE3) [24,44].The
impedance formula of the Constant Phase Elements CPE is 1/Q(j)n, with an associated
capacitance C which can be calculated from the formula
(RC)n = RQ (1) [45,46].
The inductance L is related to the wires and ranges between 0.5 10-6 H and 1.0 10-6 H for all
measurements, in accordance with literature with a similar testing set-up [47]. The series resistance R1, related mainly to the GDC/YSZ electrolyte and the set-up ohmic resistance [33,
48] is of 0.39 ± 0.05 cm2. The thickness of the electrolyte, of about 20m, i.e. twice more
than other Fiaxell cells integrating the same cathode material previously tested [49], is responsible for this rather high R1 value, but also for the rather low power density recorded
with this cell and its drastic dependence on temperature.
The capacitance C2 and C3 are respectively of 1.8 10-4 F cm-2 and 0.5 10-1 F cm-2 whereas R2
and R3 are respectively of 1.18 cm2 and 0.62 cm2. If the complete interpretation is
difficult [24], these results, in accordance with results obtained in similar conditions [20,24,28], suggest that the corresponding resistances are mainly correlated to gas phase transport across electrode surfaces, such as diffusion and adsorption phenomena [50-60], even if a small contribution of charge transfer to R2 is not excluded. Adding the three resistances
R1, R2 and R3 (i.e. corresponding to the intersection of the low frequency part of the diagram
with the real axis) gives the total resistance Rt of the cell, which corresponds also to the slope
of the U versus J curve at origin, plotted as the dotted line in Figure 3. Indeed, at OCV, the electrolyte resistance R1 contributes to only 18.5% of the total resistance of the cell.
Impedance diagrams were also plotted at 0.8V, 0.6 V and 0.4V. They present the same shape as the diagram a, and can be fitted by the same electrical equivalent circuit, with
3 4 5 6 7 8 9 10 11 12 13 14 15 16 17 18 19 20 21 22 23 24 25 26 27 28 29 30 31 32 33 34 35 36 37 38 39 40 41 42 43 44 45 46 47 48 49 50 51 52 53 54 55 56 57 58 59 60
For Peer Review
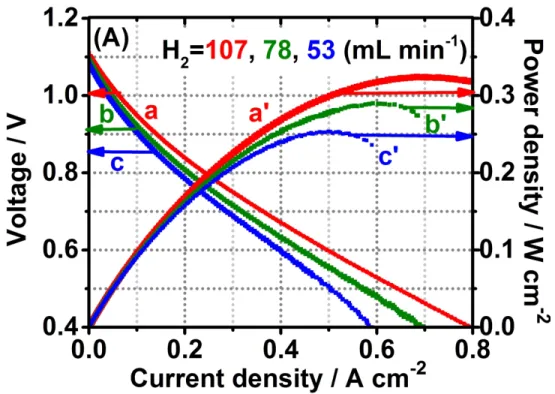
corresponding resistance and capacitance values collected in Table 1. In accordance with the regular decrease of the slope of the U/J curve when the voltage decreases (curve a of Figure 3), Rt decreases when the voltage decreases, with a minimum value at 0.6V. This Rt decrease
is mainly due to the decrease of R2 (whereas C2 remains nearly unchanged), suggesting that
the corresponding mass transfer phenomena are less rate-limiting at these voltages. The decrease of R3 contributes also to this Rt decrease, but mainly between OCV and 0.8 V. As
the electrode resistance decreases when the voltage decreases, whereas the electrolyte
resistance remain unchanged, the part of the resistance of the cell due to electrolyte increases regularly: 47,9 % at 0.8V, 55,6% at 0.6V and 61,5 % at 0.4V.
Curve b of Figure 3B presents the impedance diagrams obtained in similar conditions but at 750°C. The R1 value, of 3.27 cm2, is higher than that measured at 850 °C, in accordance
with usually reported variations of YSZ conductivities with temperature, following an Arrhenius law [48]. R2 and R3 values increase drastically, reaching respectively 3.46 cm2
and 6.16 cm2 whereas the C
2 and C3 decrease weakly, to 1.4 10-4 F cm-2 and 0.3 10-1 F cm-2.
As a consequence, the total resistance of the cell, in accordance Figure 3 (curve b), is also higher. At OCV, contribution of the electrodes to the total polarisation resistance represents 74.6 % of the total resistance of the cell.
Impedance diagrams were also plotted at 0.8V, 0.6 V and 0.4V. They present the same shape as the diagram a, and can be fitted by the same electrical equivalent circuit, with
corresponding resistance and capacitance values collected in Table 1. Whereas C2 and C3
remain unchanged, R2 and R3 decreases regularly when the voltage decreases, leading to a
regular decrease of Rt. Consequently, the contribution of the electrolyte to the total resistance
of the cell, which was only 25.4% at OCV, increases regularly when the voltage decrease to become the most resistive part of the cell: 43.1 % at 0.8V, 52.4% at 0.6V and 68.2 % at 0.4V.
3.1.2 Influence of the composition of the gases supplying the electrodes
3 4 5 6 7 8 9 10 11 12 13 14 15 16 17 18 19 20 21 22 23 24 25 26 27 28 29 30 31 32 33 34 35 36 37 38 39 40 41 42 43 44 45 46 47 48 49 50 51 52 53 54 55 56 57 58 59 60
For Peer Review
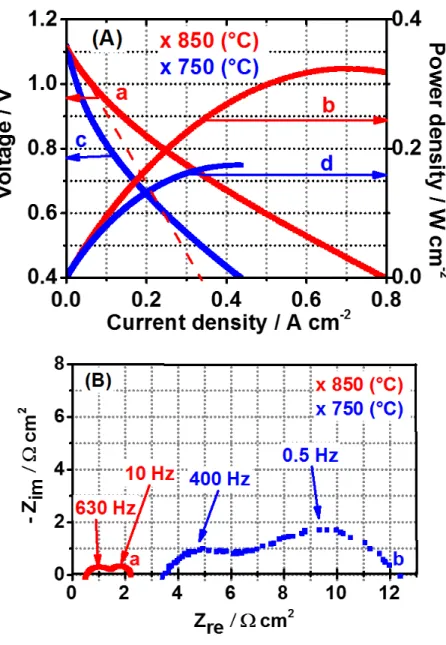
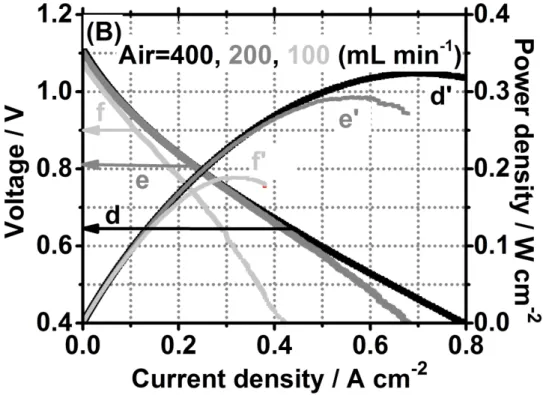
Figure 4A shows the voltage (a, b and c) and power density (a’, b’ and c’ versus current density characteristics of the cells recorded at 10 mV s-1 and at 850 °C under dry air (400 mL
min-1) on the air side and wet (3% H
2O) mixtures of 60% H2-40% Ar mixture (i.e.
corresponding to a H2 flow of 107 mL min-1) (curves a and a’), 53% H2-47% Ar mixture (i.e.
corresponding to a H2 flow of 83 mL min-1) (curves b and b’), and 44% H2-56% Ar mixture
(i.e. corresponding to a H2 flow of 57 mL min-1) (curves c and c’) on the fuel side. If curve a,
obtained for 107 mL min-1 of H
2, is nearly similar to curve a of Figure 3, a more important
decrease of the H2 concentration leads to a decrease of the maximal power density (Table 2),
in accordance with the modification of the U versus J curves. Nevertheless, for a decrease of the hydrogen flow from 157 mL min-1 to 57 mL min-1 (i.e. of 64%) the power density
decrease is only of 33%, suggesting that the fuel cell utilization yield is in fact higher when the hydrogen flow is lower. Results obtained when modifying the air flow are presented on Figure 4B. When the oxygen flow decreases, the decrease of the voltage with current density is more important, leading to a more drastic decrease of the maximal power densities (Table 2): in these cases the oxygen supply is too low compared to the hydrogen one, and the oxygen reduction becomes the rate-limiting steps. Nevertheless, as in the case for hydrogen depletion, oxygen depletion leads to an increase of the fuel utilization yield.
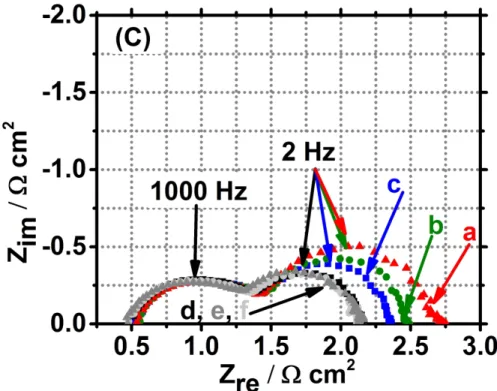
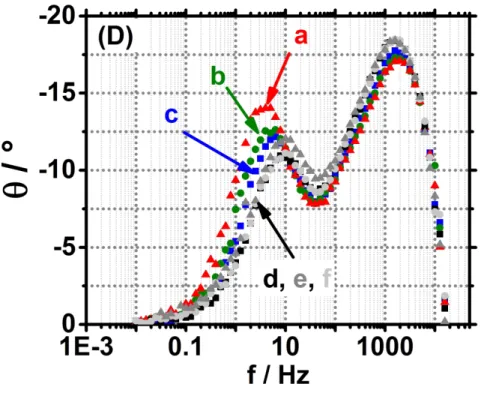
Figure 4C presents the impedance diagrams obtained at OCV for different fueling conditions. Whereas diminishing the O2 concentration doesn’t lead to change in the impedance diagram
(curves d, e and f), the decrease of the H2 concentration leads to a continuous increase of the
resistance R3. As shown on Figure 4D and Table 3, when R3 increases, the corresponding
relaxation frequency decreases, resulting in negligible change of capacitance.
Impedance diagrams were plotted at 850°C for different fueling conditions at 0.8V, 0.6 V and 0.4V. All diagrams have the same shape and can be fitted by the electrical equivalent circuit L + R1 + (R2//CPE2) + (R3//CPE3). L and R1 remain unchanged, respectively in the 0.5 10-6 H -
1.0 10-6 H and 0.39 cm2 - 0.42 cm2 ranges. Values of R
2, C2, R3 and C3 are collected in
3 4 5 6 7 8 9 10 11 12 13 14 15 16 17 18 19 20 21 22 23 24 25 26 27 28 29 30 31 32 33 34 35 36 37 38 39 40 41 42 43 44 45 46 47 48 49 50 51 52 53 54 55 56 57 58 59 60
For Peer Review
Table 3, and Figures 5A and 5B show the variations of the two resistances when the
concentrations of H2 and O2 decrease. R2 is nearly independent of the hydrogen flow at OCV
and 0.8V (curves a and c of Figure 5A), and increases slightly when the H2 flow decreases at
0.6 V and 0.4 V (curves e and g of Figure 5A). On the contrary, R3 increases regularly when
the H2 flow decreases (curves b, d, f and h of Figure 5A), suggesting that the corresponding
electrochemical process, which become drastically rate-determining, is associated to anodic mass transfer, as already observed for other Fiaxell Ni/YSZ-based cells [Error! Bookmark
not defined.,49,61]. At OCV, both R2 and R3 remain independent on the O2 flow (curves a
and b of Figure 5B), in accordance with the similarity of the slope of the corresponding U versus J curves (Figure 4B). On the contrary, and also in accordance with Figure 4B, when the voltage decreases, R2 and R3 become more and more dependent on the O2 flow, confirming
that the associated resistances are mainly correlated to cathodic phenomena, as claimed in [24]. The influence of the O2 flow on R3 become drastic at 0.6V and 0.4V, leading to a
contribution of the electrodes to the total resistance reaching 82% when the cell is fuelled with 100 mL min-1 air flow at the air side (and 157 mL min-1 H
2 flow at the fuel side), i.e. under
oxygen depletion.
3.1.3 Influence of the operation voltage onto the ageing of the cell
In order to further characterize the cells, experiments were achieved during several hours, by imposing a constant voltage at the cell, and plotting regularly the impedance diagram at this voltage. Figure 6A presents the variations of the three resistances R1 (a and d), R2 (b and e)
and R3 (c and f) when the cell is maintained at 750°C at 0.8 V (a, b and c) and 0.4 V (d, e and
f). Whereas at 0.4 V the three resistances remain constant, R2 and R3 decreases slightly at 0.8
V, in accordance with a corresponding low increase of the current density. Whereas degradation of fuel electrodes are commonly reported, for SOFC operation at these
temperatures with nickel cermet with high nickel contents or large nickel particle size [26-28], these results confirm the high quality of Fiaxell electrodes.
3 4 5 6 7 8 9 10 11 12 13 14 15 16 17 18 19 20 21 22 23 24 25 26 27 28 29 30 31 32 33 34 35 36 37 38 39 40 41 42 43 44 45 46 47 48 49 50 51 52 53 54 55 56 57 58 59 60
For Peer Review
Same experiments were carried out at 850°C, and results are presented Figure 6B. If the operation at 0.8 V doesn’t affect the values of the three resistances R1, R2 and R3 during at
least 3 days (curves a, b and c), results at 0.4 V are different, with an increase of the three resistances leading to a corresponding decrease of the current density and power of the cell, suggestion a degradation of the air electrode [23]. Therefore, at this temperature, which is more convenient to reach acceptable power density values and will be used below, it is necessary to limit the decrease of the operation voltage in order to avoid rapid ageing of the cell.
3.2 Characterization of cells working on fuel cell mode under wet air
3.2.1 Characterization of cells working on fuel cell mode under pure wet air
Similar experiments were performed under wet air. Figure 7A presents the voltage (a) and power density (b) versus current density characteristics recorded for a new cell at 10 mV s-1
under wet (3% H2O) 62% H2-38% Ar mixture (i.e. corresponding to a H2 flow of 155 mL
min-1) on the fuel side and wet (3% H
2O) air (400 mL min-1) on the air side, and at 850 °C. A
drastic decrease of the open circuit voltage and of the power density values are observed, but a power density of 206 mW cm-2 can be reached. The shape of the U versus J curve is also
very different: at origin the slope is lower, in accordance with the impedance diagram a of Figure 7B. This diagram can be fitted by the electrical equivalent circuit L + R1 + (R2//CPE2)
+ (R3//CPE3), with corresponding R2, R3, C2 and C3 values reported in Table 4. C2 and C3 are
significantly lower than in dry air, suggesting that in this case R2 is unambiguously associated
to charge transfer. R2 and R3 values are 0.18 cm2 and 0.26 cm2 (instead of1.18 cm2
and 0.63 cm2 under dry air), leading to a total resistance which is lower than under dry air.
Whereas under dry air the slope of the U/J curve decreased regularly when the current density increased, the slope of the U/J curve is rather constant at the beginning at the curve (with a slight drop around 0.8V), and increased below 0.6V. These observations are in accordance with the impedance diagrams of Figure 9B: whereas the diagram b is nearly the same as the
3 4 5 6 7 8 9 10 11 12 13 14 15 16 17 18 19 20 21 22 23 24 25 26 27 28 29 30 31 32 33 34 35 36 37 38 39 40 41 42 43 44 45 46 47 48 49 50 51 52 53 54 55 56 57 58 59 60
For Peer Review
diagram a, with a R2 decrease (0.12 cm2 instead of 0.18 cm2)partially balanced by a R3
increase (0.30 cm2 instead of 0.26 cm2), diagrams c and d reveals an important increase
of the mass transfer phenomena, with even the appearance of an additional mass transfer phenomenon at 0.4V (see Table 4).
The increase of the resistance of the cell is also correlated to an unexpected increase of R1
when the voltage decreases, suggesting that the presence of water at the air side of the cell induces a decrease of the conductivity of the electrolyte exacerbated when the current density increases. This observation is in accordance with recent studies [62], claiming that this resistance increase is correlated to a delamination of the LSCF electrode, which is associated, in some cases, to important recrystallization and lattice shrink of the LSCF material.
Moreover, these authors observed that this delamination is more important and can even be associated to an increase of the electrode resistances, when the current density increases, as we observed at 0.4V.
Finally, experiments were realized by maintaining the cell at 0.8V during several hours, and show a good stability of the performances of the cell, with just a slight decrease of the current density, mainly due to a small increase of the electrolyte resistance, reaching 0.44 cm2
(instead of 0.42 cm2) in 18 hours. This observation is also in accordance with Pan [62],
claiming that these degradation processes can be avoided, at least at low current densities, when the YSZ electrolyte is covered by a dense GDC layer, as it is the case for our cells. Curves (c) and (d) of figure 7A are obtained under wet (3% H2O) 37% H2-63% Ar mixture
(i.e. corresponding to a H2 flow of 55 mL min-1) on the fuel side and wet (3% H2O) air (200
mL min-1) on the air side. As it was observed under dry air, the decrease of the O
2 and H2
concentrations leads to an important decrease of the power density. As confirmed by
impedance diagrams (Figure 7C) and corresponding fitting values of Table 4, the resistance of the cell (and the slope of the U/J curve) increases drastically below 0.8V, due mainly to the
3 4 5 6 7 8 9 10 11 12 13 14 15 16 17 18 19 20 21 22 23 24 25 26 27 28 29 30 31 32 33 34 35 36 37 38 39 40 41 42 43 44 45 46 47 48 49 50 51 52 53 54 55 56 57 58 59 60
For Peer Review
increase of mass transfer resistances, but also to an increase of the resistance of the electrolyte.
3.2.2 Characterization of cells working on fuel cell mode under marine atmosphere
Additional experiments were carried out, always at 850°C under wet (3% H2O) 37% H2-63%
Ar mixture (i.e. corresponding to a H2 flow of 55 mL min-1) at the fuel side but under 200 mL
min-1 air bubbling in saturated salt water at room temperature (pH
2O=0.3 atm) at the air side.
In this case, a drastic decrease in OCV is observed, with a simultaneous increase of the total resistance of the cell, reaching more than 4 cm2. This detrimental effect of marine air onto
the cell is irreversible, since after several days equilibrium under under wet (3% H2O) H2 (155
mL min-1) at the fuel side and 400 mL min-1 dry air, in spite of the recovering of the OCV, the
performance of the cell remain very poor, with a maximum power density of 62 mW cm-2,
and, as shown in Table 5, a resistance of the cell increasing drastically when the voltage decreases, correlated to R1, R2 and R4 increases.
3.3 Characterization of cells working on electrolyser mode
3.3.1 Characterization of cells working on electrolyser mode under dry air
Figure 8 presents the voltage (a) and power density (b) versus current density curves obtained at 850°C under a 250 mL min-1 flow of dry (3% H
2O) 62% H2-38% Ar mixture (i.e.
corresponding to a H2 flow of 155 mL min-1) on the fuel side and dry air (400 mL min-1) on
the air side, between -0.12 A cm-2 and +0.12 A cm-2, when plotted firstly towards negative
current density values (electrolysis mode), then towards positive current density values (fuel cell mode). A power density of 125 mW cm-2 is reached at -0.12 A cm-2. The corresponding
impedance diagram plotted at -0.12 A cm-2, i.e. in electrolysis mode, presents similarities with
diagrams plotted in fuel cell mode, with C2 and C3 values of 6.1 10-4 F cm-2 and 1.6 10-1 F cm -2, with corresponding resistances of 0.46 cm2 and 0.20 cm2. As shown in Figure 8, the U
versus J curve in electrolysis mode is rather linear between 0.12 A cm-2 and -0.12 A cm-2, and
the impedance diagram is the same in this entire current density range. Therefore the
3 4 5 6 7 8 9 10 11 12 13 14 15 16 17 18 19 20 21 22 23 24 25 26 27 28 29 30 31 32 33 34 35 36 37 38 39 40 41 42 43 44 45 46 47 48 49 50 51 52 53 54 55 56 57 58 59 60
For Peer Review
resistance of the cell at OCV measured after operation in electrolysis mode is lower than after long-time fuel cell operation, in accordance with the reactivation of cells already described in [28].
If these results suggest that it is possible to work in electrolysis mode with these cell, operating conditions, with an important delivery of hydrogen on the fuel cell, doesn’t correspond to effective electrolysis conditions. Indeed, experiments have been made by suppressing the pure hydrogen delivery, and fueling the cell only with 100 mL min-1 dry (3%
H2O) 5% H2-95% Ar mixture (i.e. corresponding to a H2 flow of 5 mL min-1). In this case, the
OCV drops drastically at 0.8V, in accordance with already published results [20,22], but it is possible to set the voltage at 0.2 V versus OCV or 0.3 V versus OCV, i.e. at voltages at which there is no damage of the cathode materials. In these conditions, the current density is stable, and respective power densities of 130 mW cm-2 and 200 mW cm-2 can be observed (Table 6).
As shown on Table 6, it is also possible to further decrease the OCV and increase the power densities by decreasing the air supply (and consequently the oxygen one) from 400 mL min-1
to 100 mL min-1: in these conditions a value of 340 mW cm-2 can be obtained at 0.3 V versus
OCV. Finally additional experiments were realized by working at 850 °C alternatively in fuel cell mode at -0.2 V versus OCV under wet H2 (157 mL min-1) on the fuel side and dry air
(400 mL min-1) on the air side, then in electrolysis mode at 0.3 V versus OCV under wet H 2
(100 mL min-1) on the fuel side and dry air (100 mL min-1) on the air side, and respective
power density values of 300 mW cm-2 (at -0.2 V vs OCV) and 340 mW cm-2 (at 0.3 V vs
OCV) are obtained reproducibly. When the same experiment is done with air bubbling in water, power density values of 200 mW cm-2 (at -0.2 V vs OCV) and 340 mW cm-2 (at 0.3 V
vs OCV) are obtained.
3.3.2 Characterization of cells working on electrolyser mode under wet air
Similar experiments were done under wet air, and results are given on Table 6 for
comparison. If the additional presence of water at the air side seems induce a slight increase
3 4 5 6 7 8 9 10 11 12 13 14 15 16 17 18 19 20 21 22 23 24 25 26 27 28 29 30 31 32 33 34 35 36 37 38 39 40 41 42 43 44 45 46 47 48 49 50 51 52 53 54 55 56 57 58 59 60
For Peer Review
of the power densities recorded for an air flow of 100 mL min-1, the effect becomes negligible
for 400 mL min-1. As in SOFC mode, and in accordance with [62], operation of these type of
cells is possible without drastic degradation if the current density remains low enough. Last experiments were realized under air bubbling in salt water at room temperature (pH2O=0.3
atm) at the air side. In this case, the power density values are divided by a factor 2, and the OCV decreases drastically in some hours, forbidding ulterior measurements. Even after restoring standard conditions, i.e. 155 mL min-1 of H
2 on the fuel side and 400 mL min-1 of
wet (3% H2O) air on the air side, there is no recovering of the initial performance, suggesting
that the effect of marine atmosphere is irreversible.
4 Conclusions
It has been demonstrated that the Ni/Yttria-stabilized zirconia (YSZ) based Fiaxell cell covered by a (La0.60Sr0.40)0.95Co0.20Fe0.80O3- cathode could be successfully operated both in
fuel cell and electrolysis modes alternatively, without requiring regeneration steps, and
consequently offered good opportunity to be used in facilities in isolated sites just supplied by renewable energies. Impedance measurements confirmed that if at 750°C, the cells can be used in large voltages range, at 850°C the cell must be operated at low current density values (or near the OCV) in order to avoid degradation. It has also been shown that in the case of hydrogen or oxygen depletion, leading to power density decrease, lead nevertheless to better fuel utilization yields. Nevertheless, the cell can be further improved in order to reach higher power densities, both in electrolysis but also fuel cell modes, and studies are in progress in order to improve electrodes. Moreover, marine atmosphere seems detrimental for these cells, forbidding direct use in marine environment. Indeed simple filtering process must be added on the air side, and will be presented in a forthcoming paper.
Acknowledgements 3 4 5 6 7 8 9 10 11 12 13 14 15 16 17 18 19 20 21 22 23 24 25 26 27 28 29 30 31 32 33 34 35 36 37 38 39 40 41 42 43 44 45 46 47 48 49 50 51 52 53 54 55 56 57 58 59 60
For Peer Review
The authors are thankful to Eurostar’s funding for financial support through the European RoxSolidCell project E! 7576. 3 4 5 6 7 8 9 10 11 12 13 14 15 16 17 18 19 20 21 22 23 24 25 26 27 28 29 30 31 32 33 34 35 36 37 38 39 40 41 42 43 44 45 46 47 48 49 50 51 52 53 54 55 56 57 58 59 60
For Peer Review
References[1] K. Mazloomi, C. Gomes, Renew. Sustain. Energy Rev. 2012, 16, 3024. [2] I. Dincer, C. Acar, Int. J. Hydrogen Energy 2018, 18, 8579.
[3] Y. Zhang, R. Knibbe, J. Sunarso, Y. Zhong, W. Zhou, Z. Shao, Z. Zhu, Adv. Mater.
2017, 29, 1700132.
[4] Y. Lu, Y. Cai, L. Souamy, X. Song, L. Zhang, J. Wang, Int. J. Hydrogen Energy 2018,
43, 12870.
[5] A. Abdalla, S. Hossain, A. Azad, P. Petra, F. Begum, S. Eriksson, A. Azad, Renew.
Sustain. Energy Rev. 2018, 82, 353.
[6] Z. Pan, Q. Liu, L. Zhang, J. Zhou, C. Zhang, S. Chan, Applied Energy 2017, 191, 559. [7] Y. Zheng, Q. Li, T. Chen, W. Wu, C. Xu, W. Wang, Int. J. Hydrogen Energy2015,
40, 2460.
[8] Y. Zheng, J. Zhou, L. Zhang, Q. Liu, Z. Pan, S. Chan, Electrochim. Acta 2018, 280, 206.
[9] M. Reytier, S. Di Iorio, A. Chatroux, M. Petitjean, J. Cren, M. De Saint Jean, J. Aicart, J. Mougin, Int. J. Hydrogen Energy2015, 40, 11370.
[10] J. Aicart, F. Usseglio-Viretta, J. Laurencin, M. Petitjean, G. Delette, L. Dessemond, Int.
J. Hydrogen Energy2016, 41, 17233.
[11] F. Alenazey, Y. Alyousef, O. Almisned, G. Almutairi, M. Ghouse, D. Montinaro, F Ghigliazza, Int. J. Hydrogen Energy2015, 40, 10274.
[12] H. K. Abdel-Aal, K. Zohdy, M. Mand, A. Kareem, The Open Fuel Cells Journal 2010, 3, 1.
[13] C. K. Lim, Q. Li, J. Zhou, Q. Sun, S. Chan, J. Power Sources 2017, 342, 79. [14] G. Amikam, P. Nativ, Y. Gendel, Int. J. Hydrogen Energy2018, 43, 6504.
3 4 5 6 7 8 9 10 11 12 13 14 15 16 17 18 19 20 21 22 23 24 25 26 27 28 29 30 31 32 33 34 35 36 37 38 39 40 41 42 43 44 45 46 47 48 49 50 51 52 53 54 55 56 57 58 59 60
For Peer Review
[15] M. Frank, R. Deja, R. Peters, L. Blum, D. Stolten, Applied Energy 2018, 217, 101. [16] C. Graves, S. Ebbesen, S. Jensen, S. Simonsen, M. Mogensen, Nature Materials 2015,
14, 239.
[17] A. Hauch, M. Marchese, A. Lanzini, C. Graves, J. Power Sources 2018, 377, 110. [18] D. Vrecko, M. Nerat, D. Vrancic, G. Dolanc, B. Dolenc, B. Pregel, F. Meyer, S. Fai
Au, R. Makkus, Ð. Juricic, Int. J. Hydrogen Energy 2018, 43, 6352.
[19] F. Monaco, V. Tezyk, E. Siebert, S. Pylypko, B. Morel, J. Vulliet, T. Le Bihan, F. Lefebvre-Joud, J. Laurencin, Solid State Ionics 2018, 319, 234.
[20] M. B. Choi, B. Singh, E.D. Wachsman, S. J. Song, J. Power Sources 2013, 239, 361. [21] Y. Tao, H. Nishino, S. Ashidate, H. Kokubo, M. Watanabe, H. Uchida, Electrochim.
Acta 2009, 54, 3309.
[22] M. J. Lopez-Robledo, M. A. Laguna-Bercero, A. Larrea, V. M. Orera, J. Power
Sources 2018, 378, 184.
[23] S. P. Jiang, Int. J. Hydrogen Energy2019, 44, 7448.
[24] M. A. Laguna-Bercero, J. A. Kilner, S. J. Skinner, Chem. Mater. 2010, 22, 1134. [25] O.A. Marina, L.R. Pederson, M.C. Williams, G.W. Coffey, K.D. Meinhardt, C.D.
Nguyen, E.C. Thomsen, J. Electrochem. Soc. 2007, 154, B452.
[26] M. Keane, H. Fan, M. Han, P. Singh, Int. J. Hydrogen Energy2014, 39, 18718.
[27] K. Chen, S. P. Jiang, J. Electrochem. Soc. 2016, 163, F3070.
[28] A. hauch, M. Marchese, A. Lanzini, C. Graves, J. Power Sources 2018, 377, 110. [29] R. Ihringer, Electrochem Soc Transactions 2011, 35, 393.
[30] Fiaxell SOFC Technologies | Home, can be found under https://www.fiaxell.com,
2018
[31] S. Gao, J. Li, Z. Lin, J. Power Sources 2014, 255, 144.
3 4 5 6 7 8 9 10 11 12 13 14 15 16 17 18 19 20 21 22 23 24 25 26 27 28 29 30 31 32 33 34 35 36 37 38 39 40 41 42 43 44 45 46 47 48 49 50 51 52 53 54 55 56 57 58 59 60
For Peer Review
[32] M. Haydn, K. Ortner, T. Franco, S. Uhlenbruck, N. H. Menzler, D. Stöver, G. Braüer, A. Venskutonis, L. S. Sigi, H. P. Buchkremer, R. Vassen, J. Power Sources 2014, 256, 52.
[33] L. Zhang, F. Liu, K. Brinkman, K. L. Reifsnider, A. V. Virkar, J. Power Sources
2014, 247, 947.
[34] P. Coquoz, J. Ruiz, I. El Bakkali, C. Grize, A. Bourradou, S. Diethelm, V. Singh, R. Ihringer, paper OPR3-43 presented at the 6th International Conference on
Fundamentals and Development of Fuel Cells, Toulouse, France, 2015.
[35] A. Le Gal La Salle, F. Ricoul, O. Joubert, A. Kerihuel, A. Subrenat, Fuel cells 2017,
17, 144.
[36] M. Lebreton, B. Delanoue, E. Baron, F. Ricoul, A. Kerihuel, A. Subrenat, O. Joubert, A. Le Gal La Salle, Int. J. Hydrogen Energy, 2015, 40, 10231.
[37] F. Ricoul, A. Subrenat, O. Joubert, A. Le Gal La Salle, Int. J. Hydrogen Energy2017,
42, 21215.
[38] F. Ricoul, A. Subrenat, O. Joubert, A. Le Gal La Salle, J. Solid State Electrochem.
2018, 22, 2789.
[39] Q. A. Huang, R. Hui, B. Wang, J. Zhang, Electrochim Acta 2007, 52, 8144. [40] D. Klotz, A. Weber, E. Ivers-Tiffee, Electrochim Acta 2017, 227, 110.
[41] D. Johnson, ZView: A software program for IES analysis, Version 2.8, Scribner associates, INC, Southern Pines, NC, 2002.
[42] A. Hornes, M. J. Escudero, L. Daza, A. Martinez-Arias, J. Power Sources 2014, 249, 520.
[43] J. Qian, W. Sun, Q. Zhang, G. Jiang, W. Liu, J. Power Sources 2014, 249, 131. [44] J. Nielsen, J. Hjelm, Electrochim. Acta 2014, 115, 31.
[45] K. S. Cole, R. H. Cole, J. Chem. Phys. 1941, 9, 341.
3 4 5 6 7 8 9 10 11 12 13 14 15 16 17 18 19 20 21 22 23 24 25 26 27 28 29 30 31 32 33 34 35 36 37 38 39 40 41 42 43 44 45 46 47 48 49 50 51 52 53 54 55 56 57 58 59 60
For Peer Review
[46] J.R. MacDonald, Impedance Spectroscopy Emphasizing Solid Materials and Systems, WILEY, New York, 1987.
[47] D. Marrero-Lopez, J. Pena-Martinez, J. C. Ruiz-Morales, M. Gabas, P. Nunez, M. A. G. Aranda, J. R. Ramos-Barrado, Solid St. Ionics 2010, 180, 1672.
[48] H. Ju, J. Eom, J. K. Lee, H. Choi, T. H. Lim, R. H. Song, J. Lee, Electrochim. Acta
2014, 115, 511.
[49] A. Le Gal La Salle, M. Olivon, O. Joubert, paper presented at the Journées
d’Electrochimie, Bordeaux, France, 2017.
[50] N. Bonanos, paper presented at EIS-2008, 41st Heyrovsky Discussion, Caste Trest, Czech Republic, 2008.
[51] L. P. Sun, H. Zhao, Q. Li, L. H. Huo, J. P. Viricelle, C. Pijolat Int. J. Hydrogen Energy
2013, 38, 14060.
[52] D. Marrero-Lopez, R. Romero, F. Martin, J. R. Ramos-Barrado, J. Power Sources
2014, 255, 308.
[53] D. A. Harrington, J Electroanal. Chem. 2015, 737, 30.
[54] D. Montinaro, A. R. Contino, A. Dellai, M. Rolland, Int. J. Hydrogen Energy2014,
39, 21638.
[55] A. Leonide, V. Sonn, A. Weber, E. Ivers-Tiffee, J. Electrochem. Soc. 2008, 155, B36. [56] E. H. Kim, H. J. Jung, K. S. An, J. Y. Park, J. Lee, I. D. Hwang, J. Y. Kim, M. J. Lee,
Y. Kwon, J. H. Hwang, Ceram. Int. 2014, 40, 7817.
[57] S. Primdahl, M. Mogensen, J. Electrochem. Soc. 1999, 146, 2827.
[58] B. Philippeau, F. Mauvy, C. Mazataud, S.Fourcade, J. C. Grenier, Solid St. Ionics
2013, 249, 17.
[59] S. J. Kim, M. B. Choi, M. Park, H. Kim, J. W. Son, J. H. Lee, B. B. Kim, H. W. Lee, S. G. Kim, K. J. Yoon, J. Power Sources 2017, 360, 284.
3 4 5 6 7 8 9 10 11 12 13 14 15 16 17 18 19 20 21 22 23 24 25 26 27 28 29 30 31 32 33 34 35 36 37 38 39 40 41 42 43 44 45 46 47 48 49 50 51 52 53 54 55 56 57 58 59 60
For Peer Review
[60] D. Papurello, D. Menichini, A. Lanzini, Electrochim. Acta 2017, 258, 98.
[61] A. Le Gal La Salle, Y. Doury, R. Ihringer, O. Joubert, paper presented at the Réunion
plénière du GdR 3652 HySPàC “Hydrogène, Systèmes et Piles à combustible”, PACEOS 3, Porticcio, France, 2015.
[62] Z. Pan, Q. Liu, R. Lyu, P. Li, S. Hwa Chan, J. Power Sources 2018, 378, 571.
Figure Captions
Figure 1. Schematic representation of the cells.
Figure 2. Experimental setup used for cell feeding and heating, showing the oven (A) and the Inconel support (B) acting as the lid of the oven and maintaining the cell in the oven (details are given in experimental section).
Figure 3. A: Voltage (a and c) and power density versus current density (b and d) characteristics recorded at 10 mV s-1 under dry air (400 mL min-1) on the air side and wet (3%
H2O) H2 (157 mL min-1) fuel side at 850 °C (a and b) and 750 °C (c and d). B: Nyquist
diagrams recorded at 850 °C (a) and 750 °C (b) under dry air (400 mL min-1) on the air side
and wet (3% H2O) H2 (157 mL min-1) fuel side. Numbers mentioned above the diagram are
the frequency values.
Figure 4. A: Voltage (a, b and c) and power density versus current density (a’, b’ and c’) characteristics recorded at 10 mV s-1 under dry air (400 mL min-1) on the air side and wet (3%
H2O) H2 (a and a’: 107 mL min-1, b and b’: 83 mL min-1, and c and c’: 57 mL min-1) on the
fuel side, at 850 °C and B: Voltage (d, e and f) and power density versus current density (d’, e’ and f’) characteristics recorded at 10 mV s-1 under dry air (d and d’: 300 mL min-1, e and e’:
200 mL min-1, and f and f’: 100 mL min-1) on the air side and wet (3% H
2O) H2 (157 mL min -1) on the fuel side, at 850 °C. Corresponding Nyquist (C) and Bode (D) diagrams recorded at
850 °Cat OCV under dry air (a, b and c: 400 mL min-1, d: 300 mL min-1, e: 200 mL min-1, f:
3 4 5 6 7 8 9 10 11 12 13 14 15 16 17 18 19 20 21 22 23 24 25 26 27 28 29 30 31 32 33 34 35 36 37 38 39 40 41 42 43 44 45 46 47 48 49 50 51 52 53 54 55 56 57 58 59 60
For Peer Review
100 mL min-1) on the air side and wet (3% H
2O) H2 (a: 107 mL min-1, b: 83 mL min-1, c: 57
mL min-1, d, e and f: 157 mL min-1) on the fuel side, at 850 °C. Numbers mentioned above the
diagrams of Figure C are the frequency values.
Figure 5 A: Variations of the resistance R2 (a, c, e and g) and R3 (b, d, f and h) values
determined from impedance diagrams recorded at 850 °C under dry air (400 mL min-1) on the
air side with the flow rate of wet (3% H2O) H2 fueling the fuel side at OCV (a and b), at 0.8 V
(c and d), 0.6 V (e and f) and 0.4 V (g and h). B: Variations of the resistance R2 (a, c, e and g)
and R3 (b, d, f and h) values determined from impedance diagrams recorded at 850 °C under
wet (3% H2O) H2 (157 mL min-1) on the fuel side with the flow rate of dry air fueling the air
side at OCV (a and b), at 0.8 V (c and d), 0.6 V (e and f) and 0.4 V (g and h).
Figure 6. Variations with time of three resistances R1 (a and d), R2 (b and e) and R3 (c and f)
values determined from impedance diagrams recorded when the cell is maintained at 0.8 V (a, b and c) or 0.4V (d, e and f) under dry air (400 mL min-1) on the air side and wet (3% H
2O)
H2 (153 mL min-1) on the air side, at 750°C (A) and 850°C (B).
Figure 7. A: Voltage (a and c) and power density (b and d) versus current density characteristics recorded at 850°C and 10 mV s-1 under wet air (400 mL min-1) on the air side
and wet (3% H2O) H2 (155 mL min-1) on fuel side (a and b) and under wet air (200 mL min-1)
on the air side and wet (3% H2O) H2 (55 mL min-1) on the fuel side (c and d). Nyquist
diagrams recorded at 850°C and 10 mV s-1 under wet air (400 mL min-1) on the air side and
wet (3% H2O) H2 (155 mL min-1) on fuel side (B) and under wet air (200 mL min-1) on the air
side and wet (3% H2O) H2 (55 mL min-1) on the fuel side (C), and at OCV (a), 0.8 V (b), 0.6
V (c) and 0.4 V (d). Numbers mentioned above the diagram are the frequency values.
Figure 8. Voltage (a) and power density (b) versus current density characteristics recorded at 850°C and 10 mV s-1 under a 250 mL min-1 flow of dry (3% H
2O) 62% H2-38% Ar mixture 3 4 5 6 7 8 9 10 11 12 13 14 15 16 17 18 19 20 21 22 23 24 25 26 27 28 29 30 31 32 33 34 35 36 37 38 39 40 41 42 43 44 45 46 47 48 49 50 51 52 53 54 55 56 57 58 59 60
For Peer Review
(i.e. corresponding to a H2 flow of 155 mL min-1) on the fuel side and dry air (400 mL min-1)
on the air side, between -0.12 A cm-2 and +0.12 A cm-2. Table Captions
Table 1: Values of R1, R2, R3, C2 and C3 determined from impedance diagrams recorded when
the cell is operating under H2 (157 mL min-1) on the fuel side and dry air (400 mL min-1) on
the air side, at different temperatures and different voltages.
Table 2: Values of the maximum power density recorded at 850°C for different providing conditions.
Table 3: Values of R2, R3, C2 and C3 determined from impedance diagrams recorded at 850°C
for different wet H2 and dry air flow rates.
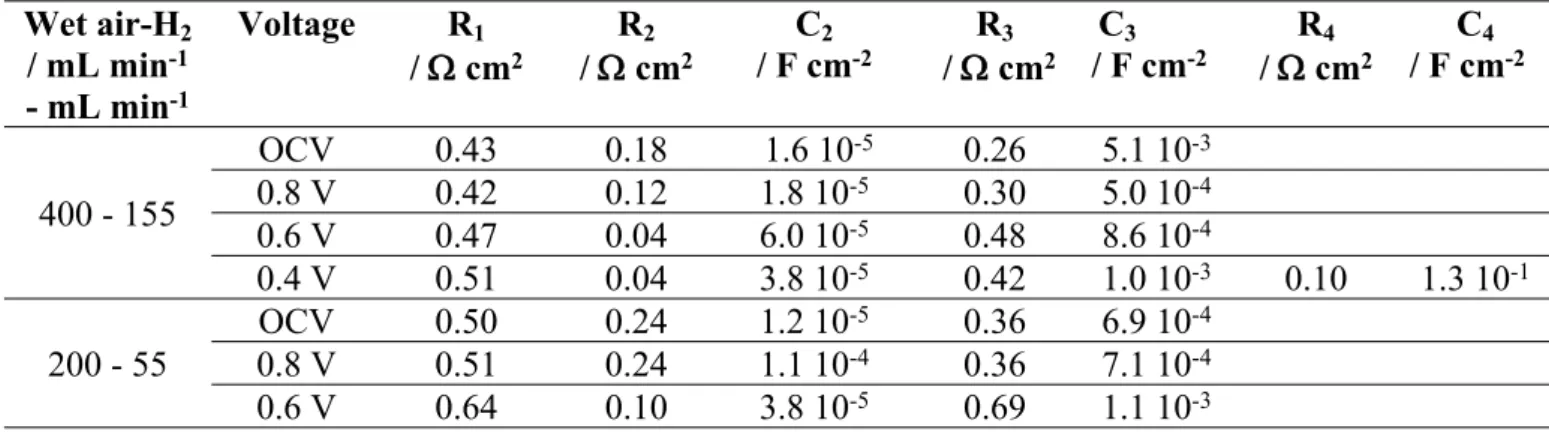
Table 4: Values of R2, R3, R4, C2, C3 and C4 determined from impedance diagrams recorded at 850°C for
different wet H2 and wet air flow rates.
Table 5: Values of R2, R3, R4, C2, C3 and C4 determined from impedance diagrams recorded at
850°C for different wet H2 and dry air flow rates after operation under wet air.
Table 6: Values of power densities measured at 0.2 V/OCV and 0.3 V/OCV for different providing conditions. 3 4 5 6 7 8 9 10 11 12 13 14 15 16 17 18 19 20 21 22 23 24 25 26 27 28 29 30 31 32 33 34 35 36 37 38 39 40 41 42 43 44 45 46 47 48 49 50 51 52 53 54 55 56 57 58 59 60
For Peer Review
TablesTable 1: Values of R1, R2, R3, C2 and C3 determined from impedance diagrams recorded when
the cell is operating under H2 (157 mL min-1) on the fuel side and dry air (400 mL min-1) on
the air side, at different temperatures and different voltages.
T / °C Voltage R1 / cm2 R2 / cm2 C2 / F cm-2 R3 / cm2 C3 /F cm-2 OCV 0.39 1.18 1.8 10-4 0.63 0.5 10-1 0.8 V 0.43 0.38 2.1 10-4 0.16 1.1 10-1 0.6 V 0.40 0.13 7.6 10-4 0.12 1.9 10-1 850 0.4 V 0.40 0.12 5.5 10-4 0.14 3.6 10-1 OCV 3.27 3.46 1.4 10-4 6.16 0.3 10-1 0.8 V 3.43 2.02 1.2 10-4 2.50 0.4 10-1 0.6 V 3.46 1.63 1.2 10-4 1.54 0.3 10-1 750 0.4 V 3.37 0.87 0.9 10-4 0.70 0.4 10-1
Table 2: Values of the maximum power density recorded at 850°C for different providing conditions.
H2 / mL min-1 Air / mL min-1 Pmax / mW cm2
107 400 308 83 400 289 57 400 253 157 300 328 157 200 292 157 100 189 3 4 5 6 7 8 9 10 11 12 13 14 15 16 17 18 19 20 21 22 23 24 25 26 27 28 29 30 31 32 33 34 35 36 37 38 39 40 41 42 43 44 45 46 47 48 49 50 51 52 53 54 55 56 57 58 59 60
For Peer Review
Table 3: Values of R2, R3, C2 and C3 determined from impedance diagrams recorded at 850°C
for different wet H2 and dry air flow rates. Polarization conditions Air-H2 / mL min-1- mL min-1 R2 / cm 2 C2 / F cm-2 R 3 / cm2 C3 / F cm-2 400 - 107 1.11 1.9 10-4 0.81 0.5 10-1 400 - 83 1.10 1.9 10-4 0.93 0.5 10-1 400 - 57 1.13 1.7 10-4 1.12 0.6 10-1 300 - 157 1.10 2.1 10-4 0.66 0.5 10-1 200 - 157 1.15 1.9 10-4 0.63 0.5 10-1 OCV 100 - 157 1.06 2.3 10-4 0.73 0.5 10-1 400 - 107 0.44 1.6 10-4 0.19 1.4 10-1 400 - 83 0.45 1.3 10-4 0.22 1.1 10-1 400 - 57 0.49 1.4 10-4 0.25 1.6 10-1 300 - 157 0.39 2.5 10-4 0.15 1.510-1 200 - 157 0.49 1.2 10-4 0.17 4.0 10-1 0.8 V 100 - 157 0.54 5.6 10-4 0.33 1.5 10-1 400 - 107 0.14 8.6 10-4 0.13 2.6 10-1 400 - 83 0.15 8.6 10-4 0.16 2.7 10-1 400 - 57 0.26 2.2 10-4 0.24 2.7 10-1 300 - 157 0.12 9.4 10-4 0.14 2.3 10-1 200 - 157 0.14 9.0 10-4 0.24 3.3 10-1 0.6 V 100 - 157 0.34 11.9 10-4 0.88 6.7 10-1 400 - 107 0.13 5.8 10-4 0.20 2.8 10-1 400 - 83 0.15 4.1 10-4 0.35 2.3 10-1 400 - 57 0.25 3.8 10-4 0.88 1.5 10-1 300 - 157 0.08 3.0 10-4 0.23 3.7 10-1 200 - 157 0.14 2.3 10-4 0.67 5.1 10-1 0.4 V 100 - 157 0.27 2.1 10-4 1.59 4.5 10-1
Table 4: Values of R2, R3, R4, C2, C3 and C4 determined from impedance diagrams recorded at 850°C for
different wet H2 and wet air flow rates. Wet air-H2 / mL min-1 - mL min-1 Voltage R1 / cm2 R2 / cm2 C2 / F cm-2 / cmR3 2 C3 / F cm-2 / cmR4 2 C4 / F cm-2 OCV 0.43 0.18 1.6 10-5 0.26 5.1 10-3 0.8 V 0.42 0.12 1.8 10-5 0.30 5.0 10-4 0.6 V 0.47 0.04 6.0 10-5 0.48 8.6 10-4 400 - 155 0.4 V 0.51 0.04 3.8 10-5 0.42 1.0 10-3 0.10 1.3 10-1 OCV 0.50 0.24 1.2 10-5 0.36 6.9 10-4 0.8 V 0.51 0.24 1.1 10-4 0.36 7.1 10-4 200 - 55 0.6 V 0.64 0.10 3.8 10-5 0.69 1.1 10-3 3 4 5 6 7 8 9 10 11 12 13 14 15 16 17 18 19 20 21 22 23 24 25 26 27 28 29 30 31 32 33 34 35 36 37 38 39 40 41 42 43 44 45 46 47 48 49 50 51 52 53 54 55 56 57 58 59 60
For Peer Review
0.4 V 0.70 0.22 4.0 10-6 0.88 2.1 10-3 0.12 1.2 10-2
Table 5: Values of R2, R3, R4, C2, C3 and C4 determined from impedance diagrams recorded at
850°C for different wet H2 and dry air flow rates after operation under wet air. Dry air-H2 / mL min-1 -mL min-1) Voltage R1 / cm2 R2 / cm2 C2 / F cm-2 / cmR3 2 C3 / F cm-2 / cmR4 2 C4 / F cm-2 OCV 0.79 0.57 7.6 10-6 0.52 4.5 10-4 0.8 V 0.80 0.38 8.7 10-6 0.56 3.4 10-4 0.6 V 0.84 0.78 1.6 10-6 0.67 3.9 10-4 0.53 5.1 10-2 400 - 155 0.4 V 0.85 1.02 0.9 10-6 0.51 5.7 10-4 0.91 1.9 10-2
Table 6: Values of power densities measured at 0.2 V (versus OCV) and 0.3 V (versus OCV) for different providing conditions.
Voltage / V (vs OCV)
Dry air - Wet H2 5%
/ mL min-1 - mL min-1 Power density/ mW cm-2 / mL minWet air - Wet H-1 - mL min2 5%-1 Power density/ mW cm-2
400/100 130 400/100 170 0.2 100/100 260 100/100 256 400/100 200 400/100 230 0.3 100/100 340 100/100 340 3 4 5 6 7 8 9 10 11 12 13 14 15 16 17 18 19 20 21 22 23 24 25 26 27 28 29 30 31 32 33 34 35 36 37 38 39 40 41 42 43 44 45 46 47 48 49 50 51 52 53 54 55 56 57 58 59 60
For Peer Review
Figure 1. Schematic representation of the cells. 187x132mm (350 x 350 DPI) 3 4 5 6 7 8 9 10 11 12 13 14 15 16 17 18 19 20 21 22 23 24 25 26 27 28 29 30 31 32 33 34 35 36 37 38 39 40 41 42 43 44 45 46 47 48 49 50 51 52 53 54 55 56 57
For Peer Review
Figure 2. Experimental setup used for cell feeding and heating, showing the oven (A) and the Inconel support (B) acting as the lid of the oven and maintaining the cell in the oven (details are given in
experimental section). 44x31mm (800 x 800 DPI) 3 4 5 6 7 8 9 10 11 12 13 14 15 16 17 18 19 20 21 22 23 24 25 26 27 28 29 30 31 32 33 34 35 36 37 38 39 40 41 42 43 44 45 46 47 48 49 50 51 52 53 54 55 56 57
For Peer Review
Figure 3. A: Voltage (a and c) and power density versus current density (b and d) characteristics recorded at 10 mV s-1 under dry air (400 mL min-1) on the air side and wet (3% H2O) H2 (157 mL min-1) fuel side at
850 °C (a and b) and 750 °C (c and d). B: Nyquist diagrams recorded at 850 °C (a) and 750 °C (b) under dry air (400 mL min-1) on the air side and wet (3% H2O) H2 (157 mL min-1) fuel side. Numbers mentioned
above the diagram are the frequency values. 42x56mm (500 x 500 DPI) 3 4 5 6 7 8 9 10 11 12 13 14 15 16 17 18 19 20 21 22 23 24 25 26 27 28 29 30 31 32 33 34 35 36 37 38 39 40 41 42 43 44 45 46 47 48 49 50 51 52 53 54 55 56 57
For Peer Review
Figure 4. A: Voltage (a, b and c) and power density versus current density (a’, b’ and c’) characteristics recorded at 10 mV s-1 under dry air (400 mL min-1) on the air side and wet (3% H2O) H2 (a and a’: 107 mL min-1, b and b’: 83 mL min-1, and c and c’: 57 mL min-1) on the fuel side, at 850 °C and B: Voltage (d, e and f) and power density versus current density (d’, e’ and f’) characteristics recorded at 10 mV s-1 under dry air (d and d’: 300 mL min-1, e and e’: 200 mL min-1, and f and f’: 100 mL min-1) on the air side and
wet (3% H2O) H2 (157 mL min-1) on the fuel side, at 850 °C. Corresponding Nyquist (C) and Bode (D) diagrams recorded at 850 °C at OCV under dry air (a, b and c: 400 mL min-1, d: 300 mL min-1, e: 200 mL min-1, f: 100 mL min-1) on the air side and wet (3% H2O) H2 (a: 107 mL min-1, b: 83 mL min-1, c: 57 mL min-1, d, e and f: 157 mL min-1) on the fuel side, at 850 °C. Numbers mentioned above the diagrams of
Figure C are the frequency values. 163x125mm (500 x 500 DPI) 3 4 5 6 7 8 9 10 11 12 13 14 15 16 17 18 19 20 21 22 23 24 25 26 27 28 29 30 31 32 33 34 35 36 37 38 39 40 41 42 43 44 45 46 47 48 49 50 51 52 53 54 55 56 57
For Peer Review
Figure 5 A: Variations of the resistance R2 (a, c, e and g) and R3 (b, d, f and h) values determined from impedance diagrams recorded at 850 °C under dry air (400 mL min-1) on the air side with the flow rate of wet (3% H2O) H2 fueling the fuel side at OCV (a and b), at 0.8 V (c and d), 0.6 V (e and f) and 0.4 V (g and
h). B: Variations of the resistance R2 (a, c, e and g) and R3 (b, d, f and h) values determined from impedance diagrams recorded at 850 °C under wet (3% H2O) H2 (157 mL min-1) on the fuel side with the
flow rate of dry air fueling the air side at OCV (a and b), at 0.8 V (c and d), 0.6 V (e and f) and 0.4 V (g and h). 33x49mm (600 x 600 DPI) 3 4 5 6 7 8 9 10 11 12 13 14 15 16 17 18 19 20 21 22 23 24 25 26 27 28 29 30 31 32 33 34 35 36 37 38 39 40 41 42 43 44 45 46 47 48 49 50 51 52 53 54 55 56 57
For Peer Review
Figure 6. Variations with time of three resistances R1 (a and d), R2 (b and e) and R3 (c and f) values determined from impedance diagrams recorded when the cell is maintained at 0.8 V (a, b and c) or 0.4V (d, e and f) under dry air (400 mL min-1) on the air side and wet (3% H2O) H2 (153 mL min-1) on the air side,
at 750°C (A) and 850°C (B). 36x56mm (500 x 500 DPI) 3 4 5 6 7 8 9 10 11 12 13 14 15 16 17 18 19 20 21 22 23 24 25 26 27 28 29 30 31 32 33 34 35 36 37 38 39 40 41 42 43 44 45 46 47 48 49 50 51 52 53 54 55 56 57
For Peer Review
Figure 7. A: Voltage (a and c) and power density (b and d) versus current density characteristics recorded at 850°C and 10 mV s-1 under wet air (400 mL min-1) on the air side and wet (3% H2O) H2 (155 mL min-1) on fuel side (a and b) and under wet air (200 mL 1) on the air side and wet (3% H2O) H2 (55 mL min-1) on the fuel side (c and d). Nyquist diagrams recorded at 850°C and 10 mV s-1 under wet air (400 mL min-1) on the air side and wet (3% H2O) H2 (155 mL min-1) on fuel side (B) and under wet air (200 mL min-1) on the air side and wet (3% H2O) H2 (55 mL min-1) on the fuel side (C), and at OCV (a), 0.8 V (b),
0.6 V (c) and 0.4 V (d). Numbers mentioned above the diagram are the frequency values. 181x138mm (450 x 450 DPI) 3 4 5 6 7 8 9 10 11 12 13 14 15 16 17 18 19 20 21 22 23 24 25 26 27 28 29 30 31 32 33 34 35 36 37 38 39 40 41 42 43 44 45 46 47 48 49 50 51 52 53 54 55 56 57
For Peer Review
Figure 8. Voltage (a) and power density (b) versus current density characteristics recorded at 850°C and 10 mV s-1 under a 250 mL min-1 flow of dry (3% H2O) 62% H2-38% Ar mixture (i.e. corresponding to a H2 flow of 155 mL min-1) on the fuel side and dry air (400 mL min-1) on the air side, between -0.12 A cm-2
and +0.12 A cm-2. 194x140mm (500 x 500 DPI) 3 4 5 6 7 8 9 10 11 12 13 14 15 16 17 18 19 20 21 22 23 24 25 26 27 28 29 30 31 32 33 34 35 36 37 38 39 40 41 42 43 44 45 46 47 48 49 50 51 52 53 54 55 56 57