OATAO is an open access repository that collects the work of Toulouse
researchers and makes it freely available over the web where possible
Any correspondence concerning this service should be sent
to the repository administrator:
[email protected]
This is an author’s version published in: http://oatao.univ-toulouse.fr/24636
To cite this version:
Gourbil, Ange
and Fichot, Florian and Prat, Marc
and Quintard, Michel
and Duru, Paul
Experimental study of the dryout of a 2D heat-generating
model porous medium. (2019) Experimental Thermal and Fluid Science, 107.
140-145. ISSN 0894-1777
Official URL : https://doi.org/10.1016/j.expthermflusci.2019.05.011
Open Archive Toulouse Archive Ouverte
Experimental study of the dryout of a 2D heat-generating model porous
medium
A. Gourbil
a,b, F. Fichot
b, M. Prat
a,c, M. Quintard
a,c, P. Duru
a,⁎ aInstitut de Mécanique des Fluides de Toulouse (IMFT), Université de Toulouse, CNRS, Toulouse, FrancebInstitut de Radioprotection et de Sûreté Nucléaire (IRSN), Division of Major Accidents Prevention, BP3 13115 St Paul lez Durance, France cCNRS, IMFT, F-31400 Toulouse, France
A B S T R A C T
Dryout experiments are performed in a quasi two-dimensional heat-generating model porous medium, with bottom flooding. The test section is composed of an array of heating cylinders placed between two ceramic plates. It is held vertically and a liquid (HFE-7000) is injected from bottom at a controlled flow rate, pressure and temperature. Dryout incipient power is investigated by applying an increasing thermal power to a bundle of heating cylinders until a dry zone is detected. The liquid inlet mass fluxes range from 1.0 kg m s2 1 to 10.5 kg m s2 1and the heat fluxes are between 195 kW m2and 1086 kW m2. Two kinds of dryout phenom-enology are observed. First, at low liquid injection rate (below 4.2 kg m s2 1inlet mass flux), reaching the dryout power results into a liquid front receding from the top of the test section to the upper limit of the heated zone, while downstream the heated zone, the porous medium is vapour-saturated. Second, at higher flow rate (over 5.2 kg m s2 1inlet mass flux), the boiling crisis happens at the surface of a single heating element, re-sulting in a local film boiling, whereas a two-phase flow still go through the whole test section. In both cases, high-speed visualizations allow characterizing 8 boiling/flow regimes, depending on the inlet mass flux, the power released by the heated zone, and the location inside the porous medium. In particular, when reaching the dryout incipient power, the existence of a pulsed flow regime is highlighted. Such a characterization of boiling/ flow regimes might be helpful in improving dryout models.
1. Introduction
In the context of nuclear safety, study of the dryout of an initially flooded bed of particles is a key topic[1,2]. Such a situation may occur following a major accident provoking the reactor core fragmentation (such as a loss of coolant accident), leading to the formation of a debris bed in the nuclear reactor vessel. This porous packing of damaged materials dissipates an important residual nuclear power. Flooding of the damaged reactor is then a mitigation procedure aiming at cooling off the debris bed in order to prevent fusion of its constitutive materials and thus to avoid the formation of a mixture of melted materials called corium, which may damage the reactor vessel and confinement struc-ture.
In the case where the particle bed is cooled down by convective boiling, the physical picture is that the production of vapor may become such that the liquid can no longer reach some location within the bed, which then dries-out. This happens at a critical power dissipated by the
particles, called incipient dryout power and the dryout heat flux, DHF, is simply defined as the incipient dryout power divided by the bed cross-section. Then, beyond the DHF, over-heating in the dried region of the bed may cause fusion of the constitutive materials and lead to the formation of a corium. The DHF can be seen as the maximal heat flux that can been extracted from the particle bed in a pool or convective boiling configuration.
Several modeling approaches have been proposed. Among them, Lipinski’s pioneering 1D approach[3]is still considered as a reference study. It is based on writing a macro-scale (i.e. Darcy-scale) model in-volving phase continuity, energy balance and momentum equations for the liquid and vapor phase, taking into account phase change. It aims at finding the vapor fraction distribution along the bed height as a func-tion of the dissipated power, assuming that all the dissipated power goes into evaporating the liquid and that thermal equilibrium between phases is achieved (all temperatures defined at macro-scale are equal to the fluid saturation temperature). A dry region is obtained when the
⁎Corresponding author.
E-mail address:[email protected](P. Duru).
https://doi.org/10.1016/j.expthermflusci.2019.05.011
vapor fraction reaches 1 at a given height in the bed and the corre-sponding dissipated power then corresponds to the dry-out flux. A huge body of literature has been devoted to improvements of Lipinski’s model, testing various correlations to describe the bed physical prop-erties, such as permeability and passability, or taking into account more realistic description of the conservation of momentum equations (e.g. introducing friction law between the phases) at the expense of the in-troduction of additional correlations, the relevance of which is not al-ready secured as they require many assumptions to be made on the pore-scale physics (phase distribution induced by the flow regime, etc…). Testing 3D formulation for the model or extended non-equili-brium models, issued from volume averaging techniques, has also been considered, see e.g.[4–6].
Many experimental studies have been led to test the theoretical predictions against experimental data, using 3D particle bed with cy-lindrical or parallelepiped geometries, see e.g.[4,7–12]. The particle bed is usually designed as a homogeneous, spherical beads packing. Some heterogeneities, in term of particle size and/or heating capacities, can be introduced, in order to model some effects likely to occur in realistic debris beds (e.g. flow bypass induced by a region of the bed more permeable as far as the two-phase flow is concerned). The pre-ferred technical solution for heating the bed is by induction. A con-vection flow is not necessarily imposed: concon-vection and pool boiling configurations have been studied. The overall aim is to measure a dryout flux, as a function of the control parameters (e.g. beads size, bed height, etc…). A major draw-back of this canonical 3D configuration is that the DHF is difficult to detect with accuracy. Most of the studies use intrusive and discrete temperature measurements using thermocouples to detect the DHF. Indirect methods using response of the bed to thermal solicitations have also been proposed. Another common point of all these experiments is that they do not allow for flow visualizations (except close to the wall) to identify flow regimes. Lipinski’s model continues to be a reference study as it allows to obtain satisfying result while being relatively simple to use: it is generally found to give a good order of magnitude for the DHF. However, comparing unambiguously and accurately DHF data to theoretical predictions, not to mention discriminating against different modeling approaches (1D vs 3D, choice of various correlations, etc…), remains elusive up until now. In a more general way, note that a recent review on two-phase flows in very permeable porous media (such as debris bed) and related applications can be found in[13].
In this paper, we study the dryout phenomenology and fluxes in a model quasi-2D heated porous medium, in a convective boiling con-figuration. Inside this test section, the particle bed is modeled as a porous stack of Pt-100 cylindrical sensors, which are used both as heating elements as well as temperature probes. One side of the test section is transparent, allowing direct flow visualizations. Such a setup has numerous advantages in the present research context, allowing direct visualizations of the pore space and thus of the flow/boiling re-gime close to dryout together with non-intrusive temperature mea-surements allowing precise determination of the dryout heat flux and location. In the following, after a brief description of the experimental set-up, the main results are presented and then discussed.
2. Experimental set-up and protocol
The main characteristics of the experimental set-up are now de-scribed. More details can be found in[14]and in[15], where the same setup is used in reflooding experiments where a liquid is injected in the heated, porous test section. Briefly, the test section is composed of 276 cylinders positioned between two ceramic plates, seeFig. 1. The spa-cing between the ceramic plates is3 mm. The staggered arrangement of the2 mm-diameter cylinders is slightly randomly disturbed: the mean center-to-center spacing between two cylinders is 3.3 mm. Therefore, the spacing between the cylinders and the cell thickness are such that the pore and throat sizes are similar to the size of the confined elements (i.e. the diameter of the heating cylinders). Also, the sizes in the mil-limeter range ensure to obtain a very permeable porous medium. Consequently, such a network of cylinders can be seen as a relevant quasi-2D counterpart of a debris bed. In fact, debris bed are known to consist of a 3D packing of particles in the millimeter size range with a high porosity (larger than 35%) and in which the flow regimes are dominated by inertial effects (high capillary and Weber numbers)
[16,17]. Moreover, in the present study, the diameter of the heating elements was chosen in such a way that the ratio of the capillary length of HFE-7000 to this diameter is similar to the one obtained when considering the ratio between the capillary length of water at100 C°
and a characteristic 5 mm particle size, typical of the one observed in debris bed[15]. Thus, realistic boiling conditions are obtained in the present experimental setup, as far as bubble size and confinement ef-fects are concerned. Because of the quasi-2D nature of the test-section, together with its idealized pore space, this set-up enters the category of “micromodels”, which have become a standard experimental tool to study porous media since pioneering works of Bonnet & Lenormand
[18]. We now insist on its main original feature, which is the possibility of heating the porous medium while controlling the thermal power released by each of the heating elements and measuring their tem-perature. To the authors’ knowledge, this functionality has never been achieved for a micromodel.
The cylinders are Pt-100 resistance temperature detectors (RTD) heated by Joule effect. They perform a dual function: they are used as both temperature probes and heating elements. The heat flux applied to each cylinder is controlled by a microelectronic servo-control system. This controlling system also allows to measure the temperature of the heating elements. The temperature measurement is performed by measuring the resistance of the RTD. There are two sources of un-certainty. The first one is related to the intrinsic accuracy of the tem-perature measurement by a Pt-100 RTD (±(0.3+0.005 ) CT ° according to the CEI 60751 standard). The second one is related to the reading of the RTD resistance by the microelectronic servo-control unit and was estimated by measuring the resistance of a precision resistor by these units, leading to a relative uncertainty of 0.8% on the measured re-sistance. Finally, standard error analysis leads to a relative error T T/ of 5% for the range of temperature probed in the present study[14]. In the heating configuration used in the present study, 80 heating elements are positioned along the fourth to tenth lines of cylinders and are controlled individually, seeFig. 1. Note the lines have been num-bered from bottom to top, as the fluid injection is from the bottom (see below). As the front ceramic plate is transparent, direct visualizations of the flow can be performed, to obtain information about the phases distribution and dynamics. A white LED ring light source facing the test cell and a fast speed PCO Dimax camera are used. Acquisition up to 1200 frames per second, at full resolution (2000×2000 pixels2) are
typically performed, with a field of view spanning the test-section width and thus extending up to 14 horizontal lines of cylinders.
The test section is held vertically. The liquid is injected at the bottom at a controlled flow rate, pressure, and inlet temperature. For the experiments presented in this paper, the working fluid is HFE-7000 (3 M Novec). Its low boiling temperature at atmospheric pressure ( °34 C) allows to study all the boiling regimes, in particular film boiling,
Nomenclature
Cp l, fluid heat capacity, J kg K1 1.
Gl fluid surfacic mass flow rate, kg m s2 1. ml fluid mass flow rate,kg s 1.
Ti fluid inlet temperature,°C. Tsat saturation temperature,°C. f fluid mass density, kg m 3.
while keeping the thermal constraints in the setup at a relatively low level. The pressure imposed at the porous section inlet is
±
1.17 0.015 barand the fluid inlet temperatureTi, measured at several
location along the first line of Pt 100 probes, is at29.5 C 1.5 C° ± ° . The thermo-physical properties of HFE at the working pressure are given in
Table 1.
Concerning the fluid line, it is first connected briefly to a vacuum pump, before filling is achieved by gravity. Temperature is controlled by a thermostatic bath and pressure by connecting the tank to a smaller reservoir mounted on a rack. The fluid mass flow rate, divided by the set-up cross-section S, is fixed by a gear pump and varied in the range
=
Gl 1 11 kg m s2 1. The pump-flow rate calibration curve is mea-sured by following the filling of the experimental cell through direct visualizations. The high temporal and spatial resolutions of the re-corded images lead to a negligible uncertainty on Gl(inferior to 1%).
The same heating power is applied to each of the 80 heating ele-ments of lines 4 to 10. The heating power is increased step by step and the system is let to relax to steady-state after each step. In order to achieve accurate measurements of the dryout fluxes, smaller and smaller power increasing steps are imposed when one gets closer to the dryout. As the smallest step in power increase for a single probe is 20 mW, the dryout power is thus measured with a80×0.02=1.6 W
accuracy which translates into a ± 13 kW m 2uncertainty on the DHF.
This uncertainty has to be compared to the observed range for the DHF, which is 200 1100 kW m 2, depending on the fluid mass flow rate
(see next section).
3. Experimental results
In this section, before turning to the thermal results regarding the dryout phenomenology and values for the dryout fluxes, we first de-scribe the flow/boiling regimes observed in the experiment.
3.1. Flow regimes
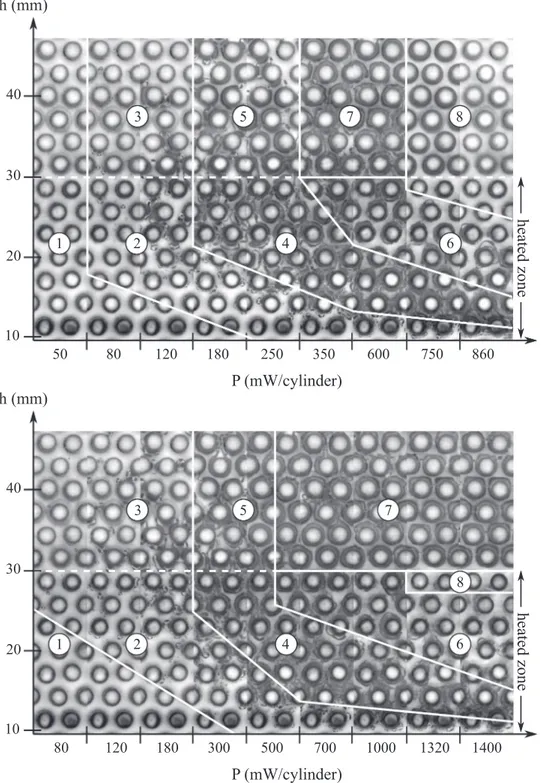
Typical flow maps for two different fluid mass flow rates are shown onFig. 2. The flow regimes observed in the test section depends on the heating power and also the location within the cell, along the flow direction. In the heated zone of the experimental cell, one will rather talk about boiling regimes while two-phase flow regimes are found in the upper region of the cell, above the heated zone, where the temperature does not change much. High resolution movies, acquired at high frame acquisition rates, are given asSupplementary Materialsto illustrate and support the descriptions of the boiling and two-phase flow regimes given in the following. The “classical” boiling regimes are recovered in the heated zone, as the dissipated power increases, beginning with nucleate boiling (regime labeled as 1 onFig. 2), followed by an intense boiling regime (labeled as 4). At larger dissipated powers, one observes the existence of a boiling region close to the heating elements whereas the vapor flows within the pore space, destabilizing liquid films and dragging isolated droplets (regime labeled as 6). A bubbly flow above the heated region (regime 3) results from the small bubbles generated through nucleate boiling (the typical size of which is well-below the pore/heating element size). As the dissipated power increases, coales-cence of the bubbles generated through nucleate boiling, while they are flow-driven through the test section, leads to the progressive formation of larger bubbles and then of large vapor slugs, extending over several
Table 1
HFE 7000 properties (liquid phase) at =P 1.17 bar: saturation temperature Tsat, mass density f, heat
capacity Cp l, and enthalpy of vaporization Hvap.
The uncertainties were estimated from the scatter in the available data.
Tsat(K) 313±1
f (kg m3) 1372±3
Cp l,(J kg K1 1) 1346±3
Hvap(kJ kg 1) 135±5
pore sizes, see label 5 onFig. 2. An interesting finding is the observation of a “pulsed” regime at high dissipated power, above the heating part of the test section, where the void fraction is close to one (label 7 on
Fig. 2). This flow regime is visualized on the third movie given as
Supplementary Materials. While being aware of the intrinsic difficulty in interpreting such two-phase flow images, it looks like the liquid phase re-organizes drastically above the heated region, with liquid films present at the junctions between the cylinders and the front and back ceramic plates. These liquid films are destabilized by the incoming vapor flow, with an upward propagation of wavy-like perturbations and
possibly coalescence of neighboring liquid films, leading to highly un-stable and transient liquid bridges.
3.2. Dryout
The phenomenology close to the dryout flux depends on the liquid mass flow rate. This is why the two flow maps given differs at high dissipated powers. For low mass fluid flow rate (Gl 4.2 kg m s2 1), a fully dry region is observed above the heated section, with the notable exception of tiny liquid droplets that are sometimes ejected from the
Fig. 2. Flow/boiling regimes maps. The seven heated rows are the bottom ones, visualizations extend up to 6 lines above the heated region. (a)Gl=3.1 kg m s2 1; (b)Gl=7.4 kg m s2 1. The flow regimes are marked out by the following numbers: 1 (liquid single-phase flow), 2 (nucleate boiling), 3 (bubbly flow), 4 (intense boiling), 5 (slug flow), 6 (vapor, liquid films and droplets), 7 (pulsed flow), 8 vapor single-phase flow (a) or localized film boiling (b).
Gl 5.2 kg m s2 1
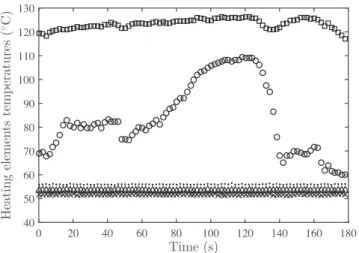
To illustrate this point,Fig. 3displays several temperature record-ings, in a local dryout configuration. The highest temperature,
°
T 120 C, is nearly constant and is observed for the only heating element which is in a film boiling regime, beyond critical heat flux (squares in Fig. 3). The other elements which are still in the intense boiling regime display a much lower temperature, around
± °
T 53 1 C(the fluid saturation temperature is 40 C° , seeTable 1). Three typical data recordings acquired in this regime are shown as dots, crosses and triangles in Fig. 3. The temperature of another heating element -not an immediate neighbor of the one displaying film boiling-displays huge fluctuations (circles inFig. 3), denoting a situation close to the transition from intense boiling to film boiling. This element will be the second one to dryout if the power is further increased, leading to the appearance of a second dry patch in its surrounding.
Fig. 4displays the dryout heat fluxes measured as a function of the liquid flow rate. When dryout occurs through complete vaporization of the injected liquid, see filled black circles in Fig. 4, the dryout flux grows linearly with the inlet mass flux. Its value is close to the theo-retical flux needed to vaporize the total amount of injected flux:
=G C T T +G H
DHFvap l p l,( sat i) l vap, (1)
which is shown as a solid line inFig. 4. The data points in this regime are approximately 10–15% above the theoretical estimate above, cer-tainly due to the power “lost” by thermal leaks through the ceramic plates. The data obtained when a localized dryout occurs are shown as
filled black diamonds. The onset of this dryout regime translates into deviation from the theoretical curve given by Eq.1. It is worth men-tioning that our results forGl<3 kg m s2 1are comparable to those presented in[19], performed in a 3D axi-symmetric configuration using freon 113 (a fluid whose thermo-physical properties are close to those of HFE 7000), also shown inFig. 4(see legend for details).
4. Discussion and conclusion
One of the key advantage of the present experimental setup is that it provides visualizations of the various flow/boiling regimes, as a func-tion of the dissipated power and locafunc-tion within the bed. Besides flow regimes already described in the boiling literature (convection, nu-cleate boiling, intense boiling, vapor slug), our experiments also display a pulsed regime for very high void fraction (close to one), with highly unstable, transient liquid bridges which are lifted up by the vapor flow. These flow-maps provide a crucial phenomenological support to any modeling effort as the knowledge of the flow regimes, and thus of the corresponding phase distribution, condition many aspects of the mod-eling, e.g. the choice of the correlations describing the porous bed re-lative permeabilities and passabilities, liquid-gas friction coefficients, etc…
In the present experiments, two distinct regimes for dryout are observed and precise measurements of the dryout fluxes are performed. The first dryout regime simply consists in a complete vaporization of the injected liquid. The second one results from a transition to film boiling around one of the heating element. A stationary situation is then obtained with a non-propagating dry region in the test section, sur-rounded by the two-phase flow resulting from intense boiling around the others heating element. This important finding can be related to a result by Atkhen & Berthoud[20], who studied the dryout of a 3D bed of particles heated by induction. These authors carefully dismantled the particle bed after their experiment and noted that some of the beads obviously melted leading to small sintered clusters of beads. This strongly suggests that some localized dryout occurred and did not propagate (at least during the duration of their experiment). Note the very high temperature reached, high enough to melt steel, were not detected by the discrete set of temperature probes placed within their bed.
The existence of localized dryout naturally questions the relevance
Fig. 3. Evolution of the temperature of some heating elements as a function of
time, in a local dryout configuration (such a situation is typically obtained when Gl 5.2 kg m s2 1). These heating elements are located along the tenth line of cylinders (i.e. the uppermost heated line). The second element from the left is in a film boiling regime (squares), the ninth from the left is about to transit from intense to film boiling (circles), while all the others are in an in-tense boiling regime.
Fig. 4. Dryout heat flux measured in the present study for complete dryout (full
circled) and localized dryout (full diamonds). Eq.1is shown as a solid line. Others data points (open circles, square and triangles) are taken from Tsai & Catton’s study[19], led with 3D axisymmetric particle bed (the particle dia-meter is given in the legend). The error bars on the theoretical prediction come from the uncertainties on the HFE properties, seeTable 1. The experimental uncertainty on the DHF is ± 13 kW m2, while the uncertainty on the fluid mass flow rate in negligible, see Section2.
boiling region and may travel up to 4 lines of cylinders. When a critical dissipating power is reached, a dry front is found to recess slowly from the top of the test section, until it stabilizes at the 7th heated line, which can takes several minutes. Then, the temperature of all the heating elements of that line increases significantly. T he d ry z one i s detected without ambiguity with a naked eye, along the 7th line (which is confirmed by the temperature recording) and above. On the contrary, at high flow r ate, , the dryout is localized around one or a few heating cylinders, which have transitioned to a film b oiling re-gime. Then, there is still a two-phase flow from the first heated line to the outlet of the test section. Consequently, this localized dryout is difficult to detect by visual inspection but temperature recordings are unambiguous. When thermal power is further increased until a second heating element dries out, it is important to note that this second ele-ment is not necessarily located close to the first one.
References
[1] M. Burger, M. Buck, G. Pohlner, S. Rahman, R. Kulenovic, F. Fichot, W.M. Ma, J. Miettinen, I. Lindholm, K. Atkhen, Coolability of particulate beds in severe ac-cidents: Status and remaining uncertainties, Prog. Nucl. Energy 52 (1) (2010) 61–75.
[2] G. Pohlner, M. Buck, R. Meignen, P. Kudinov, W. Ma, F. Polidoro, E. Takasuo, Analyses on ex-vessel debris formation and coolability in SARNET frame, Ann. Nucl. Energy 74 (2014) 50–57.
[3] R. Lipinski, A coolability model for postaccident nuclear reactor debris, Nucl. Technol. 65 (1) (1984) 53–66.
[4] E. Decossin, Ebullition et assèchement dans un lit de particules avec production interne de chaleur: premières expériences et simulations numériques en situation multidimensionnelle, Ph.D. thesis, PhD Thesis, Institut National Polytechnique de Toulouse (2000).
[5] K. Atkhen, G. Berthoud, Silfide experiment: coolability in a volumetrically heated debris bed, Nucl. Eng. Des. 236 (19–21) (2006) 2126–2134,https://doi.org/10. 1016/j.nucengdes.2006.03.061.
[6] B. Raverdy, R. Meignen, L. Piar, S. Picchi, T. Janin, Capabilities of MC3D to in-vestigate the coolability of corium debris beds, Nucl. Eng. Des. 319 (2017) 48–60. [7] A. Naik, V. Dhir, Forced flow evaporative cooling of a volumetrically heated porous
layer, Int. J. Heat Mass Transf. 25 (4) (1982) 541–552.
[8] A. Reed, E. Bergeron, K. Boldt, T. Schmidt, Coolability of UO2debris beds in
pressurized water pools: DCC-1 and DCC-2 experiment results, Nucl. Eng. Des. 97 (1) (1986) 81–88.
[9] L. Barleon, K. Thomauske, H. Werle, Extended dryout and rewetting of small-par-ticle core debris, Nucl. Eng. Des. 102 (1) (1987) 59–69.
[10] A.K. Stubos, J.M. Buchlin, Vapour channels in boiling, unconstricted particle beds-effect on the dryout heat flux, Int. J. Multiph. Flow 20 (1) (1994) 131–152. [11] A. Zeisberger, F. Mayinger, Heat transport and void fraction in granulated debris,
Nucl. Eng. Des. 236 (19–21) (2006) 2117–2123.
[12] G. Repetto, T. Garcin, S. Eymery, F. Fichot, Experimental program on debris re-flooding (PEARL). results on prelude facility, Nucl. Eng. Des. 264 (2013) 176–186. [13] Y. Davit, M. Quintard, One-phase and two-phase flow in highly permeable porous
media, Heat Transfer Eng. (2018) 1–19.
[14] A. Gourbil, Ebullition convective en milieu poreux modèle: étude expérimentale de l’assèchement et du flux critique, Ph.D. thesis, Institut National Polytechnique de Toulouse (2017).
[15] P. Sapin, A. Gourbil, P. Duru, F. Fichot, M. Prat, M. Quintard, Reflooding with internal boiling of a heating model porous medium with mm-scale pores, Int. J. Heat Mass Transf. 99 (2016) 512–520.
[16] N. Chikhi, O. Coindreau, L. Li, W. Ma, V. Taivassalo, E. Takasuo, S. Leininger, R. Kulenovic, E. Laurien, Evaluation of an effective diameter to study quenching and dry-out of complex debris bed, Ann. Nucl. Energy 74 (2014) 24–41. [17] R. Clavier, N. Chikhi, F. Fichot, M. Quintard, Modeling of inertial multi-phase flows
through high permeability porous media: friction closure laws, Int. J. Multiph. Flow 91 (2017) 243–261.
[18] J. Bonnet, R. Lenormand, Réalisation de micromodèles pour l’étude des écoulements polyphasiques en milieux poreux, Revue de l’Institut Français du Pétrole 32 (3) (1977) 477–480.
[19] T.P. Tsai, I. Catton, The effect of flow from below on dryout heat flux, J. Heat Transfer 109 (2) (1987) 491.
[20] K. Atkhen, G. Berthoud, Coolability of a 3D homogeneous debris bed, experimental and numerical investigations, in: Proc. 9th Int. Conf. on Nuclear Engineering, ICONE9, Nice, France, Vol. 142, Nice, Acropolis (France), 2001, pp. 270–282.
of the 1D macro-scale approaches used to model dryout, as discussed in recent studies [2]. Is the correlation length between dry patches com-patible with a macro-scale description (i.e. the existence of a re-presentative elementary volume)? If the answer is yes, there is a pos-sibility to derive a macro-scale model (1D in the case of a homogeneous porous column). However, its mathematical structure would be prob-ably different from the one found in Lipinski’s model. In particular, the assumption of local thermal equilibrium (i.e. equal macro-scale tem-peratures for all phases) is certainly questionable. The experimental setup may be used to further investigate this point by making available pore-scale data. More importantly, our observations suggests that the dryout results from a localized boiling crisis. This differs f rom the conventional scenario of dryout exposed in the introduction where a local dryout would be provoked by a local intense vapor production which would impair “fresh” liquid flow towards the considered region. Therefore, a specific study of the critical heat flux (CHF) leading to film boiling around a given heating cylinder is of interest, notably in a si-tuation where the heated element under study is immersed in a two-phase flow p rovoked b y c onvective b oiling a round t he neighboring elements. It is expected that the CHF will depend on the local void fraction. Such a study will be the topic of a forthcoming paper.
Finally, it is worth mentioning that the present experimental study of dryout could be extended to different h eating c onfigurations by tuning the spatial distribution of the heating elements (e.g. heating one element out of two, with an overall regular or random spatial dis-tribution of the heated elements, etc…). This would allow to simulate more realistic situations, where only the radioactive parts of the debris bed are dissipating power and/or where non-homogeneous vapor pro-duction may lead to flow by-pass effects.
Acknowledgments
Authors are particularly grateful to Ruddy Soeparno and Hervé Ayroles who contributed to the design and technical realization of the experimental setup and of the microelectronic servo-control system, respectively. Thanks also go to Electricité de France (EDF) for funding this research project.
Appendix A. Supplementary material
Supplementary data associated with this article can be found, in the online version, at https://doi.org/10.1016/j.expthermflusci.2019.05. 011.